Brief
 }
}
- Demand for oil could peak by 2030, US tight oil could become a leading source of crude and low-cost shale gas from the US is likely to disrupt global trade flows.
- Solar and wind generation could triple by 2030, but would still make up less than 20% of global power generation.
- Fuel-economy standards will have a much greater effect on oil demand than electric vehicles (EVs), but demand for fossil fuels will continue to rise.
These are some of the plausible outcomes identified in Bain & Company’s third and most recent study on the integrated economics of energy markets—specifically oil, gas, coal and renewables. (See the sidebar, “Background and methodology,” for context on this ongoing research effort.) We periodically perform this research in order to understand the disruptions under way, develop a range of possible outcomes, and help our clients form scenarios that allow them to manage their businesses in times of unprecedented uncertainty and turbulence.
In this year’s study, we combined a top-down analysis of trends, including OPEC production levels and capital costs for solar power, with a bottom-up analysis that examines such factors as breakeven costs and fuel substitutions, to come up with a broad spectrum of realistic possibilities for energy markets. From those, we developed three broad scenarios that together cover most of these potential outcomes.
- Oil and Gas Superabundance, in which oil and gas are plentiful and cheap;
- Green Transformation, in which aggressive technology advancements and policy changes accelerate the adoption of renewables; and
- Market Montage, a scenario that assumes a mid-range on disruptions and potential outcomes.
Of course, no one can definitively determine the future of markets—and we are not trying to do so. Rather, we are identifying likely outcomes that can be useful for executives in their scenario analysis, which we believe is the fundamental tool for strategic planning in uncertainty. We don’t assign a greater probability to any of our scenarios; doing so defeats the primary purpose of scenario analysis, which is to test the robustness of a strategy against multiple plausible outcomes.
As part of the process of defining these scenarios, our research identified 12 trends with the potential to disrupt the energy landscape, discussed in detail below. We then identified some of the most compelling insights revealed in our research, which together outline the range of possibilities that our scenarios address. Finally, our analysis of these scenarios, along with our conversations with industry executives, suggest three imperatives for energy management in this age of uncertainty:
- Plan for uncertainty with scenarios
- Combine top-down and bottom-up analysis to efficiently generate executable insights
- Retool business models as competitive weapons

The Future of the Global Energy Landscape
Here is a look at three scenarios for 2030 and what energy companies can do to prepare.
Twelve trends could disrupt the energy landscape by 2030
Tomorrow’s disruptions are rooted in today’s trends. To understand which are most likely to disrupt the future energy landscape, we analyzed dozens of trends, identifying plausible ranges for key variables. Twelve emerged that could credibly disrupt the energy landscape by 2030—four in the oil and gas supply, four in renewables and four in transportation.1
In the oil and gas supply, four trends relate to OPEC, tight oil and shale gas, and the global liquefied natural gas (LNG) market.
- OPEC production. The global oil market is highly sensitive to the volume of OPEC production due to its impact on the shape of the supply curve. The more OPEC produces, the flatter the supply curve and the greater the downward pressure on prices. Forecasts to 2030 for OPEC production range from under 40 million barrels of oil per day (Mbbl/d), representing no growth, to more than 50 Mbbl/d. (When we say “oil,” we mean all petroleum liquids, including crude oil, lease condensate, refinery gains and natural gas liquids.) This range has a dramatic impact on the competitiveness of oil compared with other primary fuels, as well as the competitiveness of different sources of oil compared with OPEC. However, the purpose of scenario analysis is not to ascertain the most likely outcome, but to identify material and uncertain variables around which to build scenarios. For purposes of this exercise, any points along the spectrum of plausible OPEC volumes are equally likely. We based our evaluation on the two end points stated above and a midpoint.
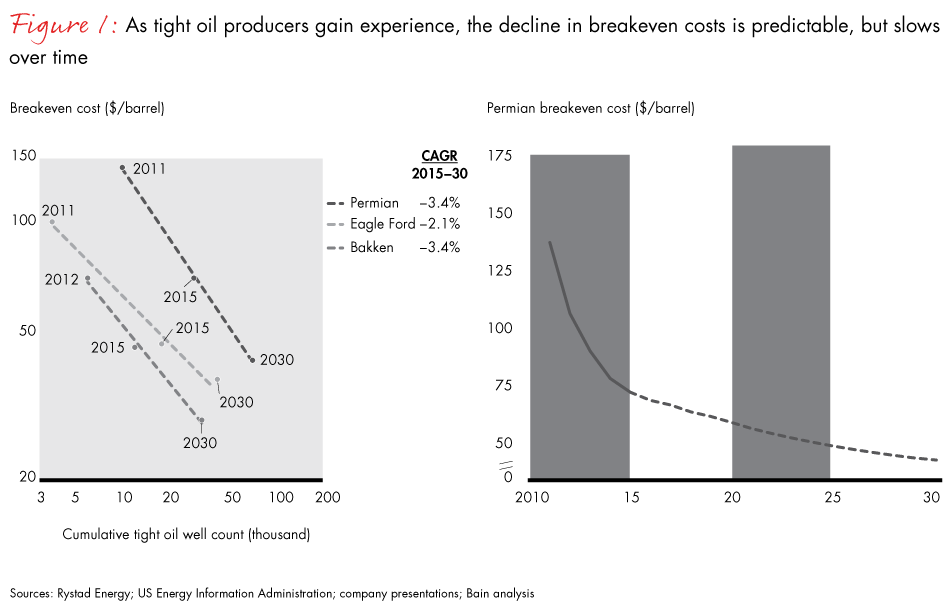
- US tight oil production. No one doubts that US tight oil has been a game changer, due largely to the remarkable decreases in costs as producers worked down the experience curve (see Figure 1). Yet, despite the predictable pattern of these reductions, healthy skepticism remains over the future trajectory of tight oil breakeven costs. Skeptics believe that various factors responsible for recent declines have been exhausted (as with high grading) or are poised to reverse (as with service costs). However, the e-curve takes these factors into account. Breakeven costs will continue to decrease each year, though these decreases will slow gradually. Because there is widespread doubt as to the reliability of the e-curve as a forecasting tool, and in keeping with our guiding principle that scenario analysis is meant to explore the impact of material and uncertain variables, we chose two settings for the e-curve: on and off. Continuation or curtailment of this trend in the US—and applicability outside the US—significantly alters the competitiveness and volume of tight oil and thereby the global clearing price.
- US shale gas production. The arguments put forth for US tight oil apply equally to US shale gas. Hence, we chose the same two settings for the US shale gas e-curve: on and off.
- US LNG exports. Unlike oil, which is a global commodity (transportation costs are not prohibitive to global movements), natural gas has remained predominantly a regional commodity. However, that’s beginning to change. As the industry gains more experience with LNG across integrated and independent oil and gas companies, new trade opportunities (such as the expanded Panama Canal), and lower-cost and interconnected regasification options, natural gas is increasingly transported across the globe. In a scenario in which the US has abundant low-cost natural gas, competitive landed cost of US LNG and plans for world-leading LNG developments, the US could be catapulted to become a leading LNG exporter. Forecasts for US LNG exports range from less than 6 billion cubic feet per day (bcfd) to more than 20 bcfd.
Four trends in renewable-power generation, particularly wind and solar power, are also likely disrupters.
- Wind and solar experience curves. Declining capital costs are making wind and solar more competitive with coal and natural gas. As with tight oil and shale gas, the rates of decline follow a predictable pattern based on global experience, since there are no meaningful regional barriers to the movement of these technologies. We analyzed interfuel competition to inform our models for progression down the e-curve and our forecasts for the levelized costs of electricity.
- Carbon regulation. The international climate action agreed to at the COP21 meeting in Paris in December 2015 represents a key disruption to power-generation markets. Global commitments at COP21 are likely to accelerate the transition away from fossil fuels. But whether these commitments are carried out as planned, relaxed or made more aggressive (the three settings we chose to capture in our scenarios) will significantly affect the substitution of renewables for fossil fuels.
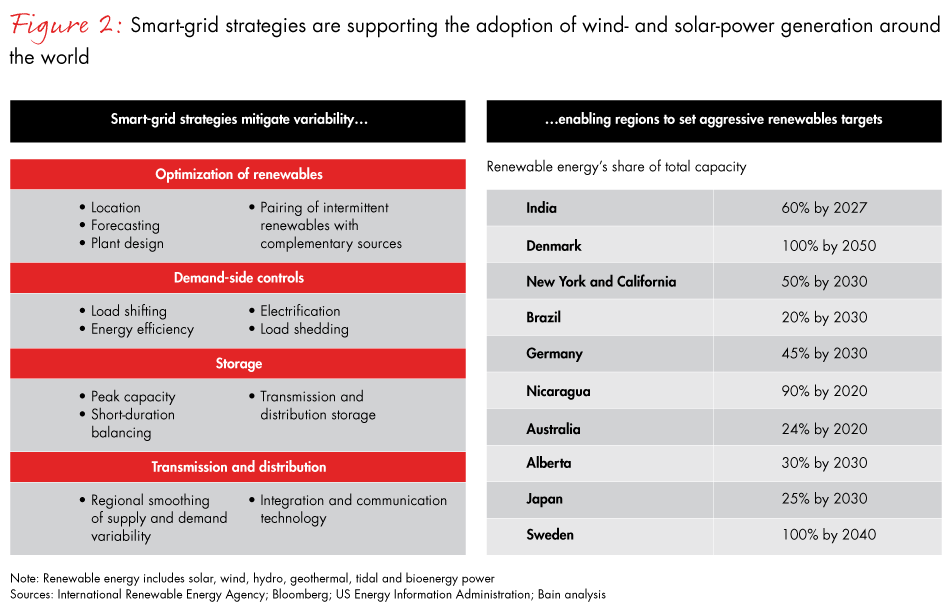
- Smart-grid strategies. Solar- and wind-power generation are on the rise. However, for renewables to constitute more than 25% of power-generation capacity in a given area, utilities need to adopt smart-grid technologies that mitigate the intermittent nature of wind and solar power. These strategies, which include large-scale storage and demand management and greater energy efficiency, are being deployed around the world to varying degrees. The success of these deployments could advance or inhibit renewables penetration (see Figure 2). Taking into account the challenges and renewables targets, we estimate that the global average for grid readiness will enable wind and solar to meet 10% to 17% of global power demand by 2030, boosting the total share of renewables in power generation (including hydropower, geothermal, tidal and bio-energy) to 30% to 43%.
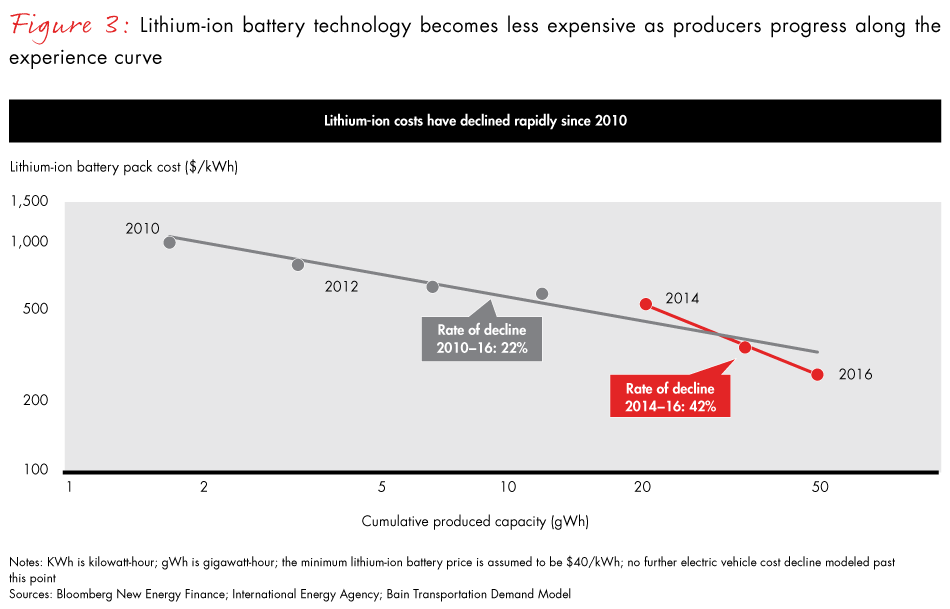
- Battery storage. Storage is one of the more important smart-grid strategies, ranging from ultra-short (as little as one minute) to intraday and multiday durations. Battery technology is far and away the frontrunner for new technology storage build-out. Pumped-storage hydro represents 95% of storage capacity today, but battery technology can be deployed virtually anywhere, and its technological development is being accelerated by the development of electric cars. Utility-scale lithium-ion battery storage could replace peaking turbines for intraday applications, but the degree and speed will depend on whether costs continue to decline as rapidly as in recent years (see Figure 3). The competitiveness of battery technology for longer-term applications is likely further off or will require a next-generation battery technology. Other battery technologies exist, but are too nascent and speculative to include in these scenarios.2
The final four potential disruptions influence the energy landscape through the demand for petroleum liquids in the transportation sector.
- Electric vehicles. EVs could cost the same as internal combustion engine (ICE) vehicles sometime between 2022 and 2027, depending on which e-curve battery technology follows (see Figure 3 again). Consumers will be more likely to buy EVs once they reach this tipping point in the next decade, spurring the transition to a more electric-vehicle fleet. Adoption curves for other modern technologies suggest EV sales could be as high as 50% by 2030. For our scenarios, we considered three points along the spectrum: 25%, 35% and 50% of global new car sales in 2030.
- Light-duty vehicle (LDV) fuel economy. Most major LDV markets have introduced strict average fuel-economy standards for new cars ranging from 49 miles per gallon (mpg) to 65 mpg by 2020 to 2025. Whether these standards are relaxed or made more aggressive will define the impact on total oil demand. For this study, we chose the range of 48 mpg to 61 mpg for global averages for new cars in 2030, which is in line with third-party projections.
- Marine bunkering. Global emissions policies (such as the UN sulfur dioxide rules and EU CO2 monitoring) along with low-priced natural gas and the build-out of LNG infrastructure will lead to natural gas increasingly replacing oil in marine bunkers, as it is cheaper than retrofitting existing ships with scrubbers or switching to diesel. Estimates for natural gas penetration of this large and growing market range from 10% to 30% by 2030.
- Aviation biofuels. The aviation subsector has few alternatives to jet fuel. Biofuels are the only known substitute, but high relative costs make economic viability uncertain. However, in an effort to make aviation more “green,” some aircraft operators are partnering with aviation biofuel makers, and we could see wide-scale deployment by 2030, further reducing demand for petroleum liquids. Estimates for biofuels penetration of this market range from 2% (representing little change) to 15%.
Jorge Leis, leader of Bain's Oil & Gas practice in the Americas, shares three strategic imperatives for preparing for tomorrow's competitive environment.
Three scenarios capture the most important trends
Based on these 12 trends, we identified a wide range of possible scenarios looking out to 2030. As noted above, these three capture the most important trends shaping the energy landscape:
- Oil and Gas Superabundance, in which oil and gas are plentiful and cheap;
- Green Transformation, in which aggressive technology advancements and policy changes accelerate the penetration of renewables; and
- Market Montage, a scenario that assumes a mid-range on disruptions and potential outcomes.
We take a decidedly rational economic approach to reach the conclusion that three scenarios are sufficient. For example, abundant, low-cost production of oil and gas from OPEC and US tight oil would likely result in lower prices and thus generate high demand for petroleum liquids. Under these conditions, the economic costs of more aggressive renewables policies (in the form of explicit or implicit subsidies) would weigh against more stringent carbon legislation—and this could result in a slight relaxation of COP21 commitments. In this way, variables that reinforce low-cost oil and gas supply correlate with variables that reinforce oil and gas demand and together mitigate adoption of renewables. By the same token, the most aggressive renewables policies are deemed most likely in an environment of less abundant oil and gas, more competitive wind and solar power, sharper reductions in battery costs and an accelerated adoption of EVs. Thus, variables that accelerate renewables adoption correlate with the most aggressive renewables technology advancements and pro-renewables policies, weakening demand for fossil fuels.
Top 10 insights portray an evolving sector
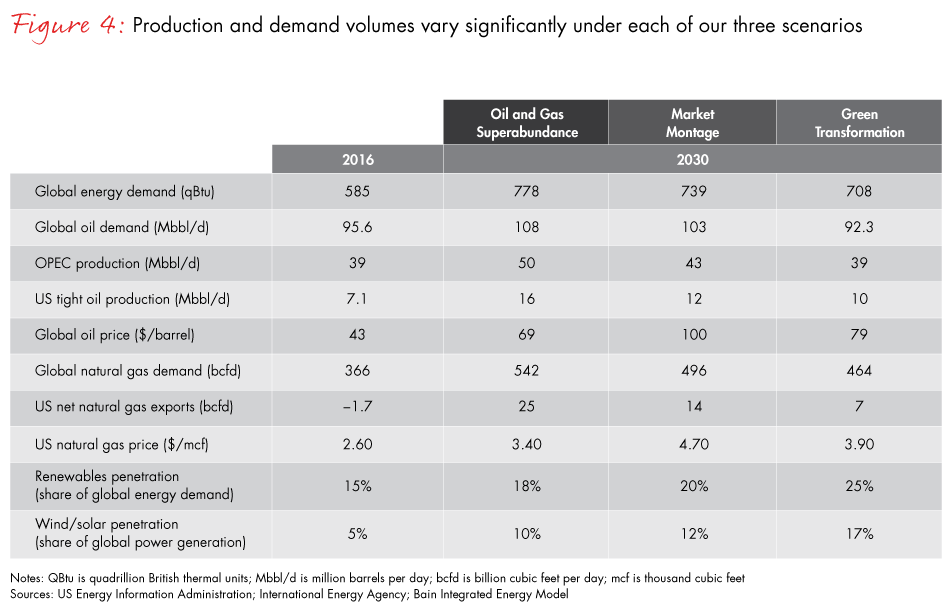
Applying these inputs to the three scenarios according to this logic produces a wide range of outputs with substantially different results (see Figure 4).
- Plausible differences in energy-efficiency assumptions can dramatically affect total energy demand. The scenarios produce a range of estimated growth in global energy demand from 20% to 33% (see Figure 5). All three scenarios were based on the same macroeconomic forecast, so they assume the same level of economic activity. The differences in total demand result primarily from different energy-efficiency assumptions (whether technologically driven or legislatively imposed). These results speak to the significant impact that different energy-efficiency and policy assumptions can have on total energy demand.
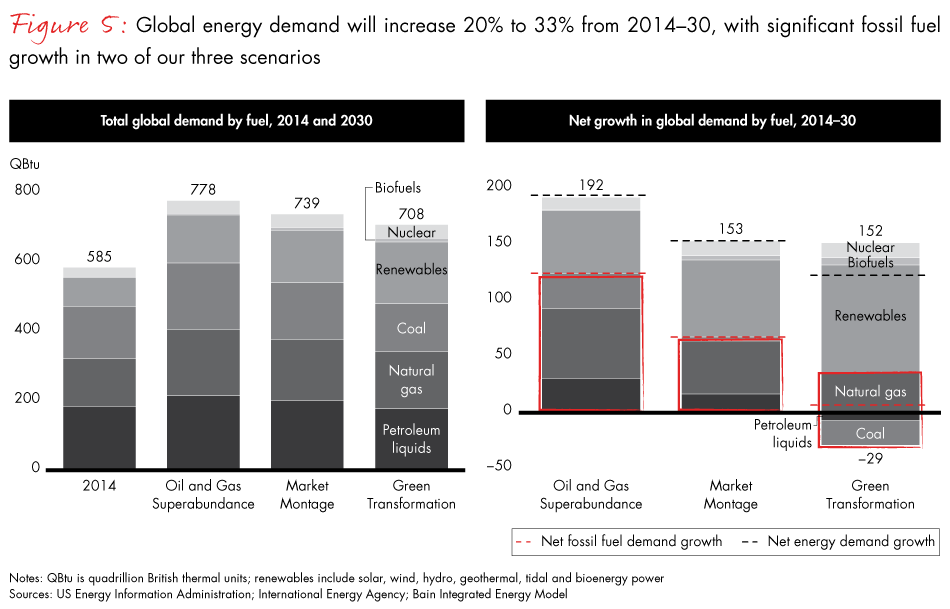
- Global demand for fossil fuels will rise, except with aggressive renewables assumptions. Globally, only Green Transformation—with its aggressive pro-renewables assumptions such as the stalling of oil breakeven-cost reductions, technological breakthroughs for wind and solar, and more stringent climate and efficiency regulations—comes close to holding fossil fuel usage in check (see Figure 5 again). But this varies by country; in the US, for example, fossil fuel demand declines in both Green Transformation and Market Montage.
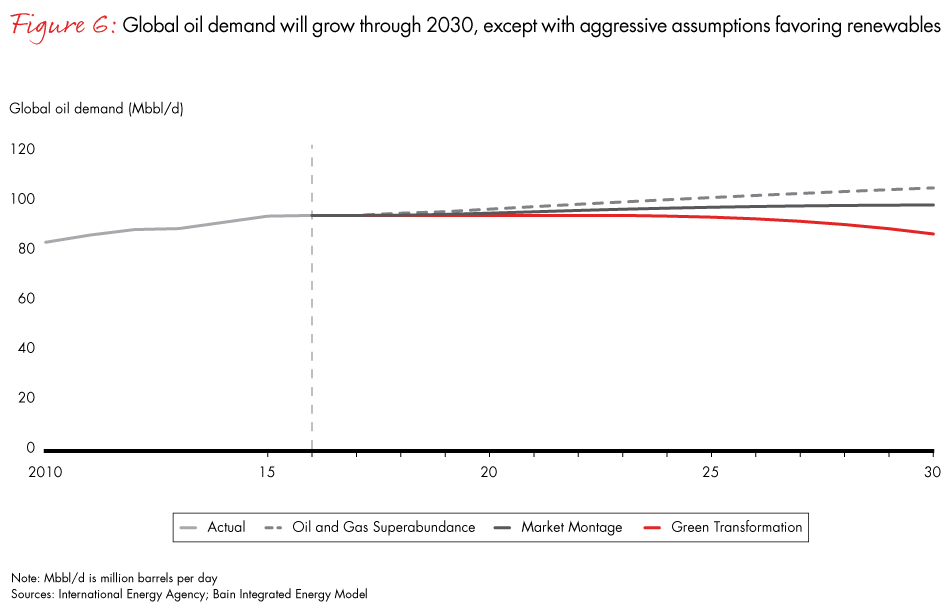
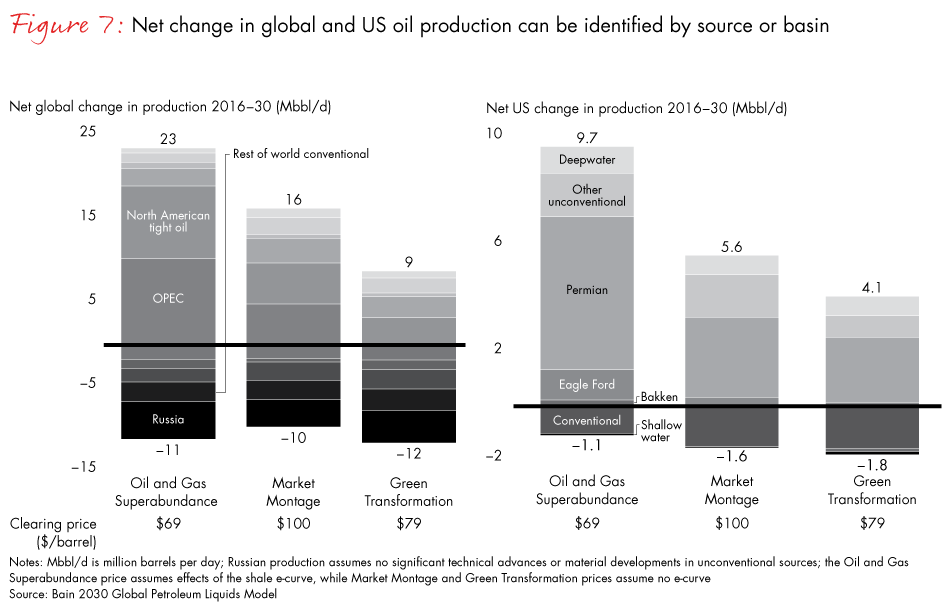
- Growth in global oil demand increases through 2030, except with aggressive pro-renewables assumptions. Our research confirms that the possibility of peak oil can be supported by supply-demand fundamentals, but requires the aggressive assumptions made in Green Transformation. However, once peak demand is reached, the decline could be quite rapid (see Figure 6). We can translate these findings into net growth by source or basin for global and US production to reflect the relative intrinsic value of the different plays under different scenarios (see Figure 7).
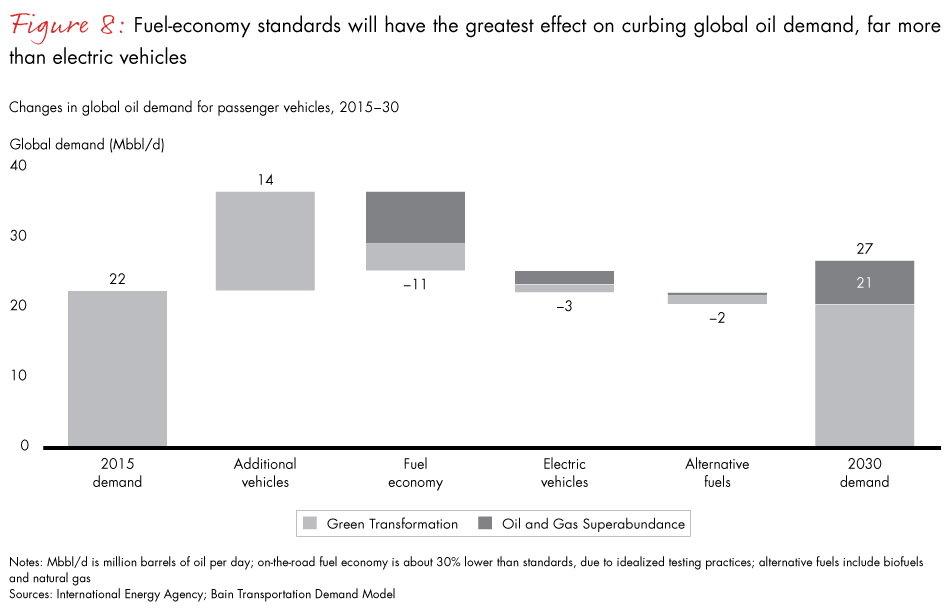
- Fuel-economy standards could have the largest impact on global oil demand, roughly four times that of EVs (see Figure 8). The slow turnover of the total stock of vehicles, which takes about 15 years, lessens the effect that EVs will have on oil demand. In the most aggressive case, Green Transformation, in which 50% of new car sales in 2030 are EVs, EVs displace only 3 Mbbl/d of oil. Somewhat ironically, more stringent fuel-economy standards would further mitigate the impact of EVs on oil demand.
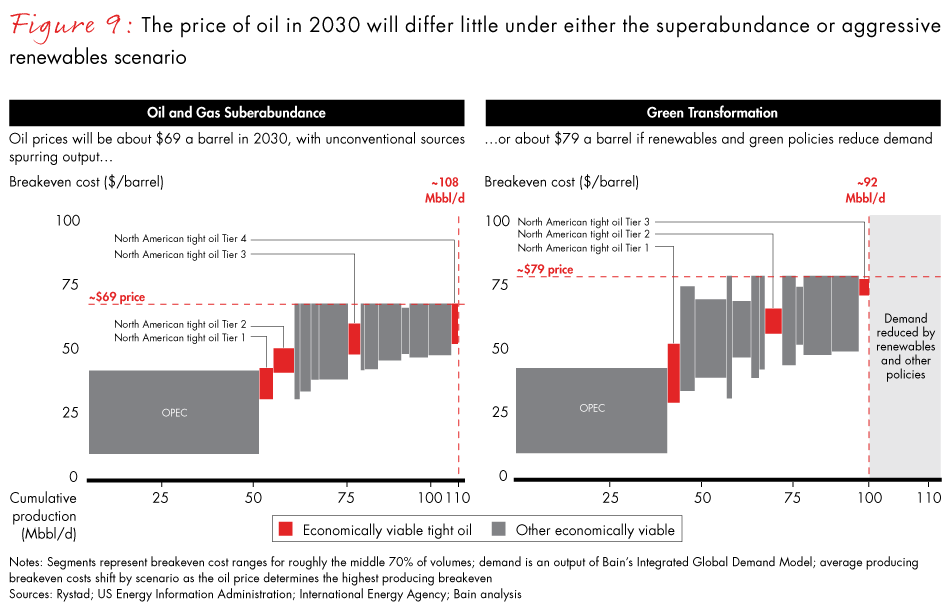
- Demand destruction from greater fuel efficiency and renewables substitution have about the same effect on oil and gas prices as an abundant, low-cost supply. In Oil and Gas Superabundance, a flatter supply curve supports a substantial increase in demand while holding the clearing price in check. In Green Transformation, demand destruction keeps higher-cost oil sources off the supply curve, thereby reducing the global clearing price (see Figure 9). The roughly $10 gap in clearing prices for these scenarios closes to only $3 if we assume breakeven costs follow the e-curve in Green Transformation. Applying the e-curve to Market Montage lowers the clearing price from $100 per barrel to about $75. So, if you subscribe to the theory of the e-curve, all three scenarios for oil prices fall within a narrow range of $69 to $75 per barrel for the foreseeable future.
- Demand from industrials could be the primary driver of robust growth in global natural gas production. Across all three scenarios, approximately 60% of the additional growth in natural gas will go to industrial uses. About 55% of industrial demand is for heating and power. The other 45% includes the transformation of primary energy into energy consumable by end-use sectors and the losses associated with these conversions (for example, petroleum refining and gas liquefaction); energy used in the extraction of other fuels (such as coal mining or oil and gas extraction); nonenergy uses such as feedstocks, lubricants and asphalt; and energy used in agriculture.
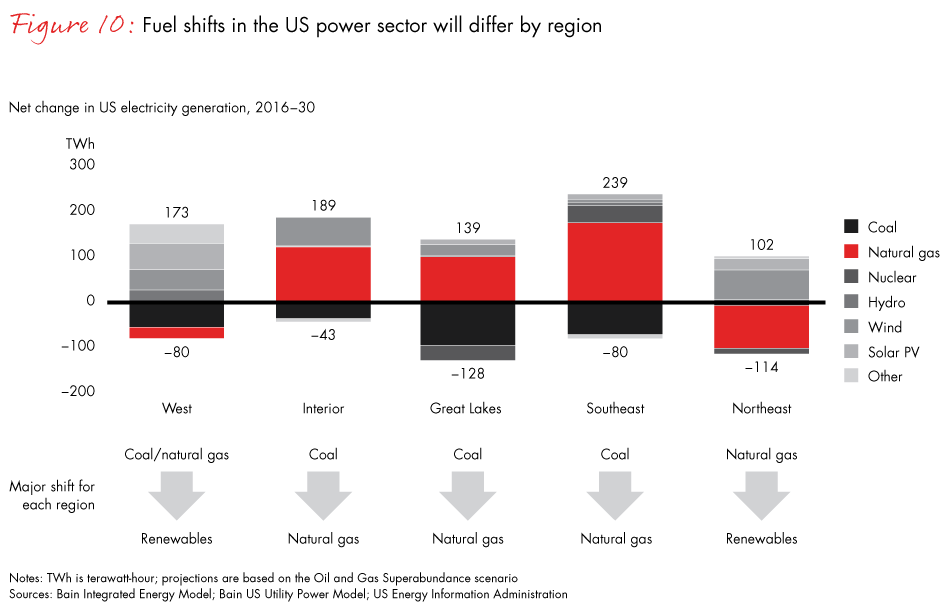
- Natural gas demand in the power-generation sector is likely to remain fairly flat. This result masks the role natural gas plays in many locales as a “bridge fuel.” On a global scale, power generation will shift from coal to renewables, but the details are much more nuanced. In some countries, like Saudi Arabia, most new generation is fueled by natural gas; in others, like India, coal is the main supply. Globally, nearly as much natural gas substitutes for coal as renewables substitute for natural gas. The US is a microcosm of this dynamic across its regions (see Figure 10). Due to the progression over time of relative costs—which are influenced not only by e-curves and policy, but by resource availability and climate patterns—regions within the US would typically transition from coal to natural gas then natural gas to renewables.
- Solar and wind generation could triple, but still make up less than 20% of global power. This is due to the relatively small starting base, but also because of the access to cheap coal in developing economies such as India, where demand for electricity is expanding rapidly.
- US tight oil could be transformed into a leading crude oil producer. The high-end forecast for production of US tight oil (which includes crude oil, lease condensate and natural gas liquids) is nearly 17 Mbbl/d. Once again, we owe this potential outcome to e-curve effects, which expand the volume from Tier 1 and Tier 2 tight oil plays and make Tier 3 and 4 plays economical (see Figure 9 again). Today, only the two lower-cost tiers are “in the money.”
- The growth in low-cost US shale gas is likely to disrupt global trade flows. Robust demand for natural gas from industrials, along with growing demand for natural gas in transportation and power generation, changes the LNG market and releases US LNG at scale to disrupt international flows by the early to mid-2020s. Gross US exports are forecast to total as much as 28 bcfd, consisting of LNG exports of 19 bcfd and pipeline exports to Mexico of 9 bcfd. These volumes are enabled by high but plausible degrees of completion and utilization of approved and proposed LNG liquefaction projects and infrastructure interconnecting the US with Canada and Mexico.
Three strategic imperatives for energy management
The future energy landscape will be defined by unprecedented uncertainty, industry turbulence and market fragmentation. Each of these attributes carries with it a strategic imperative for industry participants.
Plan for uncertainty with scenarios. Scenario analysis is the fundamental tool for strategic planning in uncertainty. However, the benefits of this type of analysis lie not in assigning probabilities to each scenario, but in testing a strategy’s robustness against each scenario. (For more on this, see the Bain Brief “What the Recent Oil Price Shock Teaches about Managing Uncertainty.”) Accordingly, we do not consider any of our scenarios as a base case around which one should optimize a strategy. Converting a set of scenarios into a weighted-average or maximum-likelihood forecast defeats the primary purpose of scenario analysis: to test the robustness of your strategy against multiple plausible outcomes. To illustrate the point, imagine an exploration and production (E&P) company assigning 20% probabilities to Oil and Gas Superabundance and Green Transformation and 60% probability to Market Montage. The resulting weighted-average clearing price would be $90 per barrel. Testing the robustness of a portfolio optimized for $90 per barrel against the full set of plausible scenarios reveals the error of this logic.
Combine top-down and bottom-up analysis to efficiently generate executable insights. The future energy landscape will be defined by a patchwork of winning fuel combinations related to intrafuel and interfuel substitutions. The aggregate impact on total demand and fuel mix will be visible and useful to forecast and track, but the competitive battles will take place on a much more localized scale as fundamental fuel economics driven by respective e-curves interact over time with location-specific resource availability, regulations and climate patterns. The resulting mosaic of possibilities will require a deep understanding of global, national, regional and local dynamics to develop proprietary points of view and to identify where and how to influence outcomes that will come in a series of micro battles—focused competitive efforts that require the application of differential resources. All industry participants will need to understand and incorporate global dynamics into their strategic planning processes; all forms of energy are increasingly interconnected and influenced by global trends and events. But where industry participants devote time and energy to develop and integrate detailed, bottom-up models differ by the type of player and strategic focus.
For example, E&P companies need resource and production profiles for each basin within their footprint, so they can identify the portfolio of assets that provide the greatest robustness, range of options and intrinsic value. For refiners, petrochemical companies and utilities, regional availability and price differentials of competing fuels and feedstock will impact the competitiveness of various assets and the next wave of major capital projects. For LNG companies, both suppliers and buyers look to exploit local natural gas advantages over time. And for manufacturers and investors in new products such as EVs and utility-scale storage, local models of target markets are critical to refine top-down forecasts, redirect capital and guide business development.
Retool business models as competitive weapons. Regardless of which scenario best captures the future trajectory of the energy industry, the 2020s will be a decade of transition. With this transition will come much turbulence and the need to respond quickly to developing events. Periods of turbulence invite new entrants and business models that further disrupt the industry—as seen in the evolution of North American unconventionals. Existing players rarely introduce these disruptive business models. Incumbents should begin to develop innovation skills and Agile processes to fine-tune their business models for a fundamentally different competitive environment in the future.
Where and how companies choose to participate in the energy market will be critical to their success in the long run. Energy executives should be asking questions that include:
- What is my long-term ambition? Will a focused US unconventionals play create long-term value, or is an integrated energy company a more viable option? Does the focused play give you enough scale, and can the integrated energy company give you enough focus and local expertise to win those micro battles?
- Where should I place my bets to build scale, create optionality and mitigate risks? Do I have the right planning tools to explore the trade-offs?
- How should I compete? Do I have the right business model to succeed? Does my business model allow me to win a series of micro battles by leveraging global, national, regional and local knowledge?
Strategy is a plan and set of actions to achieve, maintain and leverage competitive advantage. After nearly three years of intense focus on cost cutting, operational effectiveness and capital efficiency, it is time for industry executives to devote themselves to the strategic questions that will define their future success.
Background and methodology
This is the third in a series of Bain Briefs that deals with the subject of managing uncertainty in the energy industry. The first, “Beyond Forecasting: Find Your Future in an Uncertain Energy Market,” published in 2013, developed the methodology for applying scenario analysis to probe “what if” propositions, and defined signposts and leading indicators to track trends and anticipate disruptions. We took a long-term view (out to 2030) and a top-down approach (postulating outcomes that were meant to stretch the possible in order to study the effects of scenarios at the corners of our model). Although the publication preceded the collapse of oil prices by more than a year, we were able to caution our clients that an oil price below $60 per barrel was plausible and that US natural gas prices could stabilize under $4 per thousand cubic feet (mcf).
The second brief, “What the Recent Oil Price Shock Teaches about Managing Uncertainty,” published in early 2015, introduced our strategic planning wheel and reaffirmed scenario analysis as the most effective way of managing uncertainty, while incorporating the short-term dynamics that precipitated the oil price collapse of 2014. We took a narrow and medium-term view (crude oil out to 2020) and a bottom-up approach (outcomes were based on detailed breakeven economics of reservoirs and production curves). This approach allowed us to counsel our clients that despite indications in early 2015, a “V” recovery was not imminent and, barring “black swan” events, fundamental supply and demand factors did not (and still do not) support a return to $100-per-barrel oil in the medium term.
The benefits of these efforts―and much client work since―has led us to conclude that a combination of top-down and bottom-up is the most efficient way to generate executable insights from an integrative, scenario-based, strategic planning process. This is the approach we adopt in this installment. Top-down analysis allows us to pose broad assertions such as a 25% increase in OPEC production or a 40% decline in capital costs for solar power, and examine aggregate effects on total energy demand and fuel mix. Bottom-up analysis allows us to examine intrafuel substitutions (substitution within fuel types, such as shale gas for conventional gas) across the crude oil supply curve or location-specific interfuel substitutions (substitution between fuel types) across regions with different resource availability, climate patterns and regulations. These bottom-up analyses can then be used to modify the original top-down assertions.
Jorge Leis is a partner with Bain & Company in Houston. He leads Bain’s Oil & Gas practice in the Americas.
The author gratefully acknowledges Andrew Welch, a manager in Houston, and Ann Alampi, Ethan Dobbs, Rusty Hundley, Christine Larson and Matt Tramonte, all consultants in Bain’s Houston office, for their contributions to this work.
1 Other emerging trends deemed too speculative or nascent to have a meaningful impact by 2030 include new sources of low-cost oil or gas that have not currently been identified as producing, under development, discovered but undeveloped or undiscovered but probable; advanced nuclear fusion reactors; 3D printing of manufactured products; alternative-fuel vehicles (such as hydrogen fuel cells); and shifts in vehicle use trends, such as ride sharing and autonomous vehicles. Also, we did not model any disruption to the consensus long-term macroeconomic forecast. Due to the modular nature of the models, all or any subset of additional factors can be included explicitly.
2 Pumped-storage hydro (PSH) is a mature technology and expected to be the largest source of storage growth to 2030 due to build-outs in China, Europe and the US. But suitable sites for PSH are limited, whereas battery storage can be deployed anywhere. Other storage technologies (in order from shortest to longest duration) are supercapacitors, flywheels, thermal storage, compressed air and hydrogen storage.


