Report

Executive summary
This is the eleventh consecutive year that we have tracked the shopping behaviors of Chinese consumers. Our continuing research has given us a valuable long-term view across 106 fast-moving consumer goods (FMCG) categories purchased for home consumption in China. As in past years, we analyzed the 26 key categories1 that span the four largest consumer goods sectors: packaged food, beverages, personal care, and home care. This report, which updates the findings from China Shopper Report 2022, Vol. 1, China FMCG: Navigating through Turbulent Times, includes Kantar Worldpanel shopper behavior data for the first three quarters of 2022.
Written in collaboration with
Written in collaboration with

A look back at 2022’s first three quarters
China’s FMCG industry faced significant challenges in the first three quarters of 2022. At the end of 2021, just as the country had begun to rebound from Covid-19’s initial blow, a resurgence of cases disrupted supply chains, heightened consumer anxiety, and triggered another economic slowdown. Covid cases peaked in April, grinding the Yangtze River Delta economy to a halt in the second quarter. Shanghai was hardest hit, with over 28 million people impacted by a two-month, citywide lockdown.
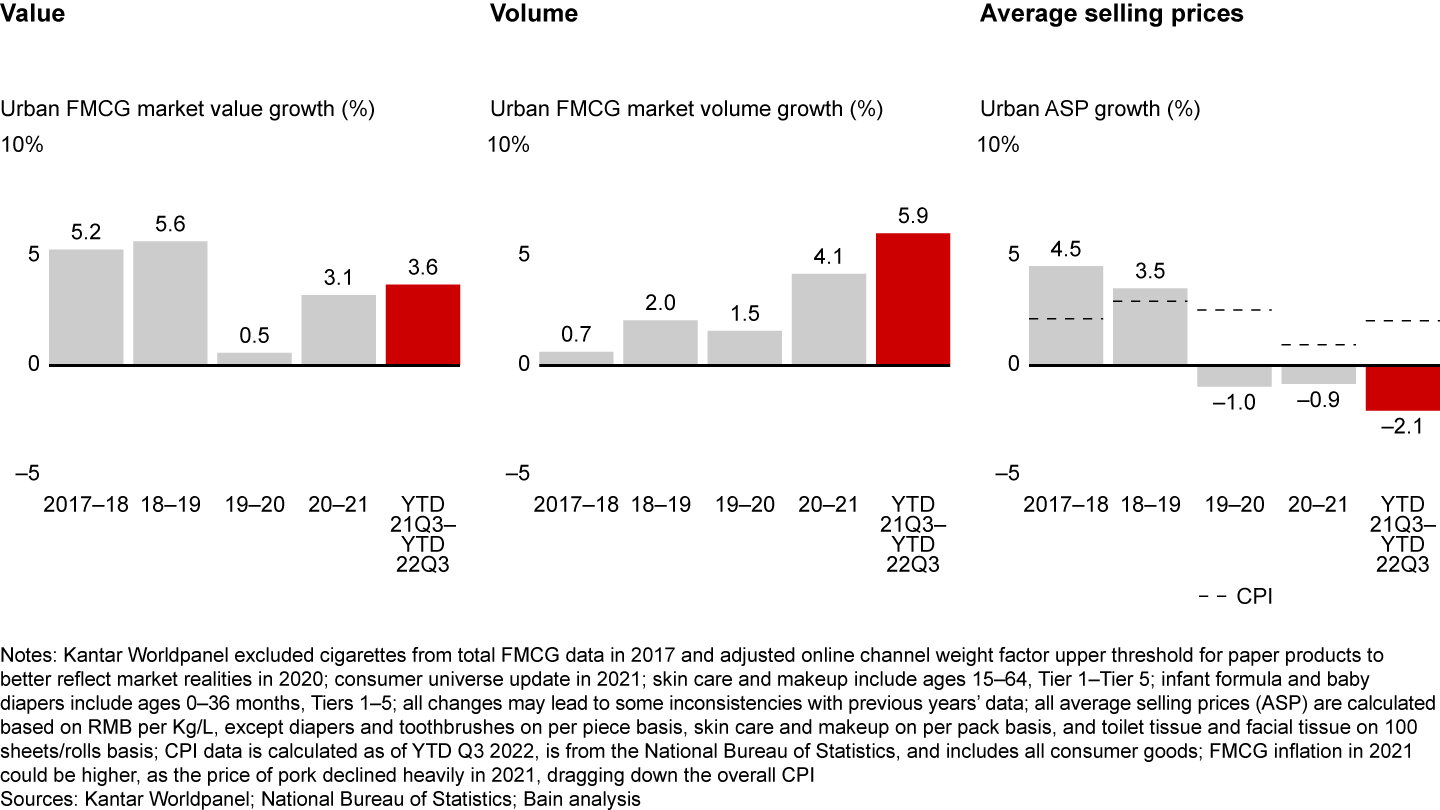
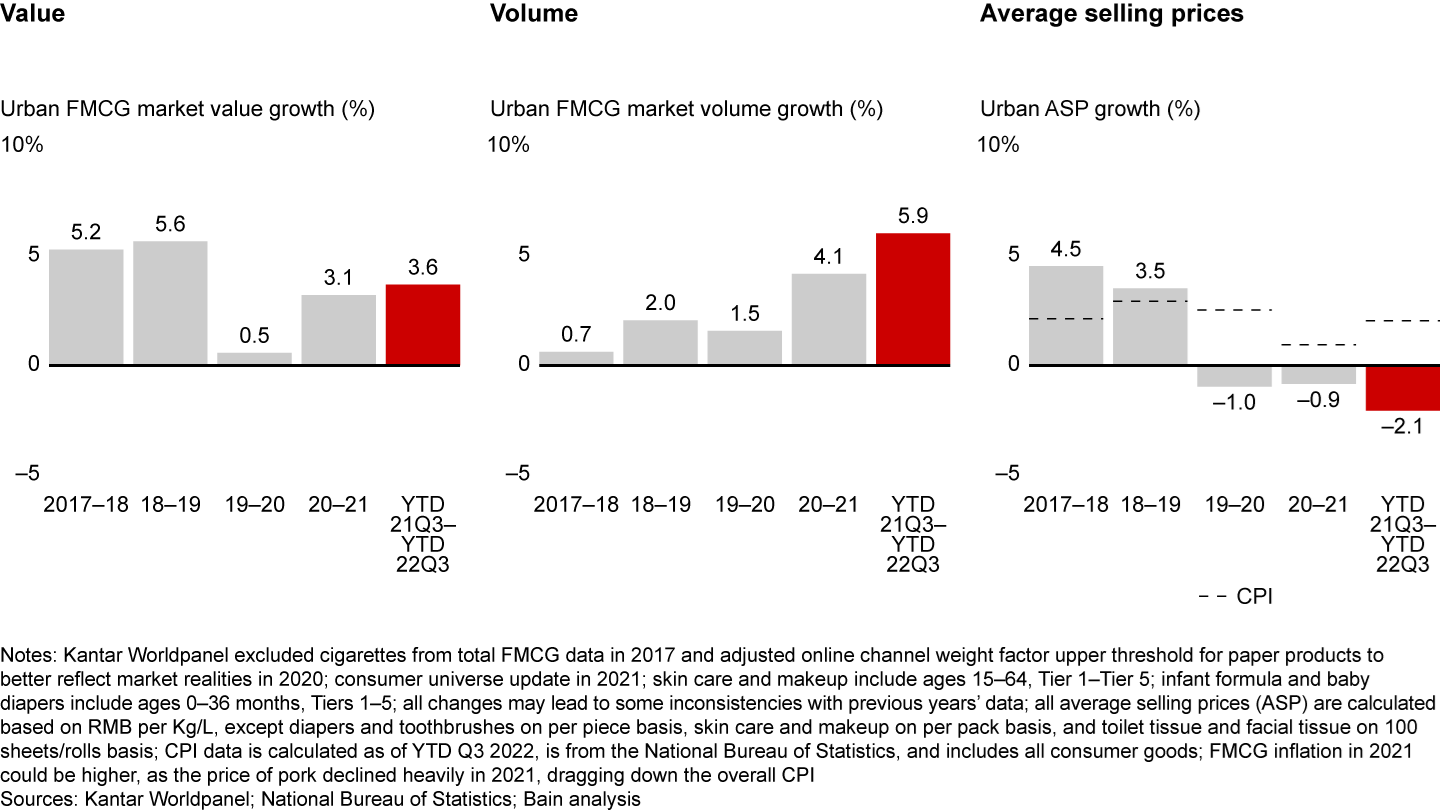
However, despite the odds, China’s FMCG industry showed resilience with 3.6% year-over-year growth and strong third-quarter recovery. This ascent exceeded China’s gross domestic product growth in the second and third quarters, reversing the trend in past years. The big hero this year was volume: Market growth was driven by a 5.9% gain, as average selling prices (ASP) continued to decline despite rising input cost.
Category update: Packaged food and home care lead
Within the four major sectors, packaged food and home care led growth during the first three quarters due to Covid-fueled stockpiling and heightened health and hygiene concerns. Packaged food alone averaged 7.4% value growth in the first three quarters of 2022, with 4.6% in volume and 2.6% in ASP. Standouts were pandemic stockpile staples like instant noodles, which saw ASP and volume increases of 5% and 13%, respectively—and a value surge of 18%. Just as the pandemic bolstered some categories, it hurt others: Impulse buys like chewing gum dropped 11% in volume.
Another key winner was beverage. Its 4.1% value increase in the first three quarters was shaped by a volume increase—mainly in the third quarter—of 7.2%, despite an ASP decline of 3%. Pent-up demand following pandemic confinement was part of the equation, but so was weather. This past summer China endured its most severe heat wave in 60 years, driving up demand for cold drinks. If there was one category that helped boost the sector it was juice, which garnered outstanding year-over-year growth of over 20%, as a result of both volume and ASP growth. The signals above point to its runaway success, but there was another driver: rising consumer sophistication amid the growing popularity of the “super fruit” segment (i.e., niche, relatively rare fruits with functional benefits such as mulberries, prunes, and blueberries). Because these juices changed consumers’ perception of juice—previously associated with unhealthy ingredients and artificiality—shoppers were more willing to pay a premium. For example, traditional big brands such as Nongfu Spring and Huiyuan have all seen growth in this segment, as have insurgent small players like iF (a Thai coconut juice brand) and Bosun (宝桑园).
In contrast, personal care reversed in trend, dropping 1.9% in value with a slight increase of 0.7% in volume and 2.5% decline in ASP. Cosmetics categories drove this plunge, and Covid provided the push. As social occasions largely came to a halt, demand and willingness to pay for premium makeup took a nosedive, resulting in a 16% drop in makeup value. While personal-hygiene-related categories like personal wash and toothpaste fared somewhat better, overall, the category suffered.
Home care saw similar pandemic-related gains as packaged food, with a value increase of 6% this year driven largely by a 5.4% volume increase and 0.6% increase in ASP. Facial tissue skyrocketed with a 11% value growth thanks to a 12% volume growth. While their increases were less pronounced, other home care categories like kitchen cleaner and fabric softener reaped the rewards of consumers’ prolonged time at home and increased focus on domesticity. Another unique growth pattern was seen with toilet tissue, which saw a 5% price increase as manufacturers passed rising raw material costs to end consumers. Despite the price hike, consumers still upped their volume 3% for this essential purchase, resulting in an 8% value growth.
An update on growth trajectories
The two-speed growth phenomenon showed similar patterns as in 2020. The high-speed cluster was largely dominated by food and beverage categories, with juice boasting a 22% value growth rate. Top spots, like instant noodles (18%) and wet tissues (14%), benefited from stockpile behaviors. Others, like ice cream (19%) and beer (14%) were benefactors of the “small treats” mentality. All told, these were mainly driven by volume growth. Low-speed categories were those deemed nonessential—particularly in a pandemic—like makeup, which fell 16%, and foreign spirits, which declined 13%.
In 2020, we identified four distinct category growth trajectories following the initial Covid outbreak. Continuous booming are those categories that benefited from Covid, followed by slower and stable growth, like soy sauce and carbonated soft drinks. Boom and stabilize categories, like household cleaner and frozen food, did well as a result of Covid—but the growth was not sustained. V-shape and stabilize categories were hit by the pandemic but rebounded after, like skin care, beer, and fabric detergent. Lastly, the L-shape group, including makeup, foreign spirits, and yogurt, all continue to decline during and after Covid.
For the most part, the trajectories of these four groups of categories showed a similar pattern as in 2020. They diverged again in the first two quarters of the year, though to a lesser extent than in 2020. Crucially, they converged quickly in the third quarter, much faster than in 2020.
Four factors created a different picture for 2022. For one, lockdowns were less expansive and were issued at the city vs. national level. After their experience in the first wave of Covid, brands were much better equipped to respond to logistics disruptions. Some even decentralized warehouses to keep fulfillment humming. As brands adapted quickly to Covid’s new normal, so did consumers, who rapidly showed signs of returning to regular consumption patterns. Finally, seasonality also had a big impact. When the lockdown lift collided with an unusually hot summer, the beverage sector soared.
Channel update: E-commerce stagnates, O2O soars
Growth in e-commerce has slowed with some categories, like facial tissue and makeup, starting to show decline in online penetration rate, while smaller offline store format (e.g., grocery, convenience stores (CVS)) gained momentum. E-commerce amounted to 5% year-over-year growth rate in the first three quarters, relative to 15% between 2020 and 2021, whereas convenience stores grew 9%, relative to nonexistent growth the prior year. Online-to-offline (O2O) shopping continued to grow as consumers wanted to stock up and fulfill instant needs while avoiding traffic and exposure in physical stores. Here, a 14.6% increase in store trips compared with last year, not to mention a 6.1% increase in shopper base, was a key growth driver. Among the four O2O platform types, community group buying (CGB) captured the lion’s share at 46% this year, up from 39% last year.
At-home vs. out-of-home: similar patterns observed as in 2020
At-home food and beverage consumption2 saw marked improvement as consumers sheltered in place—and in fact was even higher than in 2020. Not surprisingly, out-of-home consumption dropped after a year of recovery in 2021, as Covid measures restricted outdoor activities and social gatherings. Out-of-home accounted for 44% of spend, compared with 49% in 2021 for select food and beverage categories2 in Tier 1 and 2 cities. Within both at-home and out-of-home consumption, we observed variances in terms of channel and category preferences between high-tier and low-tier cities.
Demystifying price trends
In this edition, we have paid special attention to how consumers responded to price increase in various FMCG categories. Overall, we saw that ASP declined by 2.1% in the first three quarters vs. last year—continuing the deflationary trend observed since 2020—but the reaction to the decline differed by sector. While seeking more value-for-money products seems to be a common trend, food and beverage saw a volume increase with consumers stocking up on larger pack size items. Personal care and home care, on the other hand, saw a shift toward less expensive products and channels. Promotion activities largely remained unchanged, except in personal care which rose 2.8% between 2020 and 2022, as it increasingly relied on sales amid compressed demand.
A return of three pricing patterns—plus an emerging one
While the four distinct pricing patterns we identified in Volume 1 largely still hold true, polarization within category was less remarkable in the first three quarters of 2022. Consumers continued to premiumize, with carbonated soft drinks, beer, and fabric detergent leading this segment largely thanks to continual innovation and the introduction of new formats and flavors.
In the trade up to mid-range cohort, toothpaste, personal wash, and infant formula were strong players. In the case of personal wash, consumers opted for familiar brands that reinforced “top-of-mind” brand value over premium ones. Toothpaste brands like Yunnan Baiyao steadily gained share by emphasizing functional claims that addressed consumers’ pain points.
Consumers’ stockpiling behavior during Covid outbreaks brought about a new pattern unique to 2022: larger pack stock-up. Packaged water and facial tissue both saw a 1% decline in ASP, as sporadic Covid lockdowns motivated consumers to purchase daily essentials in bulk, which dragged down the average price point per unit.
Finally, in the flight to value group, we observed consumers’ growing preference for value-for-money options rise with inflation. In skin care, there was a noteworthy shift toward more affordable products through domestic substitution. Yogurt, makeup, and other nonessential purchases continued their steady decline across all price tiers.
Looking at the city tiers, price trend differences were most pronounced in beverage and home care categories, where Tier 1 cities scored positive ASP growth and reached approximately 5 percentage-point-variance with Tier 5 cities. These cities also drove growth in categories with ongoing premiumization like carbonated soft drinks, beer, and fabric detergent. In contrast, the downward ASP trend in lower-tier cities was driven by value-seeking behaviors, including trading down to more affordable alternatives or purchasing larger pack sizes.
What’s next—and implications for brands and retailers
Following a challenging three quarters bearing the brunt of Covid, next year is likely to remain volatile. By keeping their fingers on the pulse of changing consumer needs and making strategic adjustments, brands and retailers alike can position themselves for success.
Implications for brands: In a challenging market, it’s important to pursue new growth engines. Brands can expand into new geographies, segments, or channels by keeping their finger on the pulse of market and consumer trends. Rising input costs and supply chain disruptions put efficiency at the forefront, too. Cost management becomes an important lever to explore in this turbulent market. Meanwhile, brands should adopt a test-and-learn approach to maximize marketing effectiveness, while optimizing pricing and promotion to boost revenue potential. Finally, this volatile climate demands that brands stay flexible, making risk mitigation and scenario planning key strategies for success.
Implications for retailers: As the retail industry faces continued deflationary pressures, retailers must shift focus from gross merchandise value (GMV) and topline growth to sustainable operations and profit margin. Improving shopper loyalty via differentiated services and consumer engagement is critical. As consumers spend less, retailers need to establish a differentiated portfolio and attract traffic with private label or exclusive products.
Despite great uncertainty, there are reasons for FMCG players to be hopeful. China’s middle class continues to grow, along with urbanization. A controlled rising input cost trend is on the horizon, and confidence in consumer spending is expected to return. With a nuanced approach, based on understanding consumer needs and building agility into operations, adaptable FMCG companies can chart a path toward healthy performance in 2023 and beyond.
Overall FMCG trends: resilience despite the odds
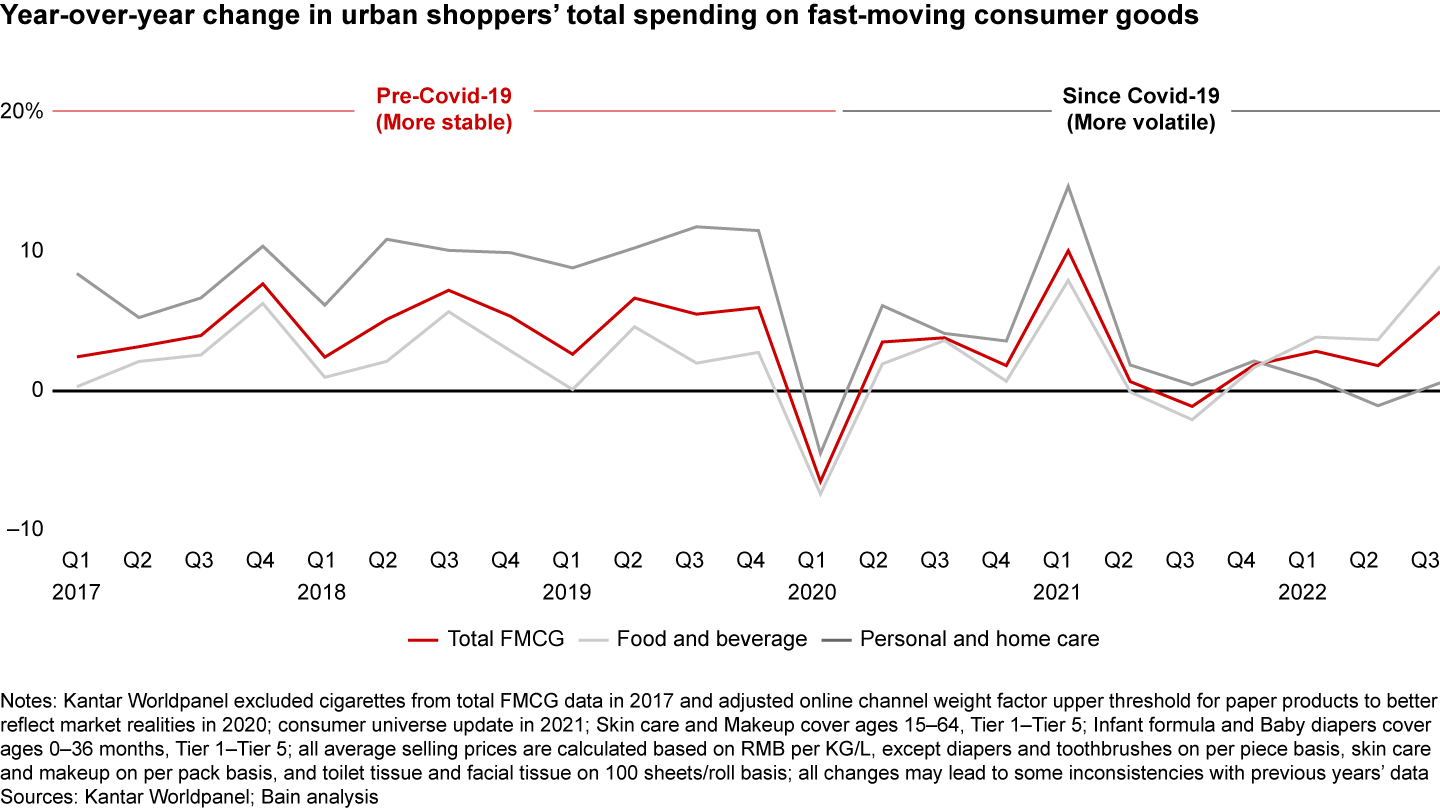
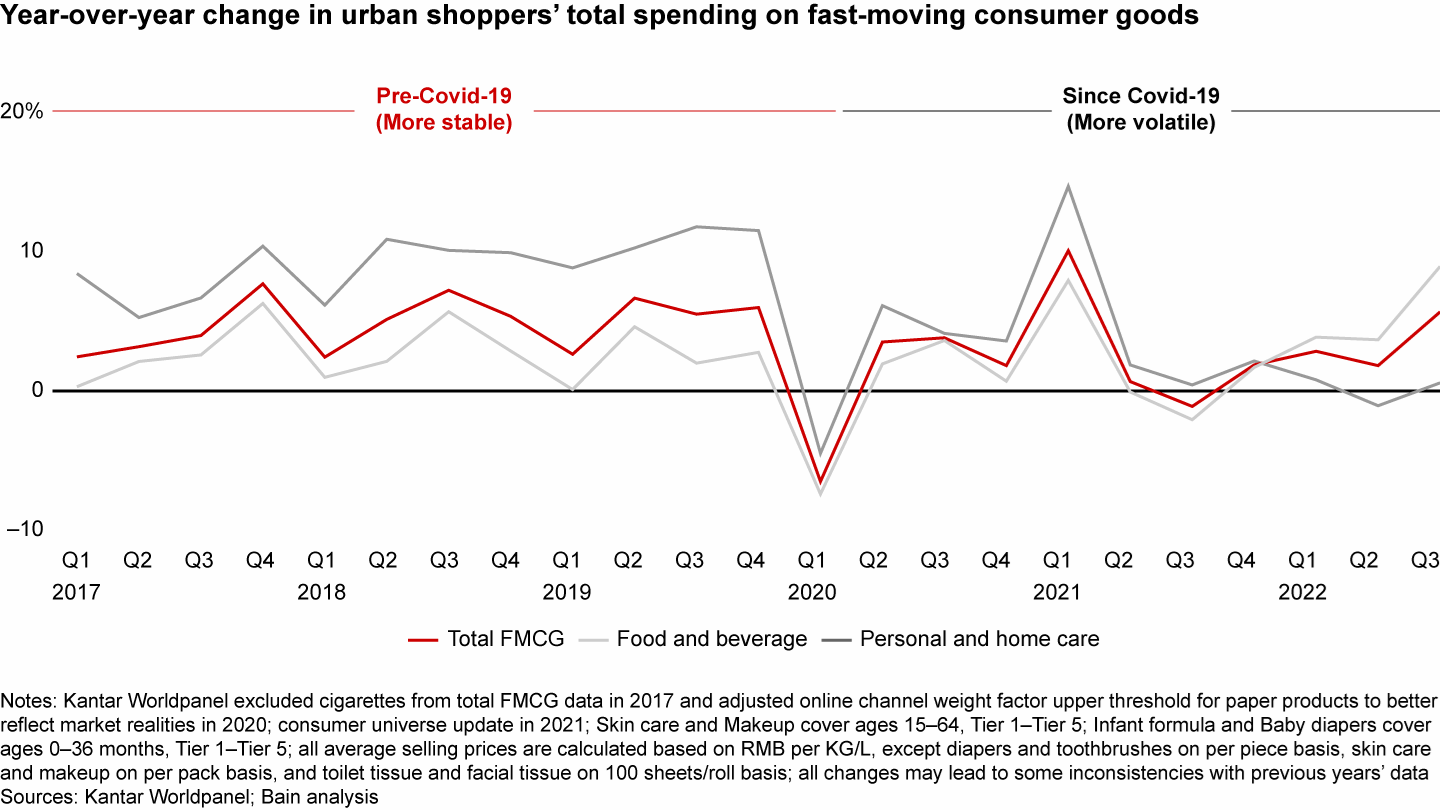
As geopolitical uncertainty and rising input costs shook business confidence, brands treaded lightly with cautious investments. Still, despite the headwinds of supply chain chaos and mounting macroeconomic pressures, China’s FMCG industry was remarkably resilient, exhibiting 3.6% year-over-year growth (see Figure 1). This growth was largely owed to volume, which rose 5.9% compared to the same period last year (see Figure 2). Pandemic-fueled stockpiling behaviors are a likely cause, with volume rising across all sectors except personal care.
While the economic slowdown eroded consumers’ income and buying power, recovery accelerated once Shanghai’s lockdown restrictions were lifted in June. In particular, the third quarter saw robust gains—to the tune of 6% growth. Packaged food largely contributed to the strong momentum in third-quarter growth. Even after Shanghai’s citywide lockdown was lifted in June, consumers remained vigilant in their preparedness, including stocking up on essential foods long after necessary.
One factor that was not a contributor to overall FMCG growth was ASP, which we first observed declining in 2020 after five years of premiumization. In fact, it continued to precipitously drop—2.1% vs. same period last year—which is even more remarkable considering 2% inflation during the first three quarters. Still, while all city tiers experienced price drops, Tier 1 megacities like Shanghai showed more resilience with premiumization across most sectors except personal care (see Figure 3).
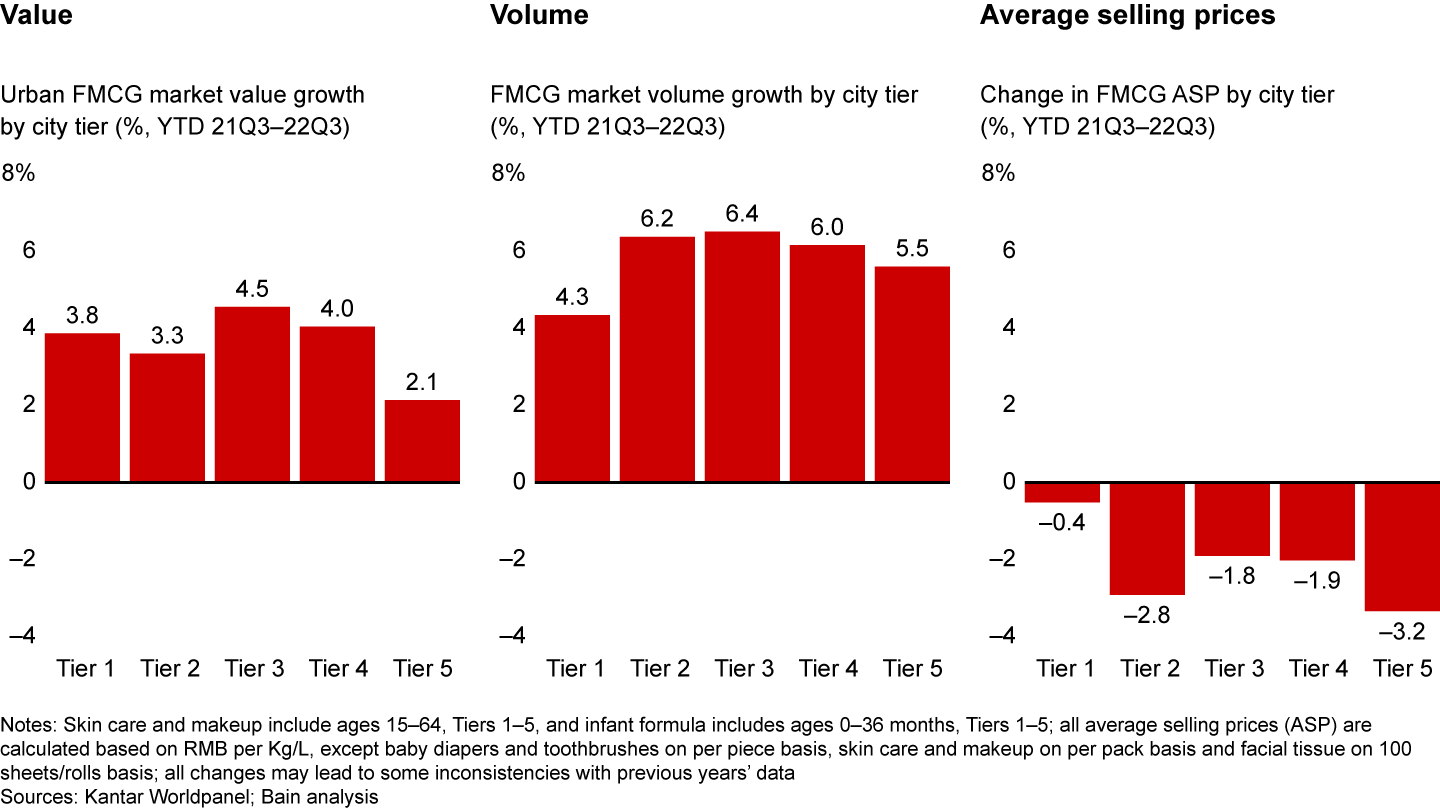
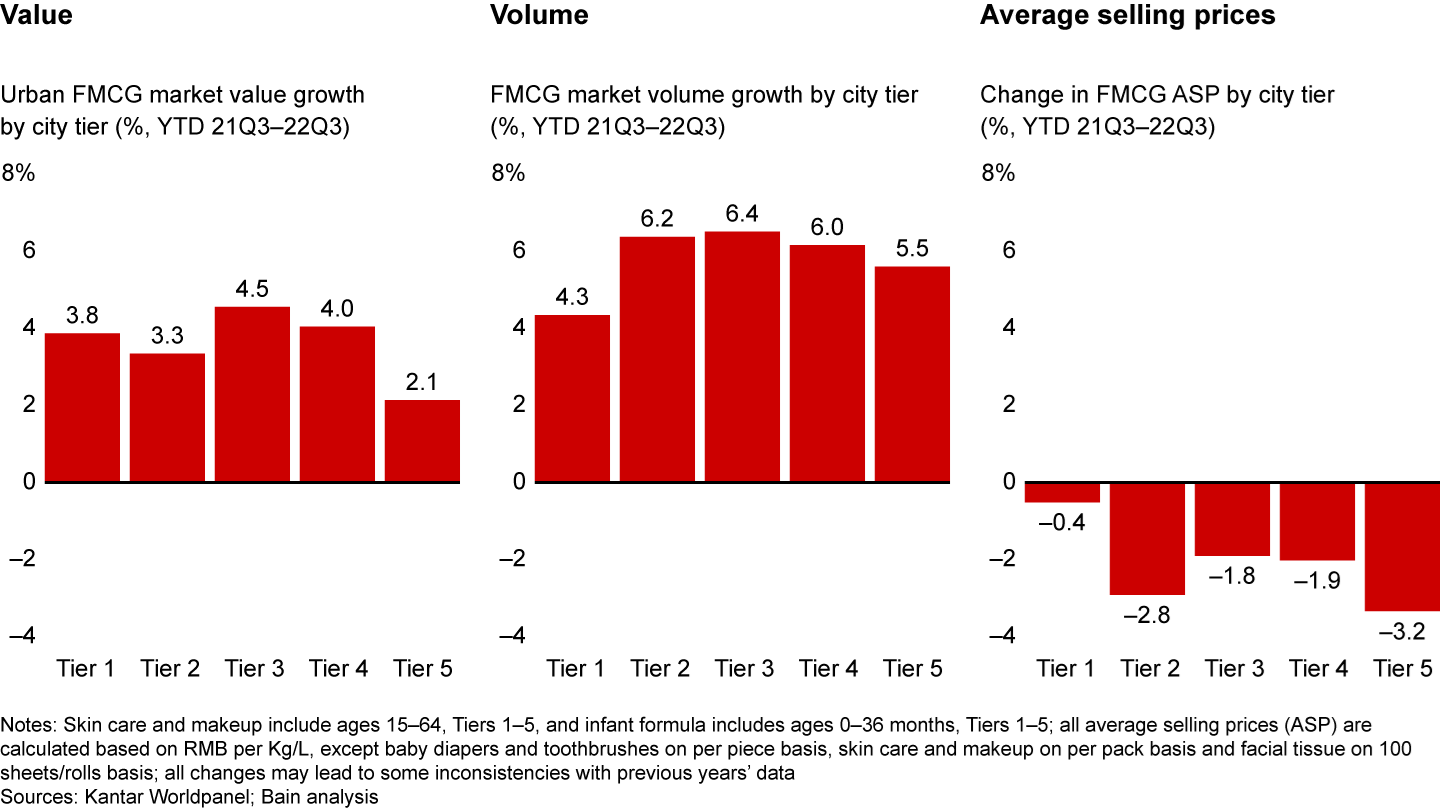
A tumultuous start to the year brought ebbs and flows in consumer behavior—but overall, China’s FMCG market demonstrated true buoyancy in rough waters, signaling there’s hope for the months and years ahead.
Packaged food leads with continued premiumization
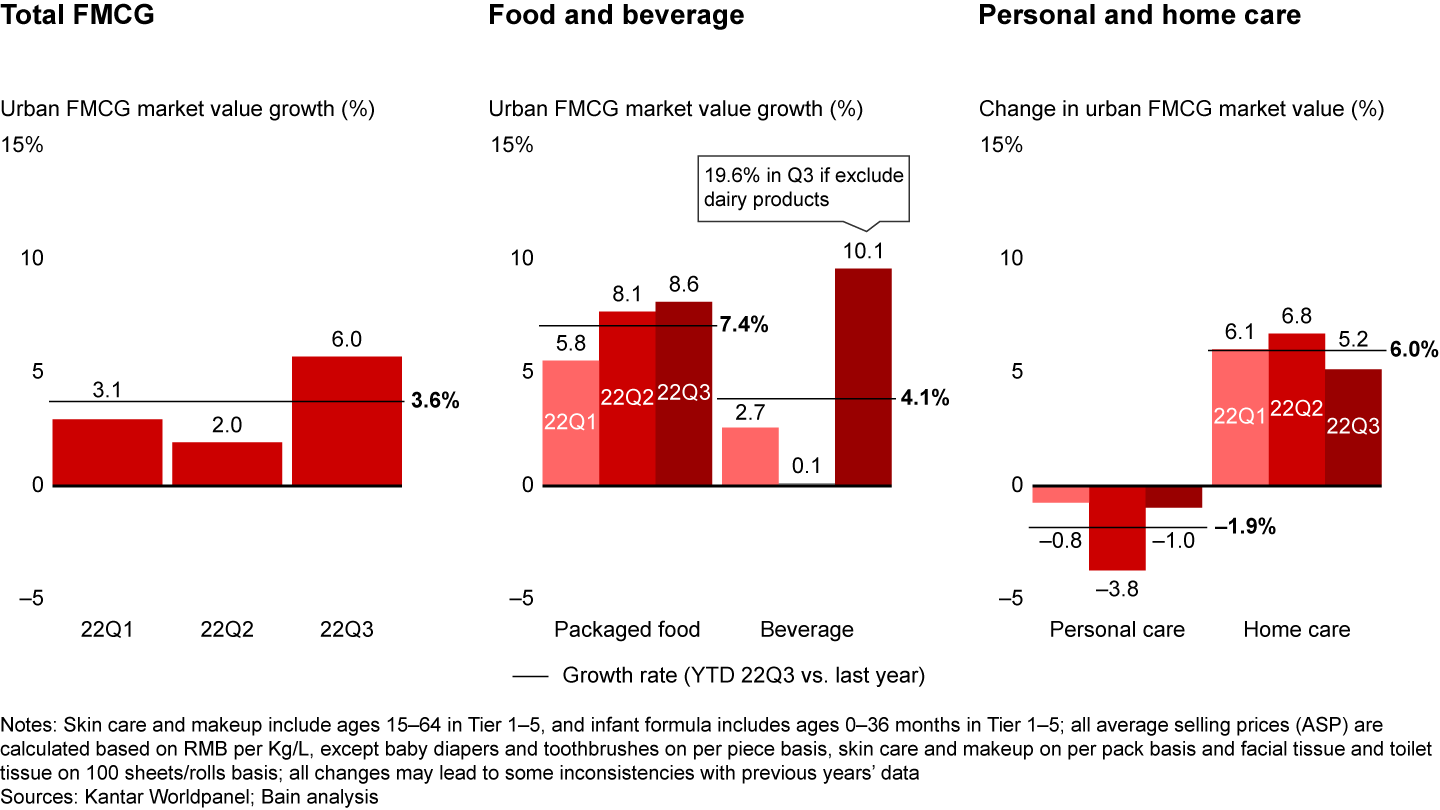
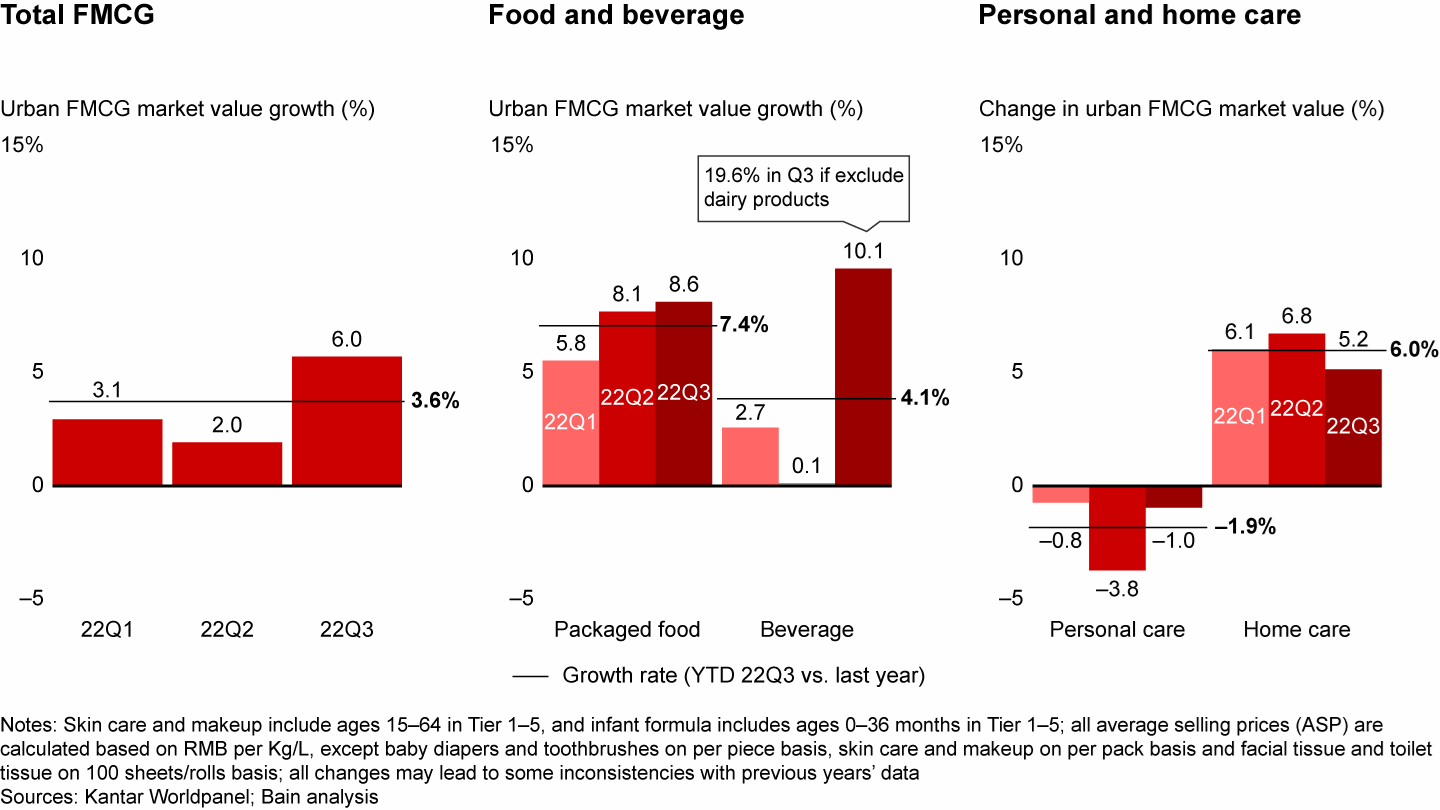
Across the four sectors, packaged food was a big winner, leading growth during the first three quarters as a result of increased stockpiling and heightened health consciousness (see Figure 4). Remarkably, over half of the total year-over-year FMCG growth in the first three quarters was attributable to packaged food. Value grew 7.4% due to gains in volume (4.6%) and ASP (2.6%) (see Figure 5). As with the 2020 Covid outbreak, key growth drivers were pandemic stockpile items like frozen foods, cheese, and instant noodles, the latter of which enjoyed an extraordinary 18% value increase.
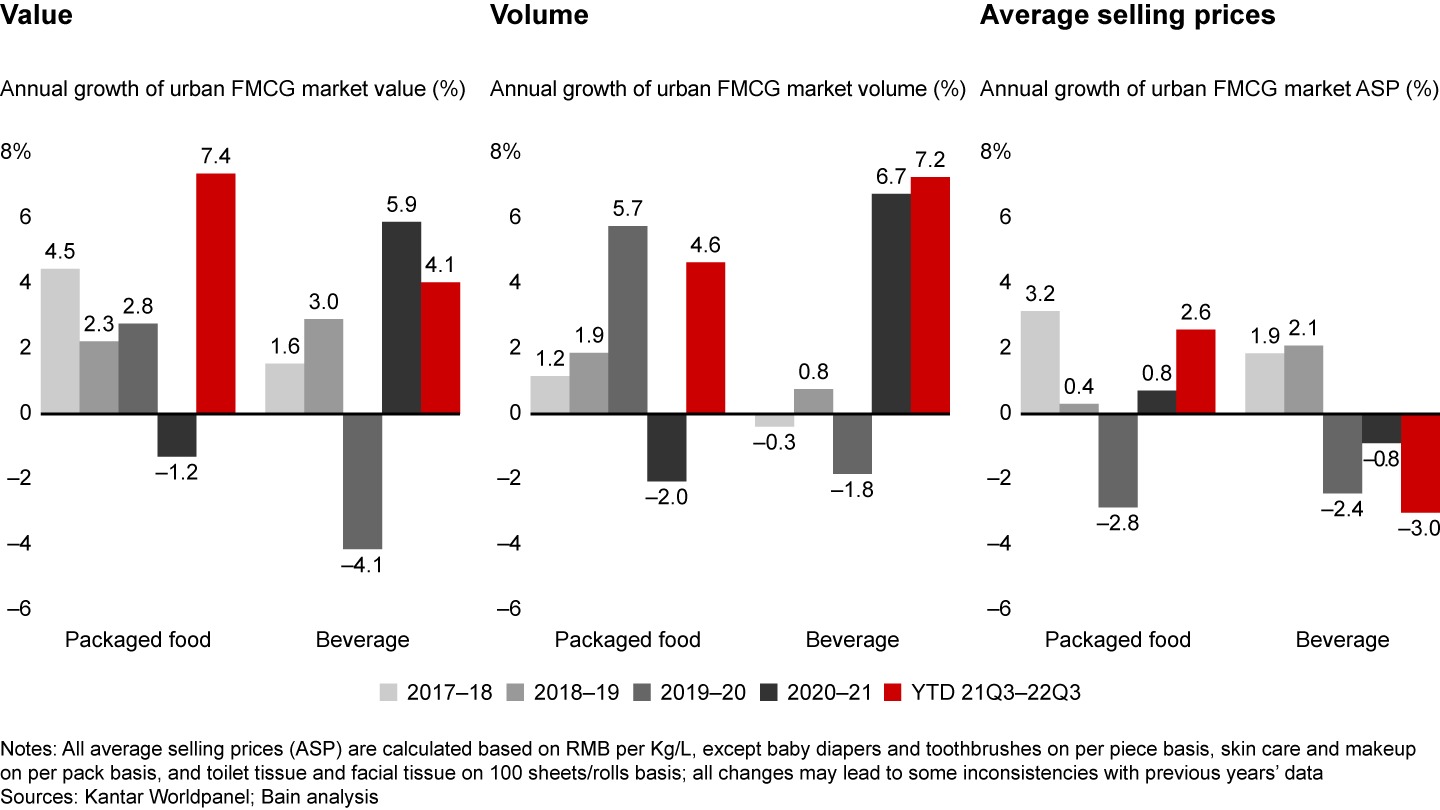
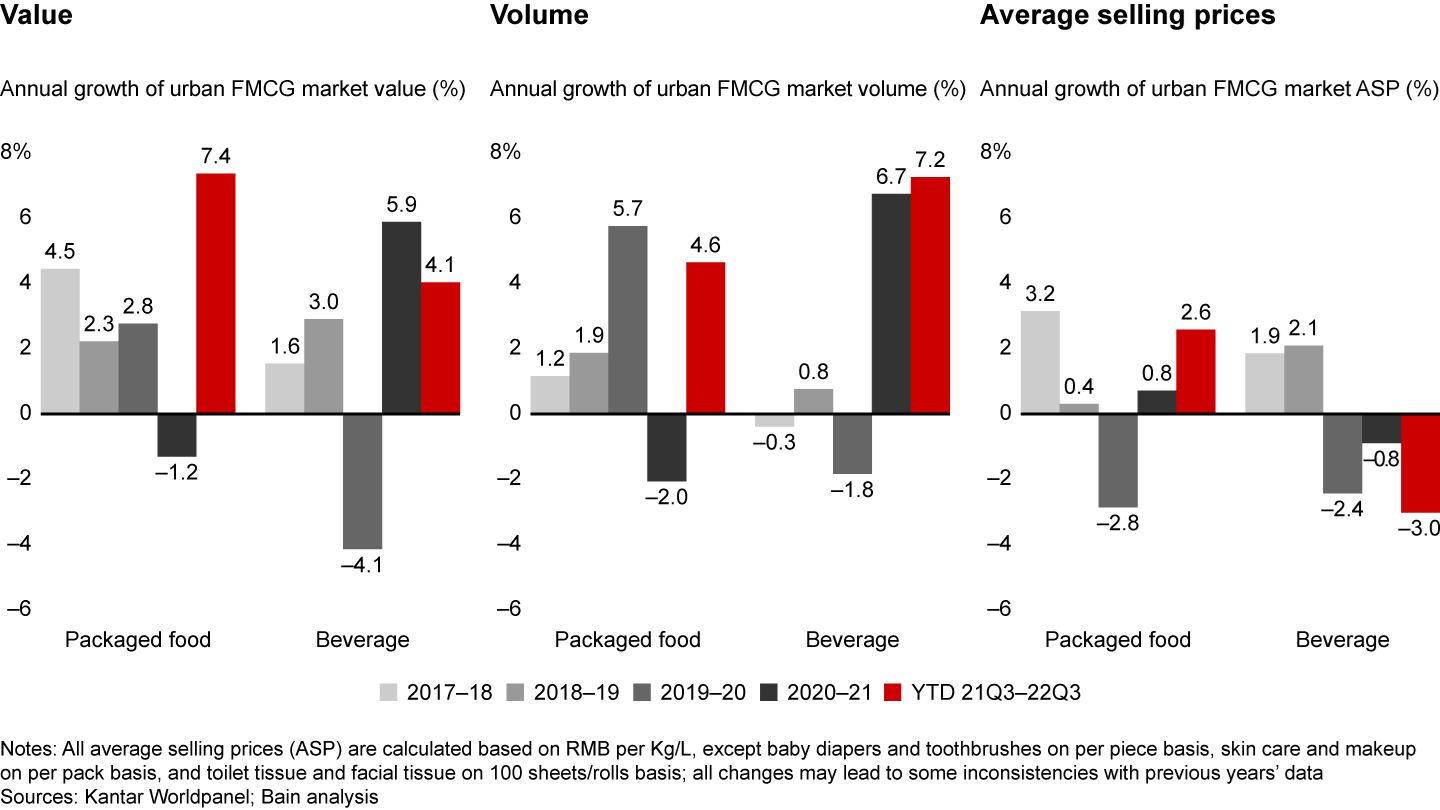
Packaged food ASP rose 2.6% as some manufacturers, like soy sauce brands, increased prices due to inflationary pressure. Premiumization also was a factor. As consumers became more sophisticated about ingredients and calorie intake, and as brands innovated their offerings, shoppers voted with their dollars.
Beverage sees strong third-quarter gains
While overall beverage ASP declined by 3%, primarily in the first two quarters, a volume increase of 7.2% contributed to a strong recovery and overall value gain of 4.1%. After a stable first half of 2022, beverage rose an astonishing 10.1% in the third quarter. As expected, pent-up demand coming out of lockdown was a factor. Less expected was the record-setting heat wave that shot up demand for juice, carbonated soft drinks, and beer, raising value 22%, 15%, and 14%, respectively.
In the case of sector frontrunner juice, new flavors and rising consumer sophistication played a vital role. Fast product innovation also helped other categories continue their robust upward trend. Carbonated soft drinks’ growth was led both by insurgent domestic players like Genki Forest and traditional brands that identified new opportunities for advancement. Category stalwarts like Dayao, Guangshi, and Beibingyang turned declining sales around by expanding and growing their footprint (in geography and channels), while tailoring their products/pack to consumers’ needs. To augment their approach, they rebranded with fresh marketing campaigns celebrating national pride. All told, excluding dairy products, beverage recorded a 19.6% year-over-year volume growth in the third quarter.
While juice, carbonated soft drinks, and beer saw various levels of premiumization, two beverage categories—foreign spirits and packaged water—contributed to the overall fall in ASP. As social gatherings tapered off, and it became uncouth to show off, consumers bought fewer foreign spirits at premium prices. With water, shoppers opted for larger packs for stockpiling purposes, despite its like-for-like price increase.
Personal care takes a dip
Consumers’ avoidance of social gatherings hurt personal care overall. It was the only sector that saw overall declines with a 1.9% drop in value, amounting to a reversal to its historical growth trend in previous years (see Figure 6). Volume only grew 0.7%, though variance across subcategories prevented a more dire outcome. For example, personal hygiene items deemed essential during lockdown sustained volume or even showed minor growth; personal wash increased 4% in value, with toothpaste following at 3%. Those go-to products helped keep the category afloat as expendable items like makeup plummeted 16% in value.
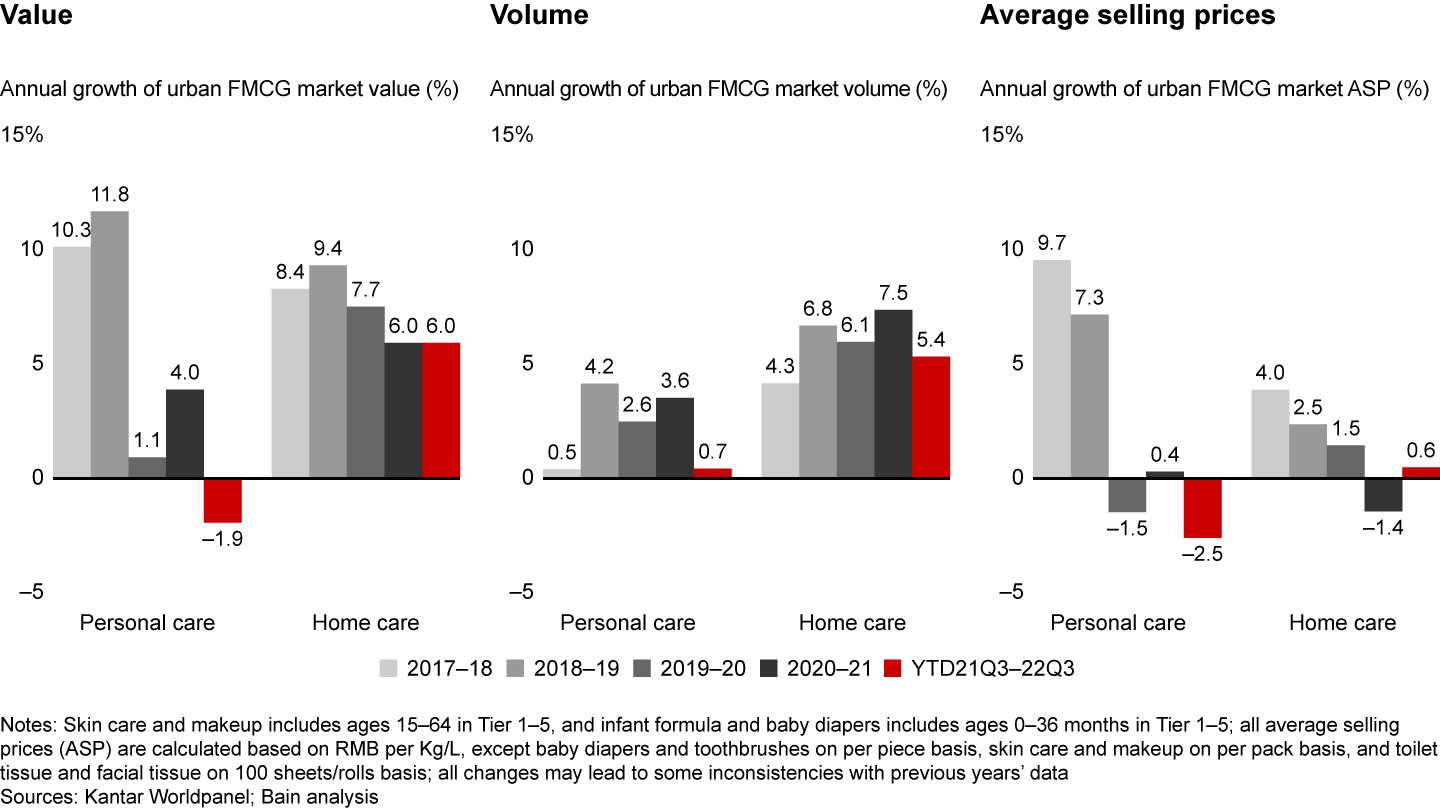
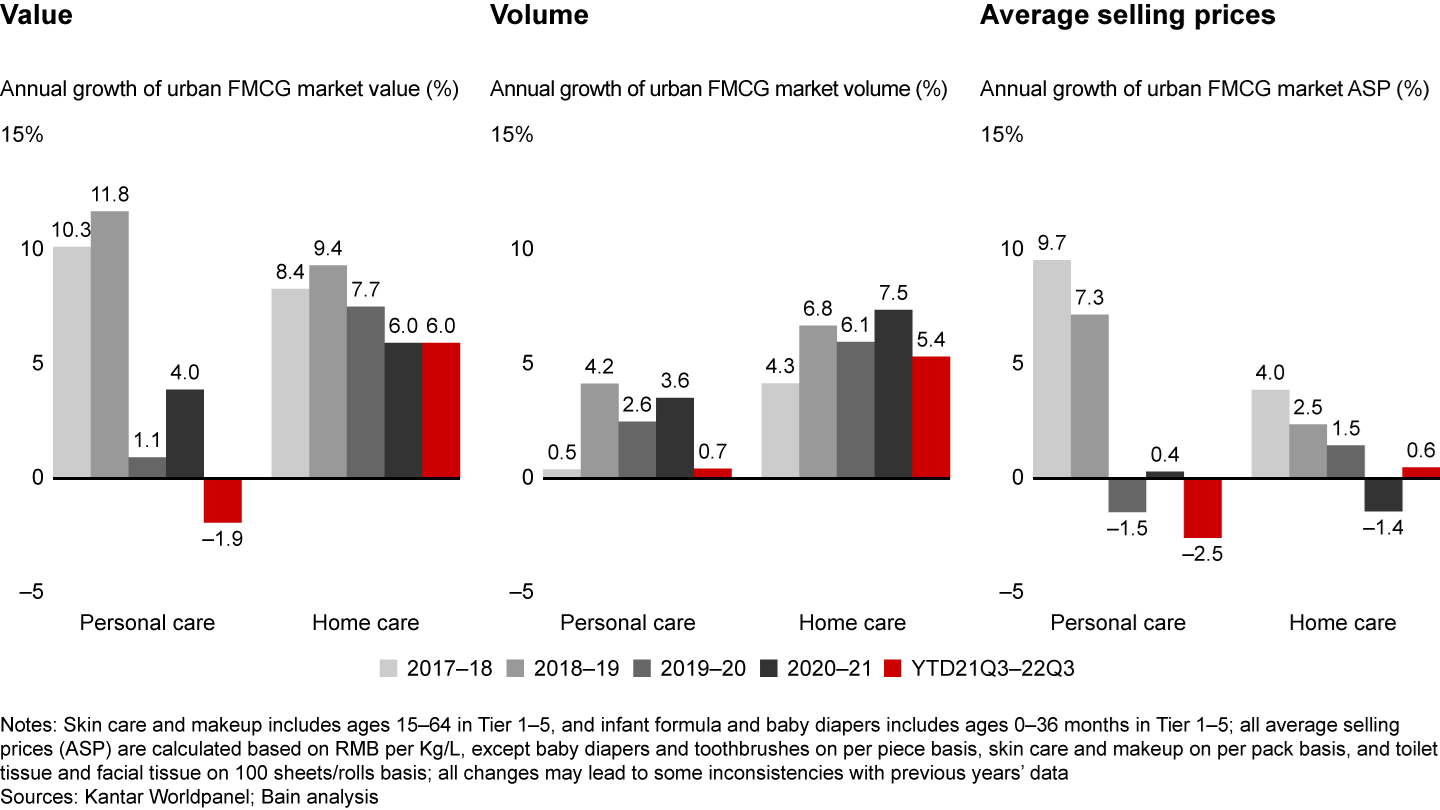
Most significantly, personal care’s ASP fell 2.5%. Shifting needs as a result of lockdown, coupled with fierce market competition, pushed many brands to offer larger discounts and promotions like free gifts and samples. At the same time, consumers became more discerning about price in selecting personal care brands—and were also more willing to choose domestic substitution. ASP for makeup, for example, fell 6% in the third quarter both as a result of increased promotion and the flight-to-value trend, which also impacted shampoo, toothbrushes, and skin care.
Home care benefits from lockdowns
Not surprisingly, as consumers stayed at home for longer periods during Omicron’s peak, home care saw a 6% boost in value. More time at home meant more rapid use of products along with increased stocking up in preparation for uncertainty. Categories like facial tissue, for example, saw Covid-spurred gains; it increased 11% in value, as a result of a 12% volume growth and 1% ASP drop. In parallel with preparedness, consumers also became more educated about caring for their house and family, prompting them to try categories they had not previously purchased. Aligned with this trend, fabric softener saw a 2-percentage-point increase in penetration in the past two years, resulting in 22% growth in value.
A 0.6% rise in home care ASP was twofold. On the one hand, some manufacturers passed raw materials price increases to end consumers, as with toilet tissue, which saw 5% year-over-year ASP growth. Perhaps more significantly, manufacturer-led innovation redefined the category and drove up prices. In tandem, consumers’ heightened sophistication around home care purchases and desire for the latest innovation spurred premiumization. Take fabric detergent, which emerged as a strong contender with a 3% ASP increase this year. Its format evolved over time, from powder to liquid and then eventually concentrate and capsule. With each iteration, the price went up. Specialty products with higher price points like lingerie detergent also significantly outpaced the overall detergent category as consumers proved they were willing to pay a premium.
Covid shapes two-speed growth patterns
The two-speed growth trajectories, which we first identified in 2016, surfaced distinct patterns in the first three quarters of 2022. As in the first wave of Covid in 2020, the high-speed cluster was largely dominated by food and beverage. Low-speed, in contrast, was made up items deemed nonessential—particularly during Covid (see Figure 7).
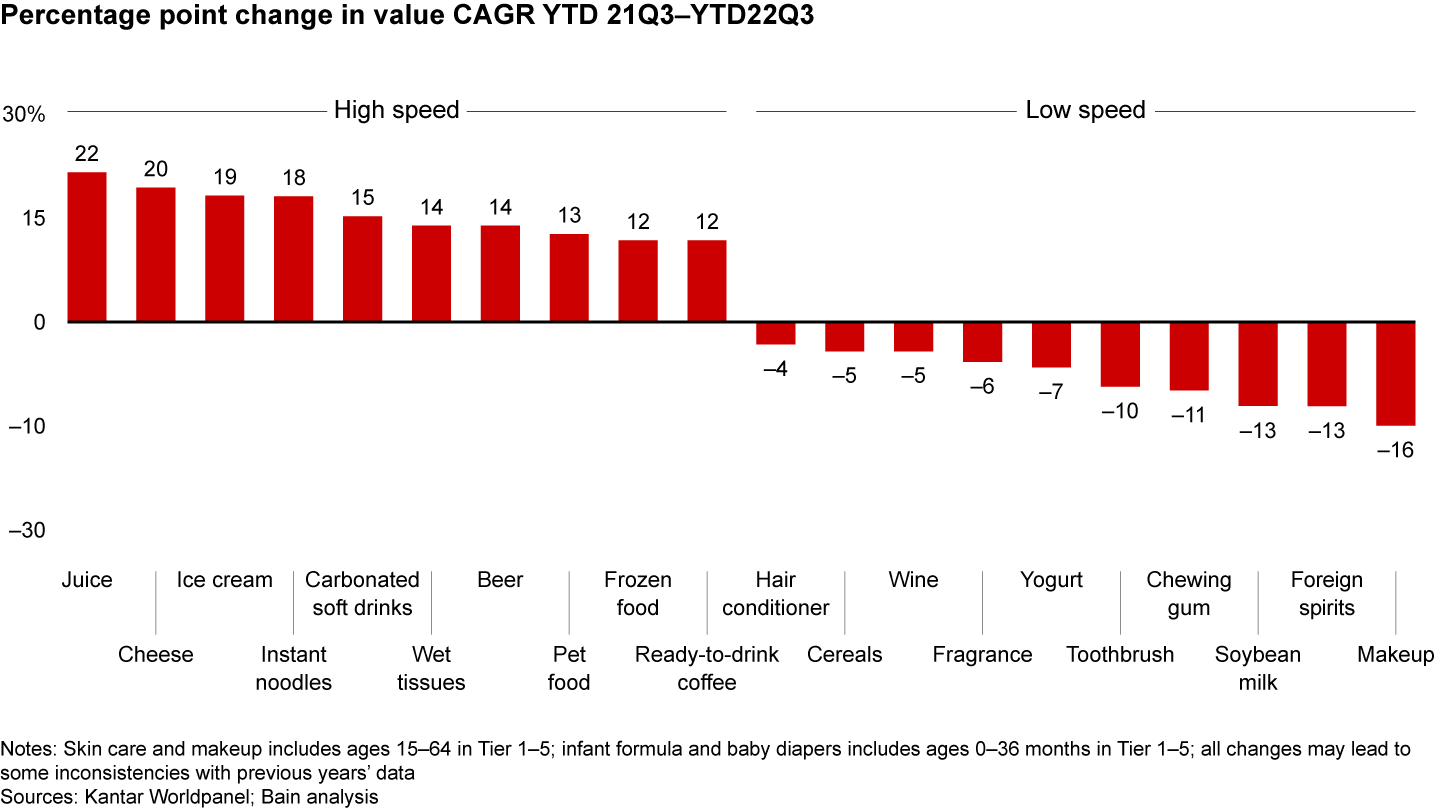
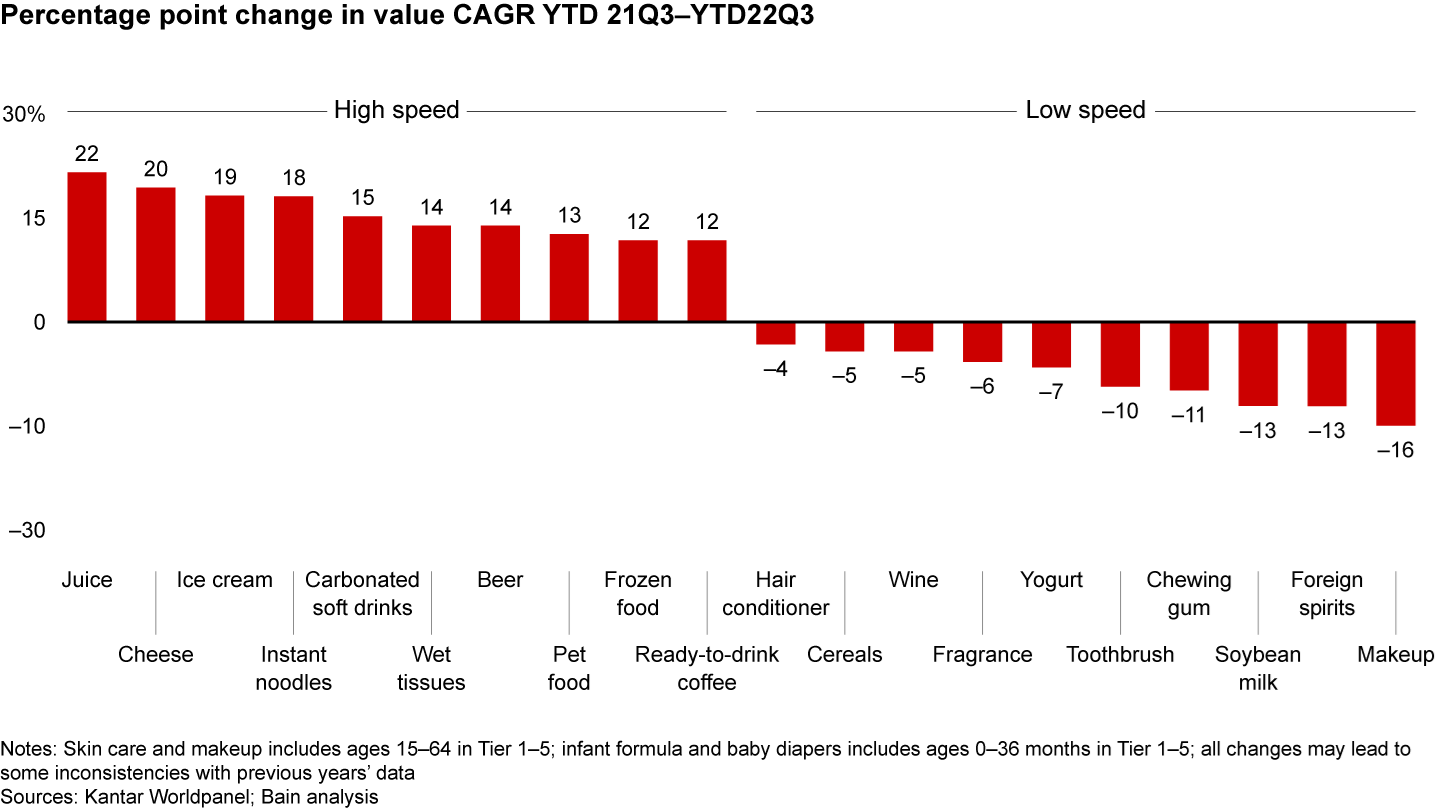
The high-speed growth cohort grew out of both temporary and structural drivers. As lockdowns were announced, consumers stocked up on frozen food and instant noodles. Similarly, the unusually hot summer drove up demand for ice cream, carbonated soft drinks, and beer. This phenomenon was compounded by a “small treats” mentality that drew consumers to low-cost, high-reward items that boosted their happiness during a difficult time, as demonstrated in the growth of ice cream.
Structural factors were also at play. Product and marketing innovation led to a breakout star in juice, which was new to the high-speed cluster. Packaged juice used to be considered artificial, sweet, and unhealthy, but the growing popularity of the “super fruit” segment (i.e., niche, relatively rare fruits with functional benefits such as mulberries, prunes, and blueberries) captured the attention of health-conscious consumers in the wake of Covid. Insurgent brands such as iF (a Thai coconut juice brand) and Bosun (宝桑园) as well as traditional players like Nongfu Spring and Huiyuan enjoyed growth in this segment.
Product upgrade also shaped instant noodles, which was new to the fast-growing group this year, reversing a previous declining trend. One success story came out of traditional brand Baixiang, which accelerated sales with a series of strategic transformations. The brand continually upgraded its products and optimized portfolio/channel and price strategy to accelerate revenue growth, with a consistent pursuit of quality that was well publicized this year. Combined, these moves helped Baixiang earn more consumers and drive revenue growth.
New opportunities for consumption gave a lift to other categories. The rapid adoption of work-from-home models spurred demand for ready-to-drink coffee, which expanded penetration and continued the high-growth trend seen in 2021. Another lifestyle trend that boosted the bottom line was the growing humanization of family pets. As pet owners became more conscientious about providing their pets with higher-quality ingredients, pet food brands like Orijen answered the call with a high-protein diet while educating consumers on the benefit of a nutritional diet for pets.
As with the high-speed cluster, the low-speed products were impacted by both temporary and structural factors. With consumers relegated to their homes during lockdown, and fewer social occasions as a result, categories like makeup, hair conditioner, fragrance, foreign spirits, wine, and chewing gum all took a dip in value. Lack of education and awareness about the health benefits of certain products also reduced nonessential purchases. For example, yogurt continued its multi-year decline, dropping 7% in volume this year. Milk, which is more well socialized as a healthy food, grew 9%. Other low-speed categories, like toothbrushes and cereal, suffered from a lack of breakthrough category innovation and thus led to dwindling willingness to pay.
Growth trajectories take a page from 2020
In 2020, we identified four distinct category growth trajectories that emerged in the wake of Covid:
Continuous booming: categories that benefit from Covid, followed by slower and stable growth
Boom and stabilize: categories that boom during Covid but with a boom that is not sustained
V-shape and stabilize: categories that are hit by Covid but rebound afterward (V-shape)
L-shape: categories that continue to decline during and after lockdown—and take longer to recover
After seeing growth convergence in 2021, we once again witnessed a resurgence of the diverging patterns during March to May this year, as a result of high Covid cases and citywide lockdowns (see Figure 8). However, the level of divergence was less pronounced, and convergence came much sooner than in early 2020.
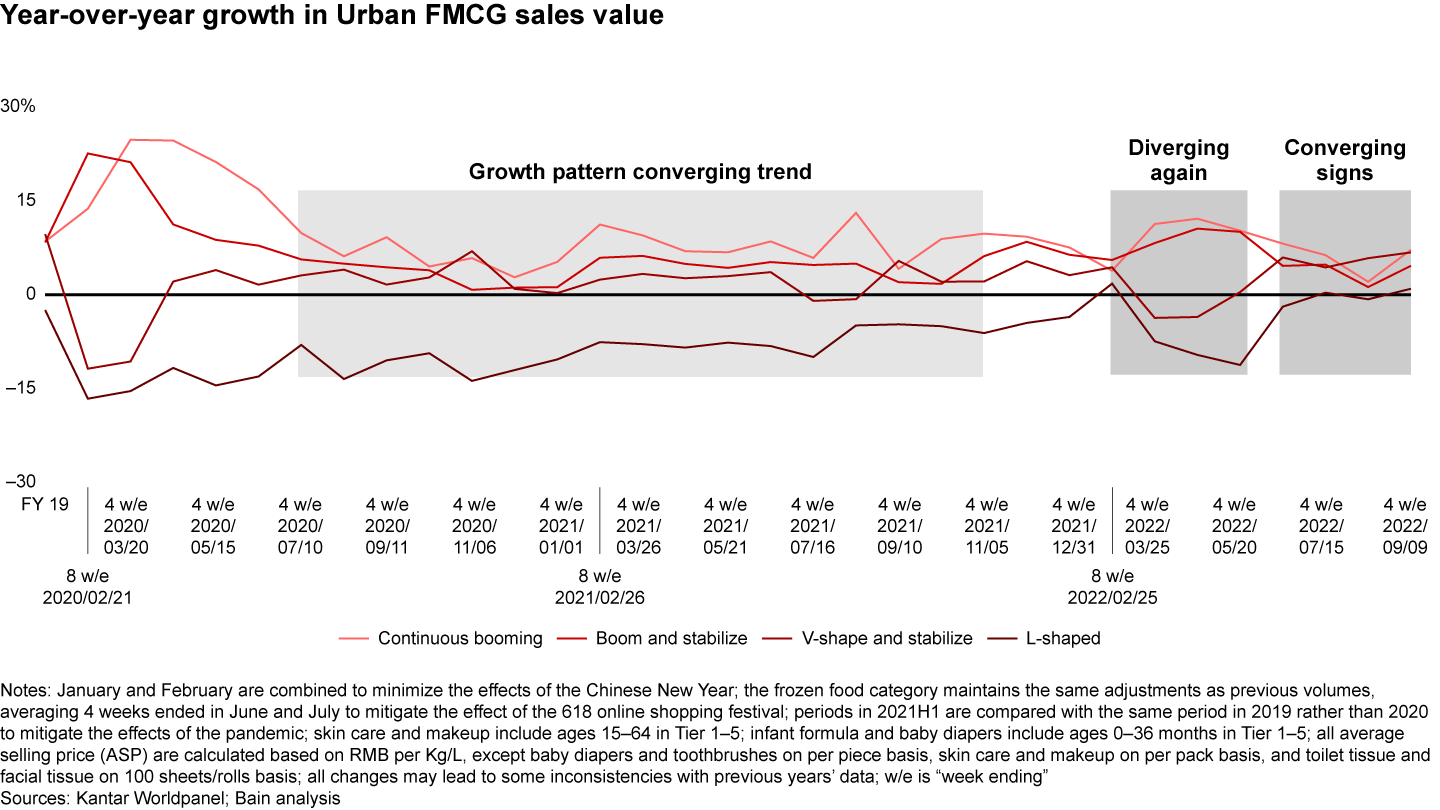
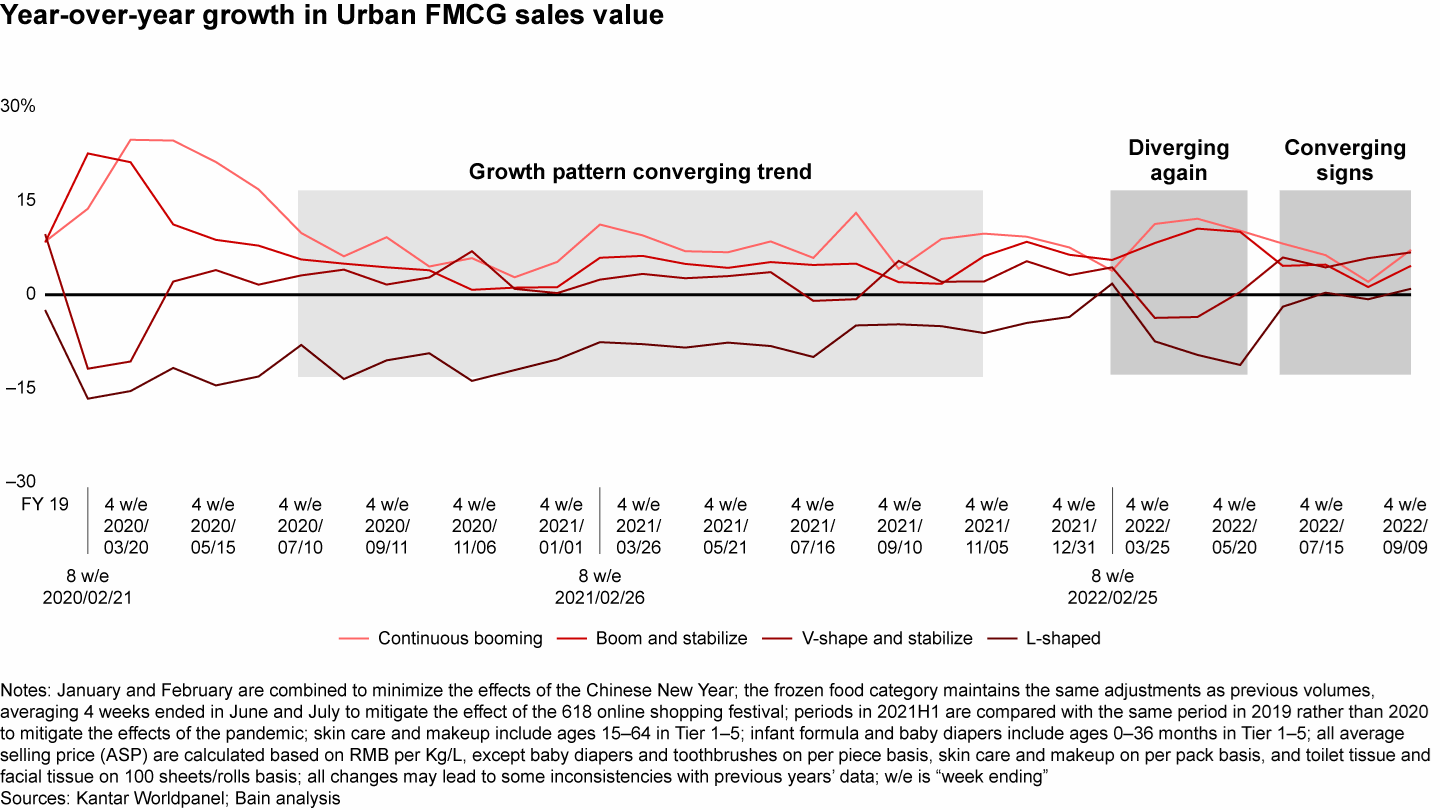
Several factors created a different picture for 2022. For one, lockdowns were less expansive and issued at the city vs. national level. After their experience in the first wave of Covid, brands also became much more adaptable. As consumer demand shifted, or logistics disruptions occurred, they were able to pivot and respond in a more agile way. Some brands even decentralized their warehouses to keep order fulfillment humming along in the event one warehouse was shut down. Others increased warehouse automation to expedite order delivery and manage social distancing.
If brands learned from the trials of 2020, so did consumers. Their tempered anxiety and gradual adjustment to the “new normal” meant a return to regular consumption soon after lockdowns lifted. For example, soy sauce, a frequently stockpiled item and “continuous booming” category, declined once cities reopened. Consumers also resumed their purchase of wine and foreign spirits as social gatherings resumed. Lastly, as mentioned above, seasonality also had a big impact. When the lockdown lift collided with an unusually hot summer, the beverage sector soared.
Following the Covid outbreak, many categories adopted a lower-impact, faster-recovery trajectory. A few V-shaped categories, like shampoo, toothpaste, Chinese spirits, and sake, saw robust recovery after lockdowns ended. Other categories, like milk, fabric detergent, and toilet tissue, were not affected by Covid’s disruption due to a more prepared supply chain and logistics system. Ready-to-drink tea and juice, which showed an L-shaped declining trend in 2020, were unaffected during this outbreak as a result of continuous category innovation and a hot summer that sustained demand and price.
Shifting channel dynamics
The unpredictable nature of China’s pandemic restrictions introduced new channel dynamics. The shift toward online only trod at a similar pace as the overall FMCG market during the first three quarters of the year, while smaller offline store formats and online-to-offline (O2O) commerce rode on Covid’s tailwinds (see Figure 9).
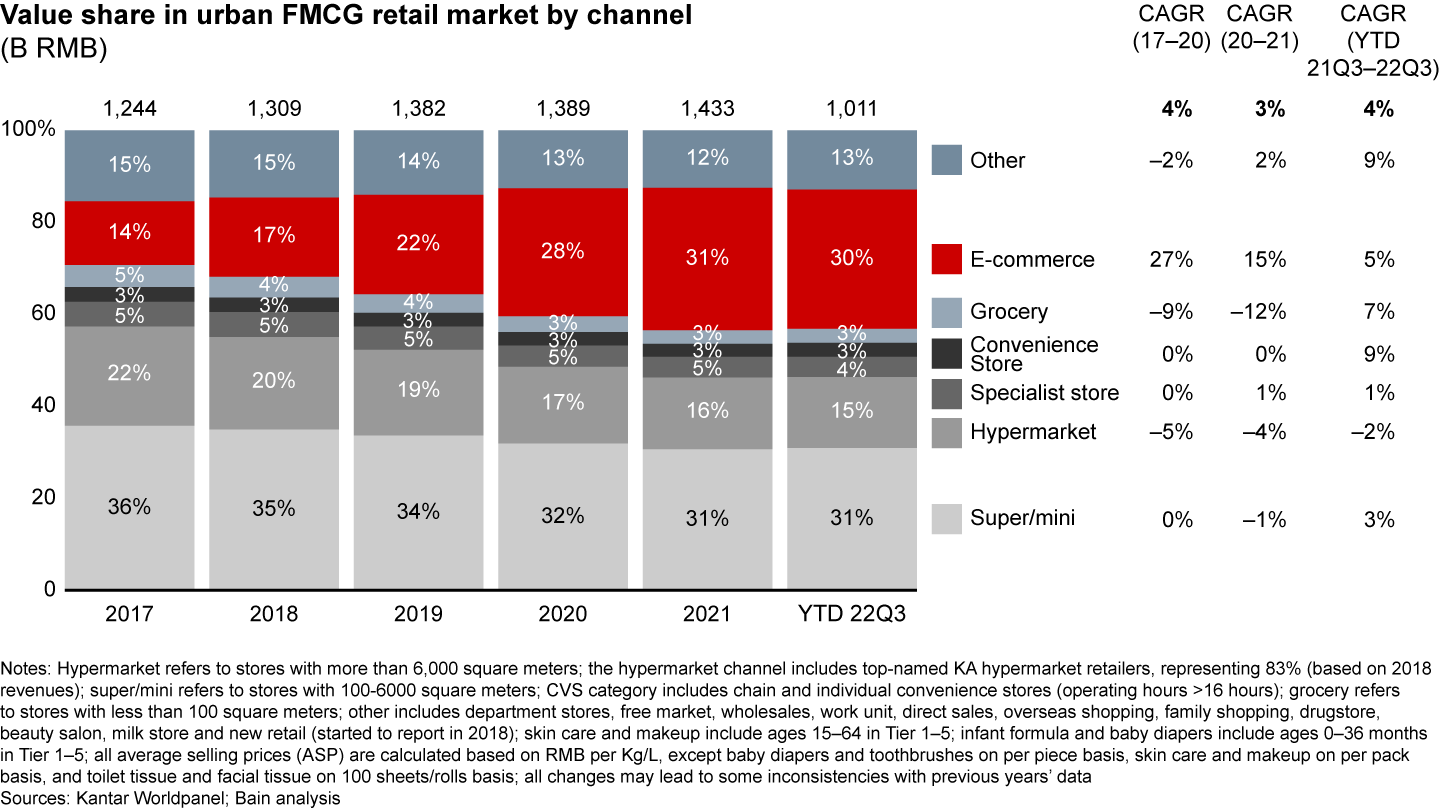
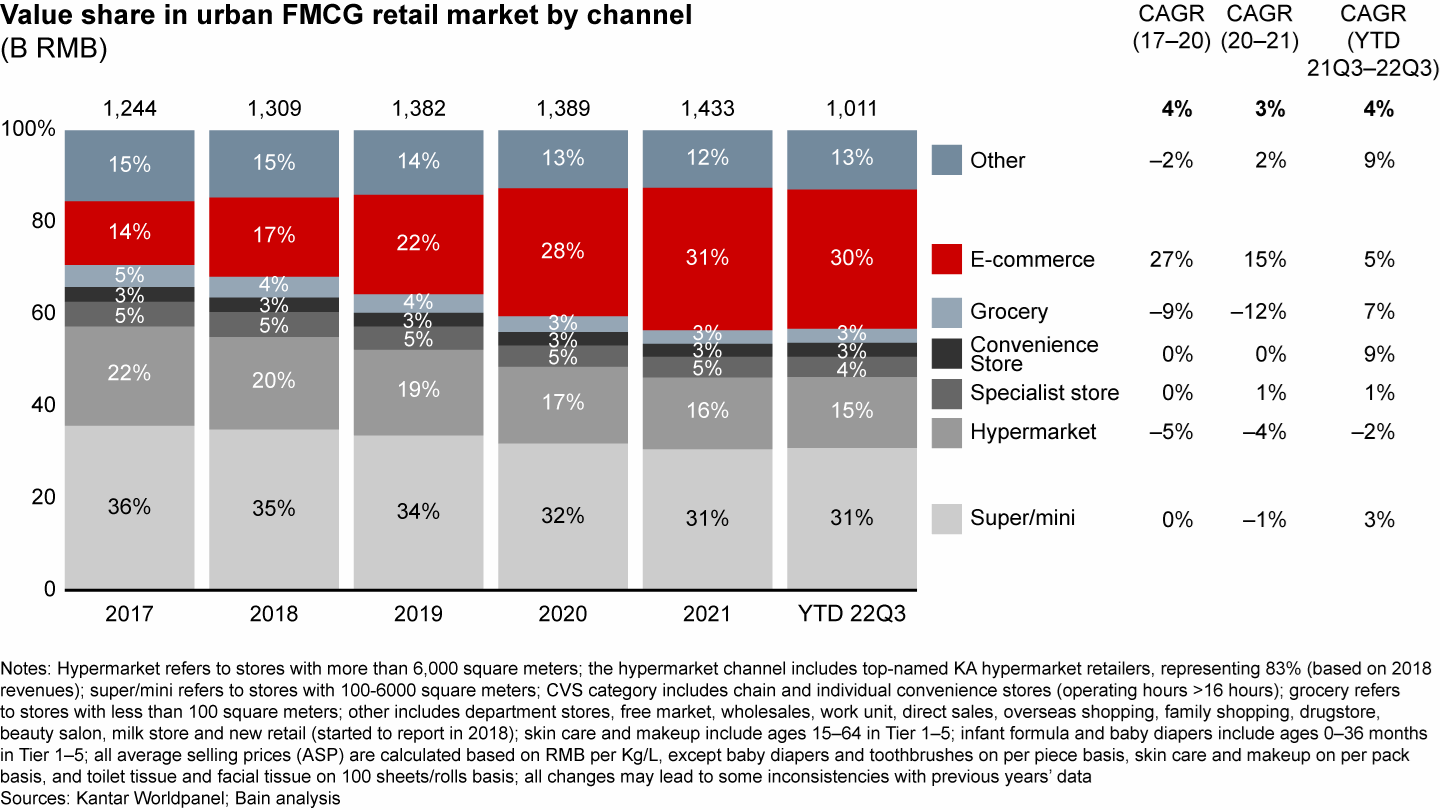
E-commerce claimed a stable 30% share of the overall FMCG spend. Its relatively lackluster performance—5% compound annual growth rate, relative to 15% between 2020 and 2021—had a two-pronged cause: logistics disruptions during lockdown and heightened regulatory scrutiny of key opinion leaders (KOL) and livestreaming industry.
In contrast, convenience stores and grocery stores gained traction, with convenience stores growing 9% relative to nonexistent growth last year. This represents a reversal of trend from our last report and suggests a change in consumer preferences. Pandemic-related disruptions to transportation, along with concerns about virus exposure in large crowds, had consumers gravitating to the predictability, convenience, and safety of shopping at nearby locations.
This year’s Covid resurgence was a boon to O2O’s expansion. In the third quarter, FMCG O2O saw 17% value growth compared to last year. Consumers wanted to stock up and fulfill instant needs while avoiding fulfilment issues from online-only orders, not to mention traffic and exposure in hypermarkets. Frozen food, toilet tissue, and facial tissue are among the categories that saw remarkable growth in O2O penetration.
Online penetration idles
Moderate gains and declines in certain categories’ online penetration resulted in stagnation. Traditionally low-online-penetration categories like food and beverage showed modest growth, while typically high-online-penetration categories like personal care and home care declined slightly (see Figure 10). We observed three patterns:
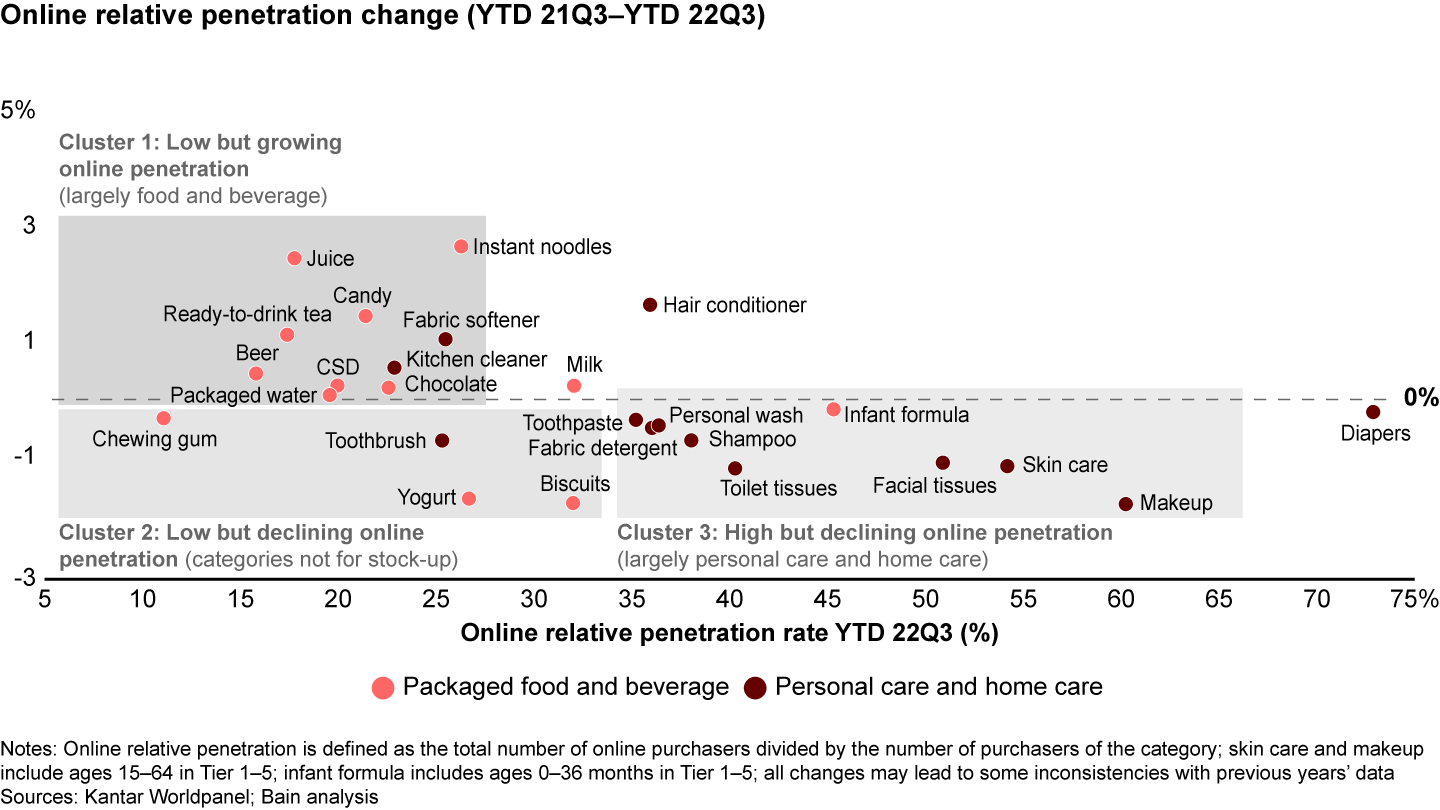
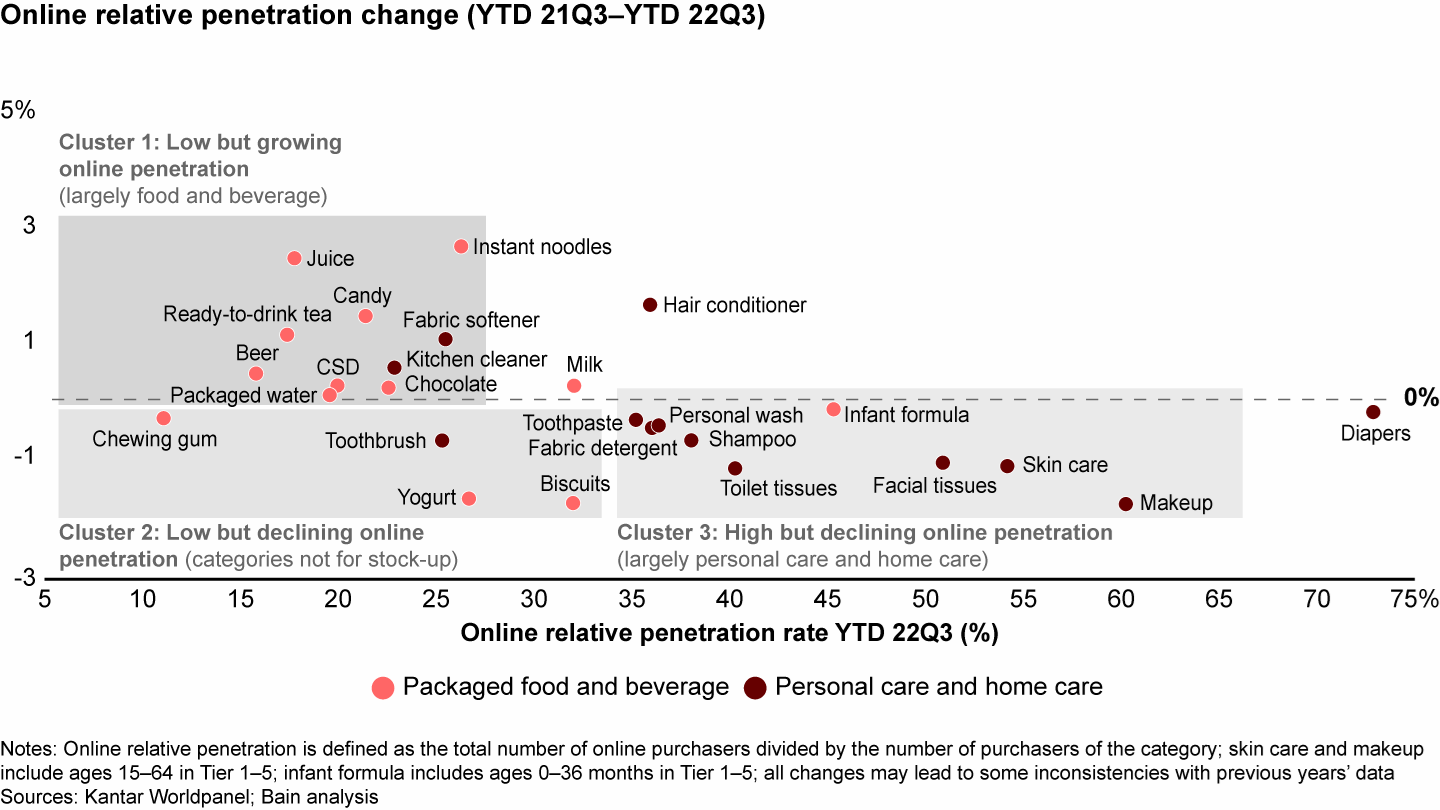
Cluster 1: Low but growing online penetration categories largely from the food and beverage sector, such as juice, instant noodles, and ready-to-drink tea. These typically low-penetration categories gained momentum as consumers stocked up. The lowered logistics cost of heavy-weight products like juice, beer, and packaged water contributed to this move to purchase online.
Cluster 2: Low but declining online penetration, including categories sold offline that consumers don’t stockpile. These are most often impulse purchases from offline stores, like chewing gum, or items deemed nonessential, like yogurt and biscuits.
Cluster 3: High but declining online penetration, generally in personal care and home care, like makeup, skin care, and facial tissues. Boasting already very high penetration, these categories are difficult to grow further. In addition, as these are infrequent purchases, customers chose offline over online given the disrupted logistics of e-commerce.
The fragmentation of e-commerce channels persisted over the first three quarters. Among more mature platforms, Tmall continued to demonstrate its strong leadership in driving innovation and new categories, with targeted marketing and established membership programs. JD.com’s 7% growth outpaced e-commerce overall. It benefited greatly from its self-owned supply chain, as the reliability of inventory and shipping logistics emerged as an important differentiator—and repeat purchase driver—for locked-down consumers. Also key to its Covid-era resilience were its B2C model, relatively lower reliance on influencers, and lower exposure to beauty categories relative to its C2C competitors.
PDD doubled its size between 2020 and 2021, but that accelerated growth came to a jarring halt in the first three quarters of 2022. In contrast with JD.com, PDD’s dependence on third-party logistics providers made it more vulnerable to pandemic-related disruptions.
Interest e-commerce, or livestreamed selling on platforms like Douyin and Kuaishou, maintained its extraordinary momentum. A continued rise in daily active users, paired with an uptick in time spent viewing short videos, contributed to a growth rate of 171%. Platforms made a splash with new campaigns, like Douyin’s 921 Goodies Festival, and rising KOL sellers. This buzzy approach was effective at luring consumers from traditional e-commerce platforms, ultimately promoting its outstanding growth.
O2O: More than a trend, it’s here to stay
As in past reports, we closely tracked four main participants in the O2O space:
Offline retailers such as RT-Mart (大润发优鲜) offer O2O services via self-owned or third-party delivery capabilities. With declining penetration and purchase frequency, offline retailers lost share this year with declining penetration—and accounting for 20% of total O2O value. However, their average basket size saw a 33% year-over-year boost, thanks to the growing popularity of warehouse club O2O destinations.
Vertical grocery e-commerce retailers such as Dingdong Maicai (叮咚买菜) and Missfresh (每日优鲜) rely on self-owned dark stores and their own delivery capabilities. Because this model works best in condensed urban areas, expansion potential might be limited. Whereas other models can convert consumers from existing online platforms, vertical grocery’s success relies heavily on promotions to draw traffic. As expected, vertical grocery continued to lose share this year as it struggled to find a profitable business model. But while their penetration rate rapidly declined, their loyal customers helped keep them afloat, purchasing more frequently and spending more per trip.
Community group buying (CGB) platforms such as Duoduo Maicai (多多买菜) and Meituan Maicai (美团买菜) rely on community captains to coordinate orders and delivery and manage offline pickup points. With their low-price value proposition, these platforms used to be more popular in lower-tier cities. However, lockdown in Shanghai and other high-tier cities significantly boosted their penetration rate in these markets and enabled the model to account for 46% of total O2O value.
Although overall usage cooled in the third quarter as lockdowns lifted, the platforms’ penetration still carried overall O2O growth—boasting a 7-percentage-point increase compared with the same time last year. Duoduo Maicai in particular emerged as a strong contender, thanks to its pandemic-friendly ease of use and reliability. It curated a set of suppliers that could ensure 48-hour delivery within Shanghai at a reasonable cost, leveraging PDD’s strength in fresh produce and a purchasing tool called Kuai Tuan Tuan (快团团), to spur penetration.
Horizontal marketplace platforms such as Meituan (美团) and Ele.me (饿了么) serve retailers and brands with their O2O distribution capabilities. In 2022, these asset-light platforms saw steady growth on par with overall O2O growth, thanks to easy access via platform super-apps, quick and reliable delivery, and a diversified product assortment. Capturing nearly one-third of total O2O value, odds look good that they will continue to win customer loyalty and thus grow and scale.
Growth in the O2O space is largely driven by a higher penetration rate and growing purchase frequency; so even as average basket sizes dropped this year, O2O was strong, increasing trip frequency 14.6% and growing user base by 6.1%. That’s largely due to Covid-accelerated behaviors, like staying home and stockpiling, as well as mindset shifts like a demand for immediacy despite an unwillingness to go to physical stores.
At the same time, large e-commerce players doubled down on O2O as a growth source. For example, JD.com incorporated it into its core strategy, launching a SaaS system for partner hypermarkets to optimize O2O operations. Though we saw variance in performance among the models below, we believe that the O2O trend is more than a trend—but here to stay.
At-home vs. out-of-home
The pandemic’s resurgence gave a welcome lift to at-home food and beverage consumption, following a slight decline in 2021. For select food and beverage categories, at-home consumption landed comfortably at 56% by the end of the third quarter for Tier 1 and 2 cities (see Figure 11). Convenience stores and grocery are dominant channels for out-of-home consumption, as they proved to be more suitable for on-the-go needs. E-commerce continued to gain traction in these select food and beverage categories in Tier 1 and 2 cities—both at home and out of home.
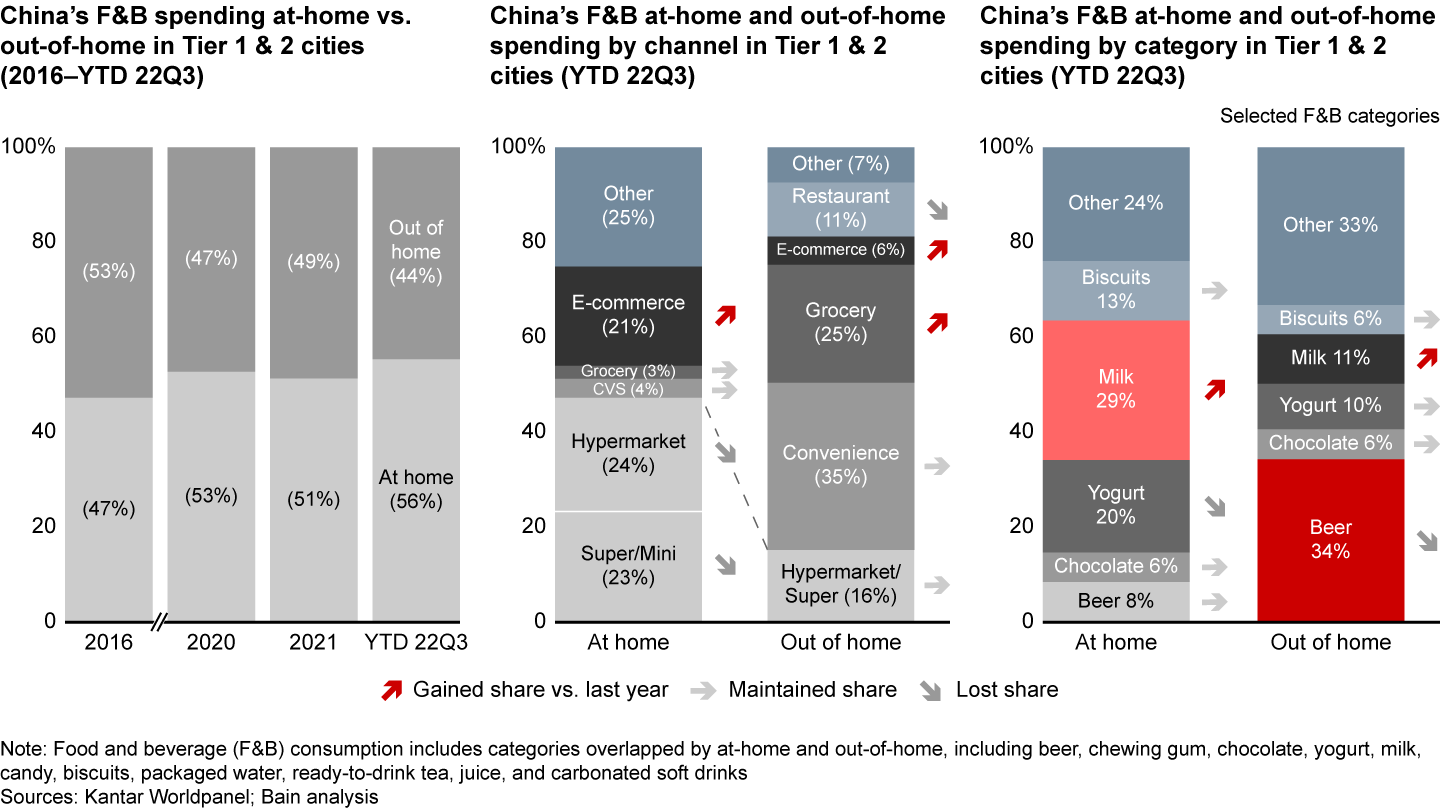
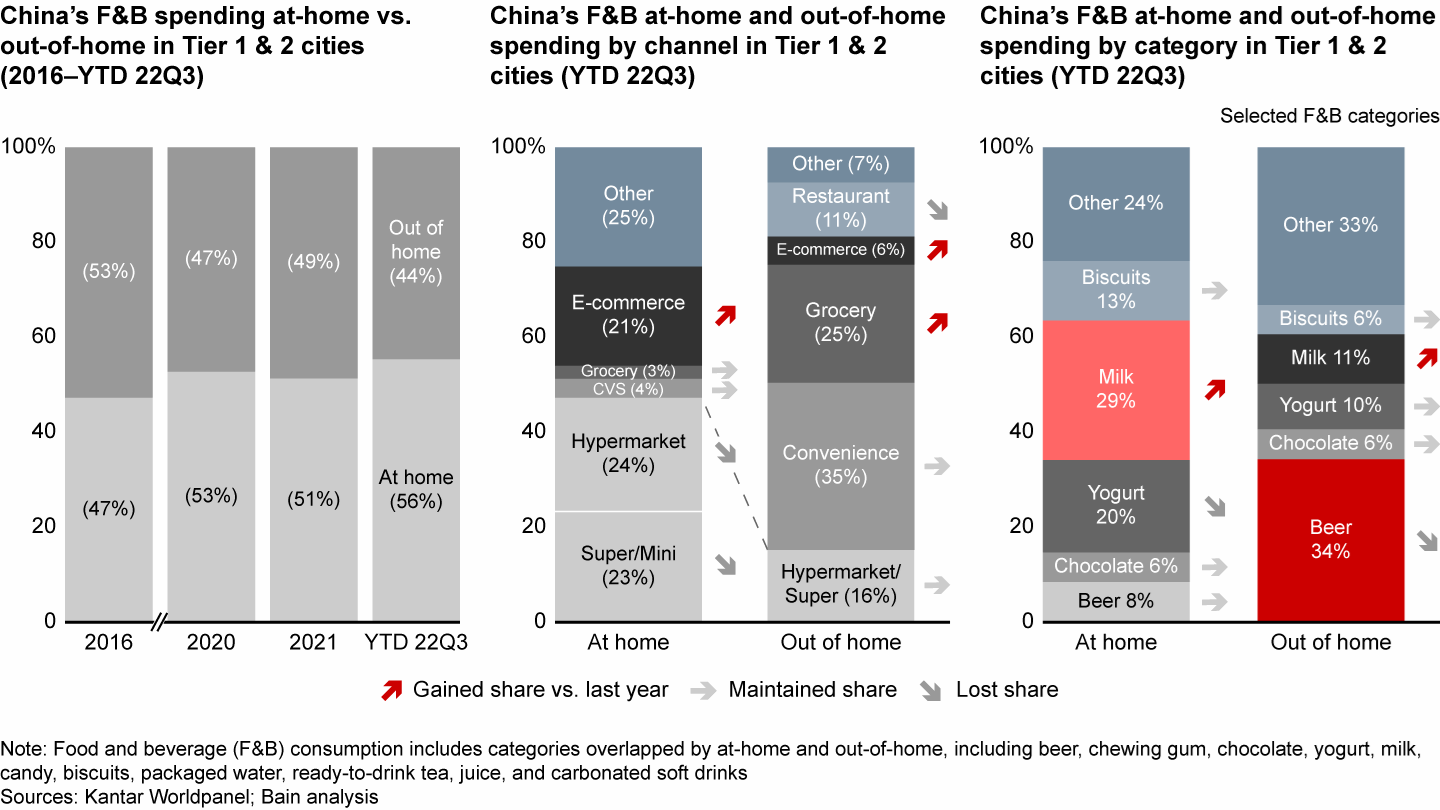
Milk is still growing in value share in at-home and out-of-home consumption for Tier 1 and 2 city consumers, whereas expendable categories like yogurt and chocolate have either maintained or slightly lost share. Beer was heavily hit this year in out-of-home occasion given the Covid restrictions for dine-out, which was also reflected in restaurants’ declining share of out-of-home consumption.
This year we also tracked consumption patterns for these select food and beverage categories at a national level. Across all city tiers, at-home consumption was lower (52%), suggesting more out-of-home consumption in lower-tier cities with fewer Covid restrictions. Lower-tier cities are less reliant on e-commerce overall, due to weaker logistics networks that make the shopping experience less streamlined. Consumers in these cities generally prefer traditional grocery, especially for out-of-home purchases. Compared to Tier 1 and 2 city consumers, lower-tier city shoppers tend to spend proportionally more on essentials like milk vs. “small treats” like chocolate and beer.
Demystifying price trends
Curious about ASP’s 2.1% decline, we conducted further analysis to unpack the drivers behind this complex and nuanced development. Here, we looked to the Consumer Price Index (CPI) to illustrate China’s overall inflation level, but it’s important to note that CPI measures a broader set of industries beyond FMCG, including fresh produce, electronics, etc.
This deflationary trend continued what was already observed in 2020, but the magnitude of the decline was greater than in 2019 to 2020 (1%) and 2020 to 2021 (0.9%). Further, only a few categories showed real ASP growth above inflation level, and these were largely in food and beverage and home care due to the pandemic-related consumer behavior changes discussed above (see Figure 12).
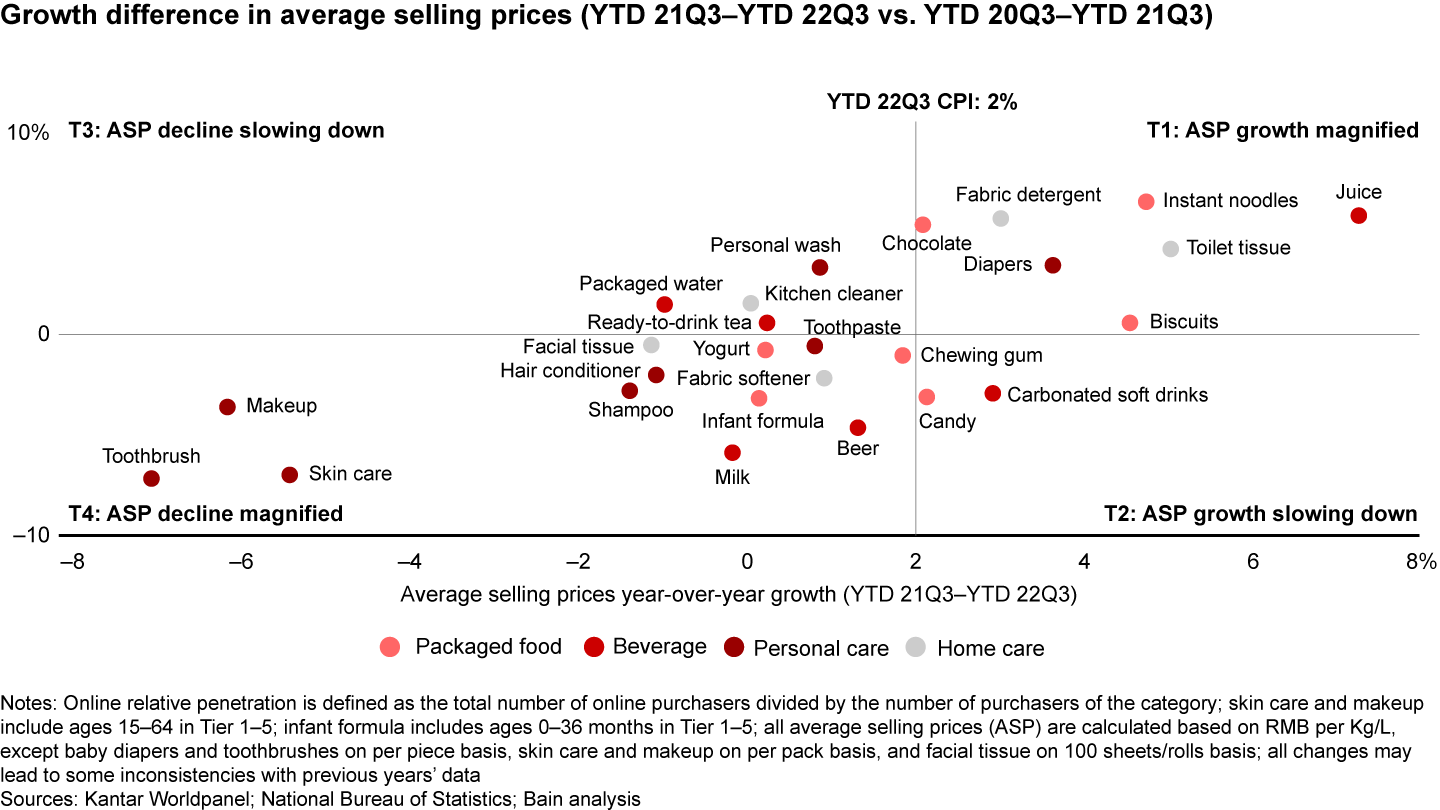
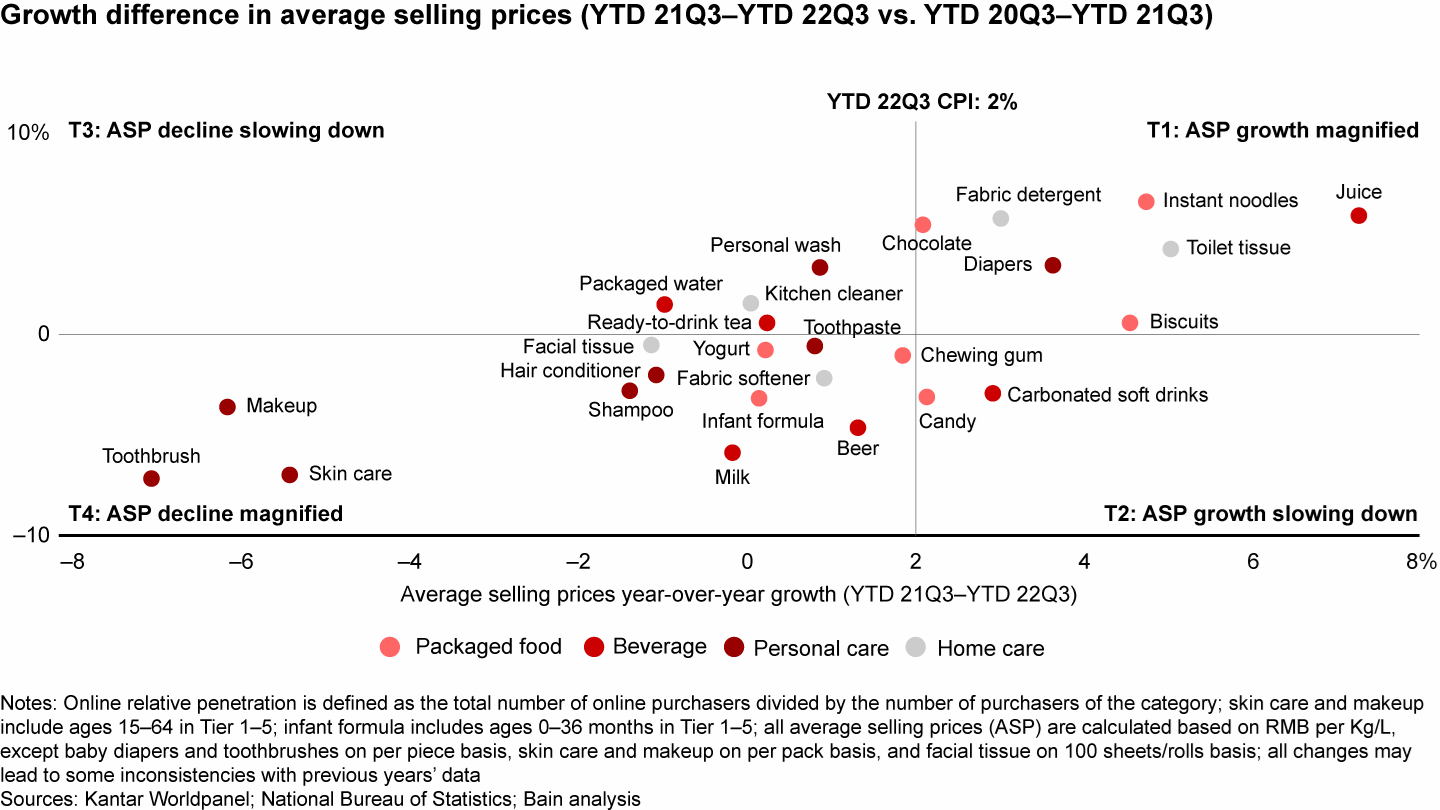
Facing rising input costs, FMCG brands understandably pushed for price increases to manage margins. That said, how consumers reacted to the price increases in food and non-food sectors differed significantly as illustrated below in this third-quarter analysis (see Figure 13).
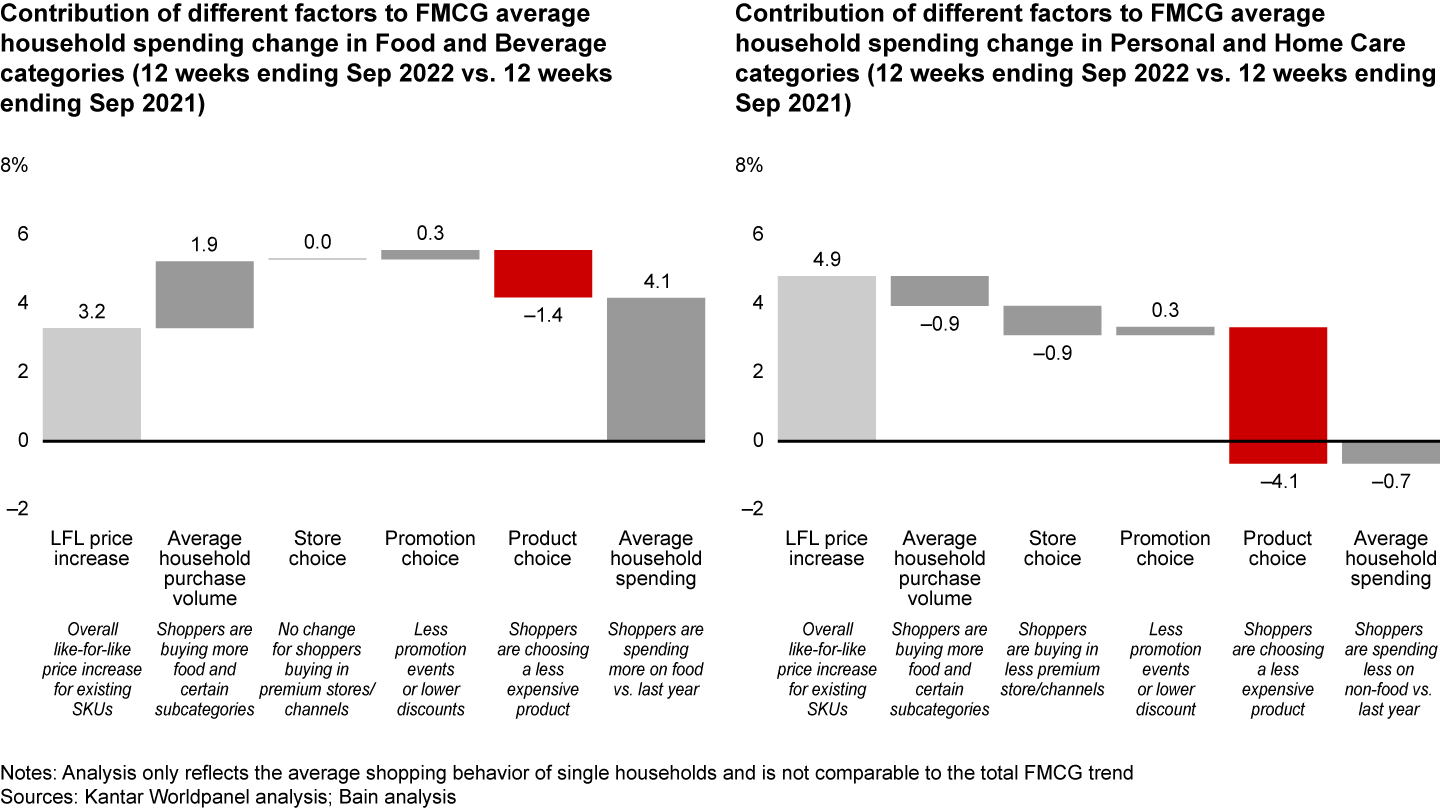
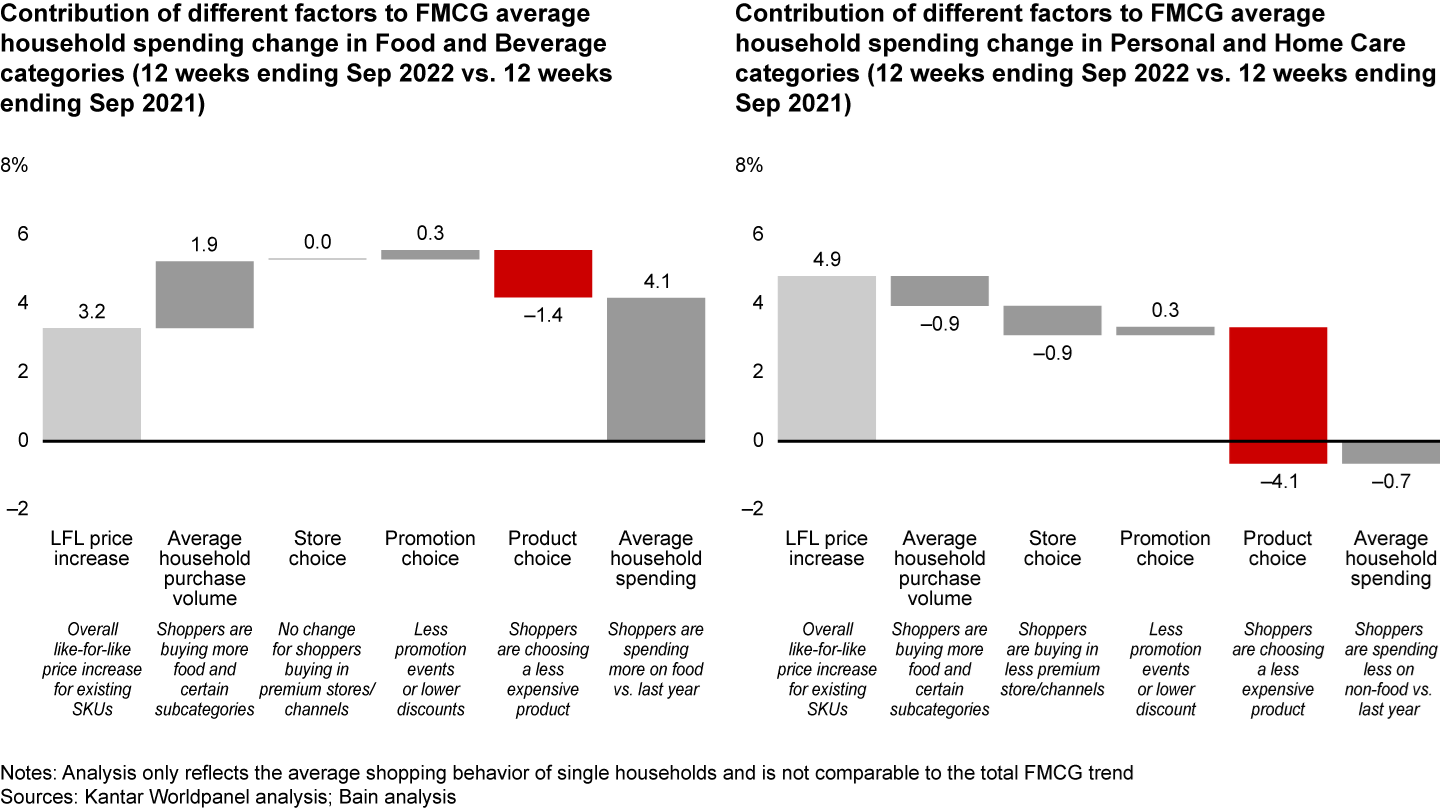
Packaged food and beverage sectors: Hypothetically, a household that spent 1,000 RMB on food and beverage purchases last year would be spending 1,040 RMB this year. With Covid as a mitigating factor, brands’ 3.2% like-for-like increase on the same basket of products had little impact on shoppers’ channel selection and promotion participation. Rather, volume played a big role in total spend. As a result of Covid uncertainty, consumers stocked up on packaged food and beverage and opted for larger pack sizes, which often came at a lower per volume price. As a result, average household spend on food and beverage saw a 4.1% net increase in the third quarter of 2022 compared with the same period in 2021.
Personal care and home care sectors: Relative to food and beverage, consumers reacted more strongly to the price increase in non-food categories. As brands tried to pass inflation costs to consumers—with a like-for-like price increase of 4.9%—consumers responded by reining in spending, leading to a decrease of 0.7% in 2022’s third quarter compared with the same time last year. To cope with the rising product price, they reduced volume, switched to discounted online channels, and most importantly, opted for more value-for-money alternatives (what’s known as trading down).
Store choice: Personal care and home care categories saw a shift in their channel dynamics, as consumers tended to prefer discounted channels like PDD or interest e-commerce. Within personal care, online growth mainly came from Kuaishou, Douyin, and JD.com; in home care, online growth came from PDD and JD.com.
Promotion: Consumers’ participation in promotion has been stable since 2020, with the exception of personal care, which has steadily risen 2.8 percentage points during the same period (see Figure 14). If personal care was a promotions frontrunner, other sectors were less driven to discount. In fact, personal care and home care spend made during promotion remained much higher than in packaged food and beverage.
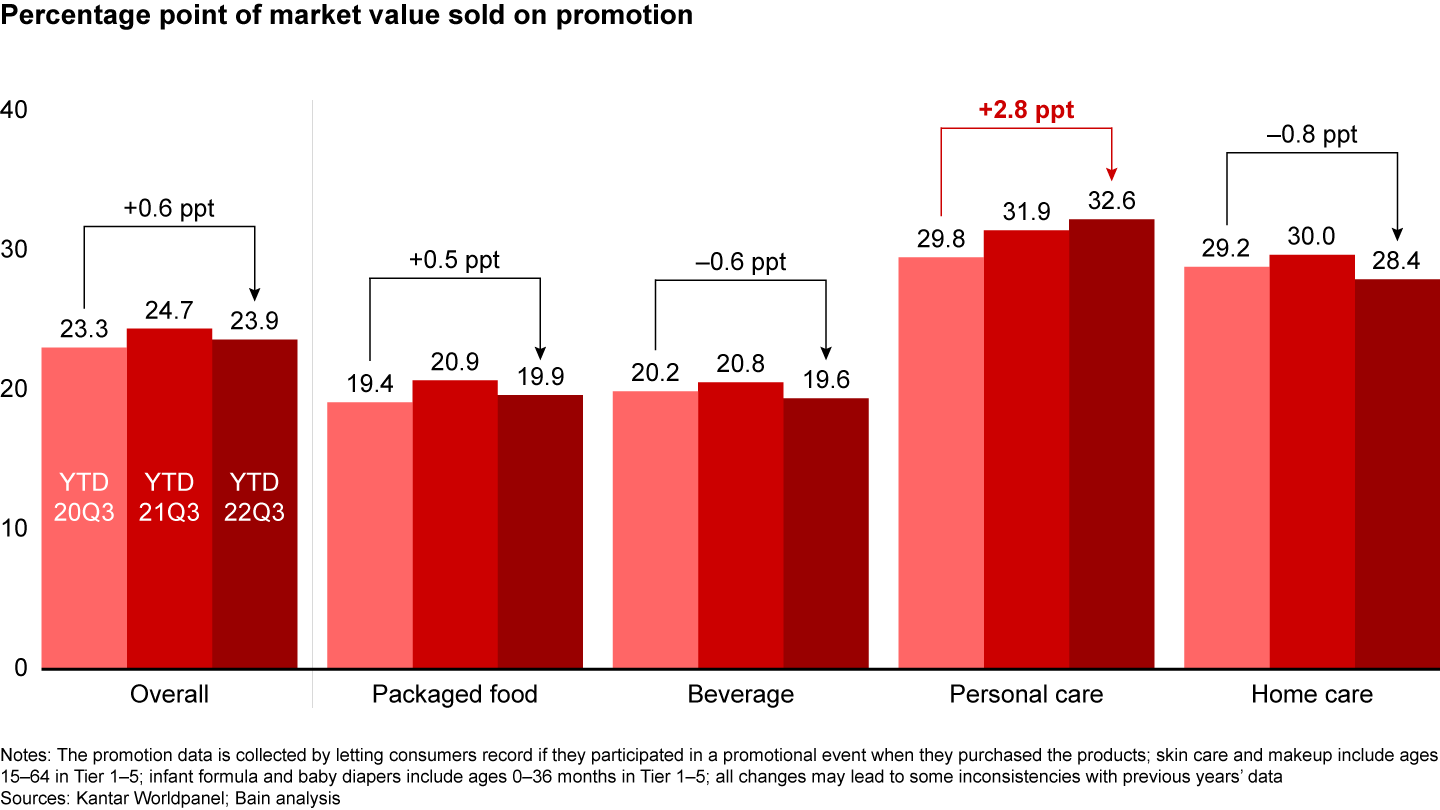
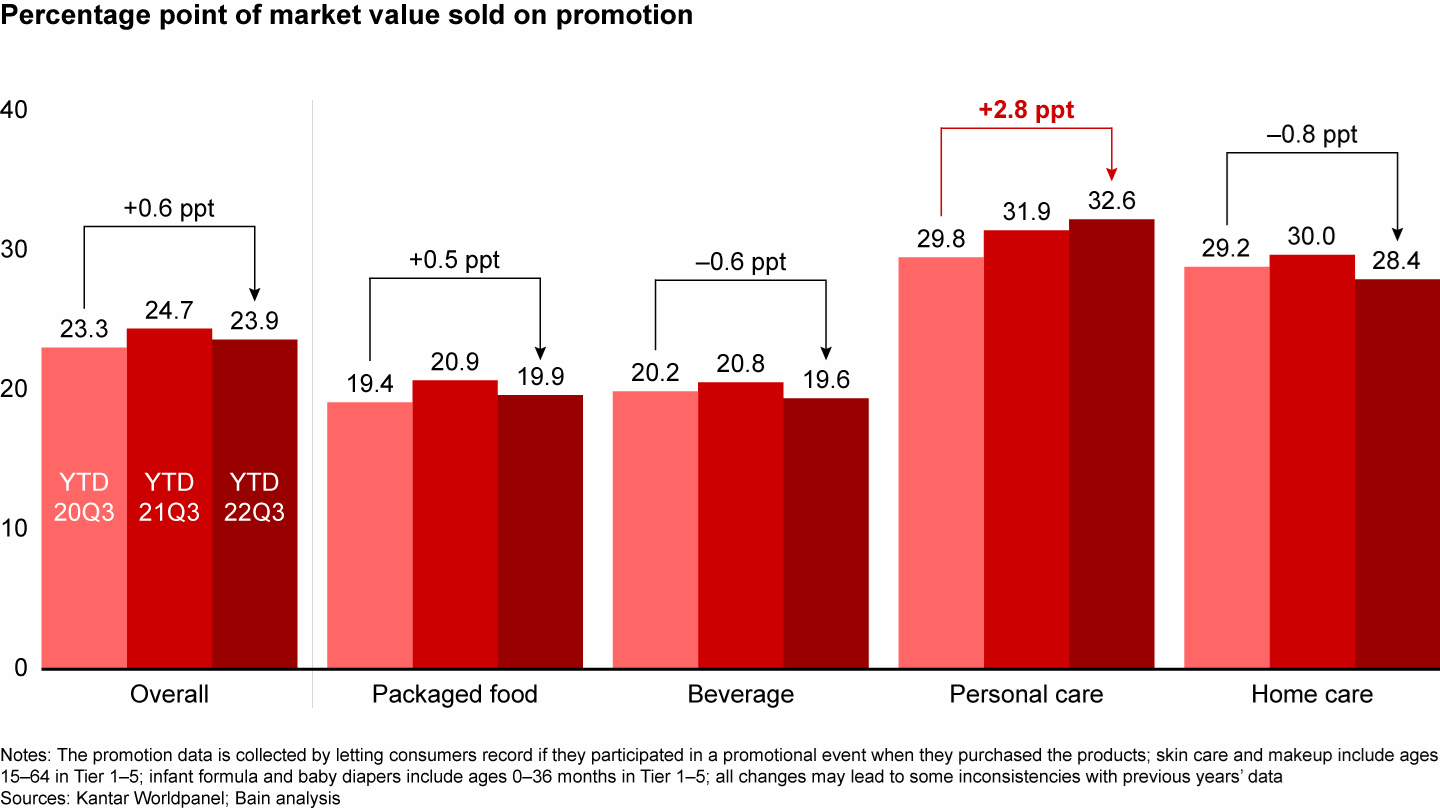
It appears that the more frequent lockdowns under the zero-Covid policy had little impact. Despite somewhat depressed consumer demand, brands and retailers offered roughly the same level of promotions and discounts in the face of cost pressures and supply shortages. Locked-down consumers didn’t seem to mind, prioritizing availability of essential items over discounts. In the background, promotions also continue to be a baseline expectation vs. special feature, given the rise of everyday-low-price e-commerce retailers like PDD.
When it comes to seeking sales, consumers go online vs. to offline stores, which they view as a less promotion-oriented destination. Thus, at the category level, we saw a high correlation between categories’ online penetration and the percentage sold on promotion. Items like diapers, infant formula, and skin care have a high online penetration rate and correspondingly high reliance on promotion (see Figure 15). In contrast, toilet tissue, kitchen cleaner, milk, and carbonated soft drinks—categories that rely more on offline channels—decreased promotion participation this year.
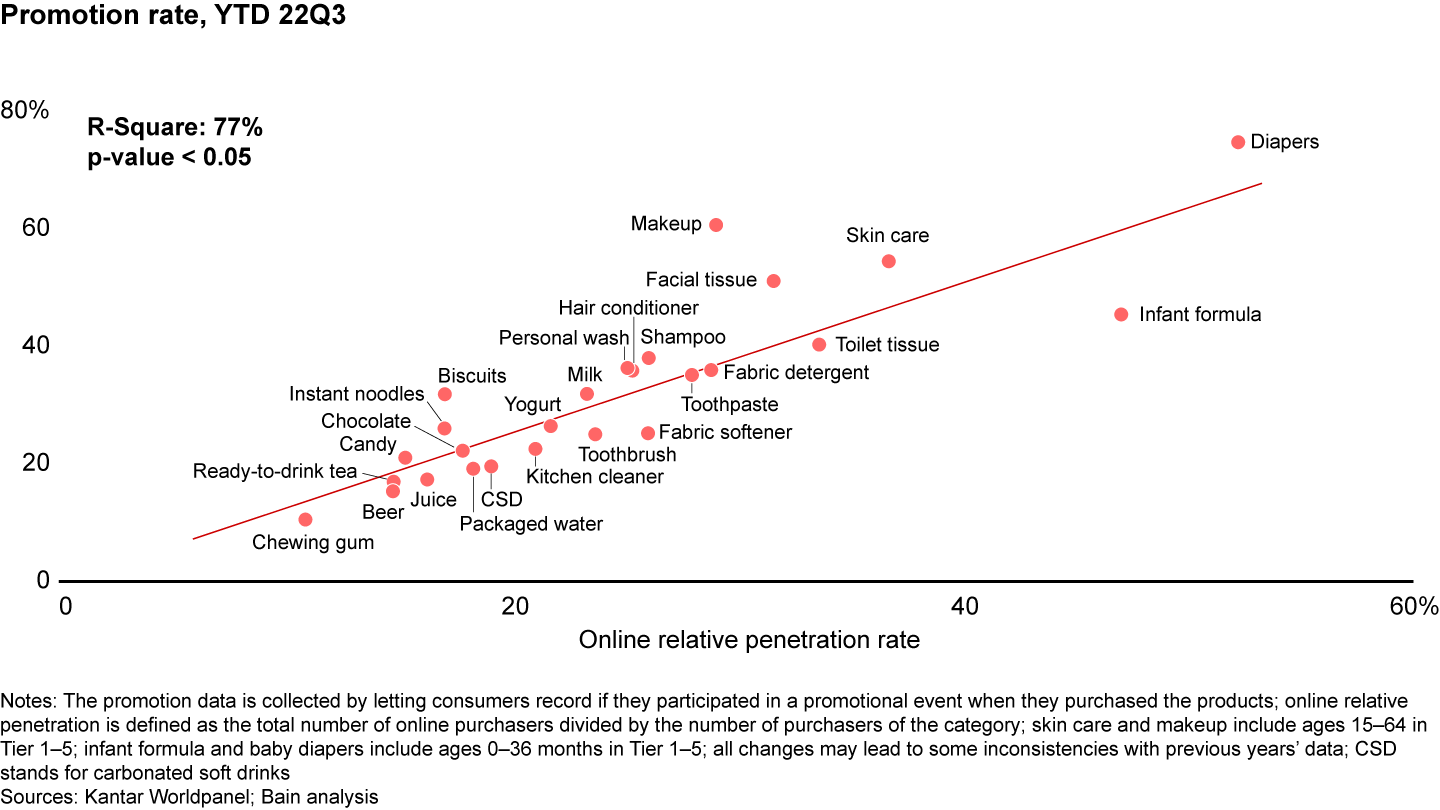
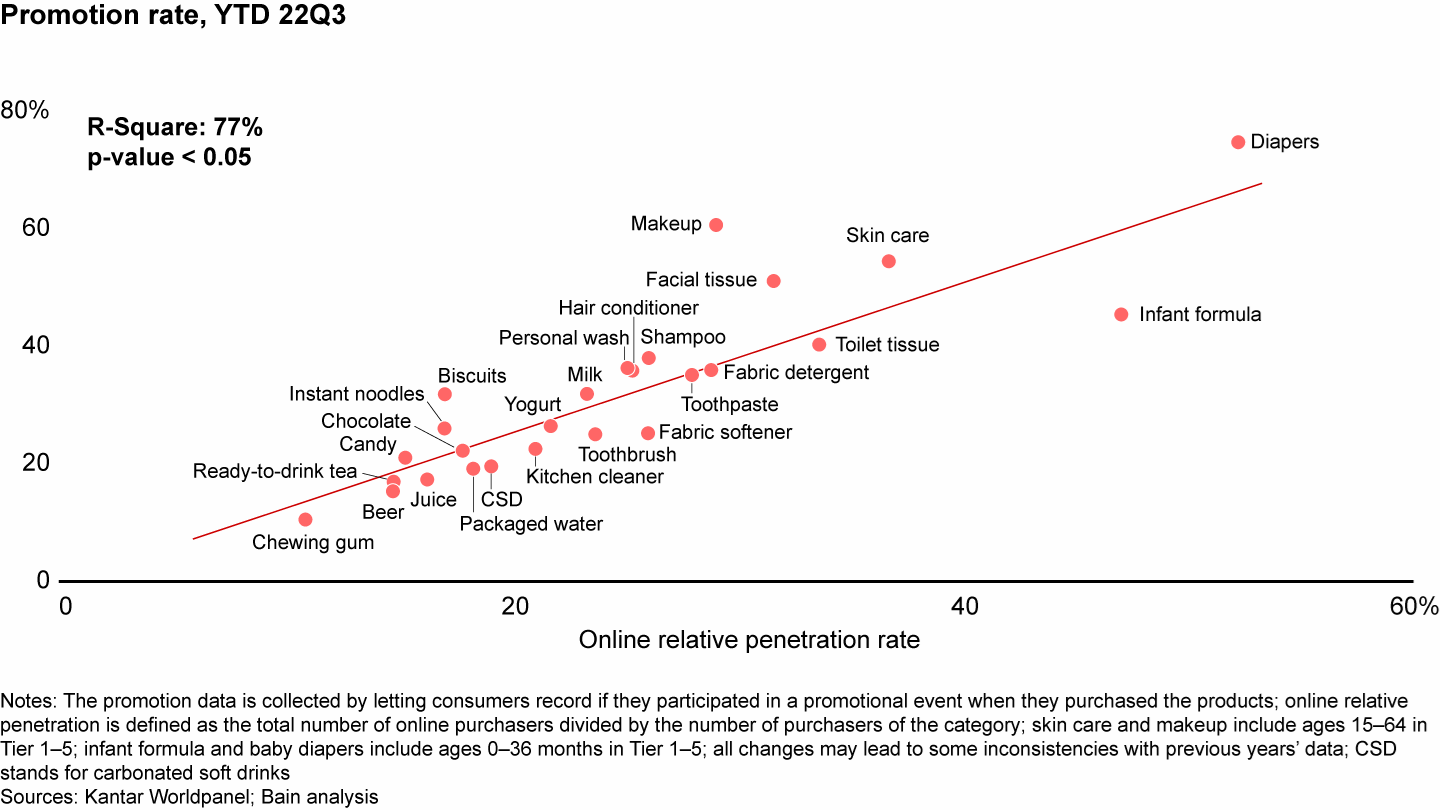
Categories hit hardest by sweeping changes, be it the pandemic or demographic shifts, increasingly turned to promotions to spark consumer demand. As makeup and skin care lagged during Covid, local players upped promotions to compete with foreign competitors. The national birth rate’s descent to a record low last year hurt infant formula and diapers, prompting more promotion—despite an already high level—and fierce market competition to win new consumers.
A return of three pricing patterns—plus an emerging one
The four distinct pricing patterns we identified in Volume 1 largely hold true, with some emerging category shifts (see Figure 16). While the polarization trend previously identified was no longer remarkable in the first three quarters of 2022, it has become more evident across categories. Further, consumers’ stock-up behavior during Covid outbreaks brought about a new pattern unique to 2022.
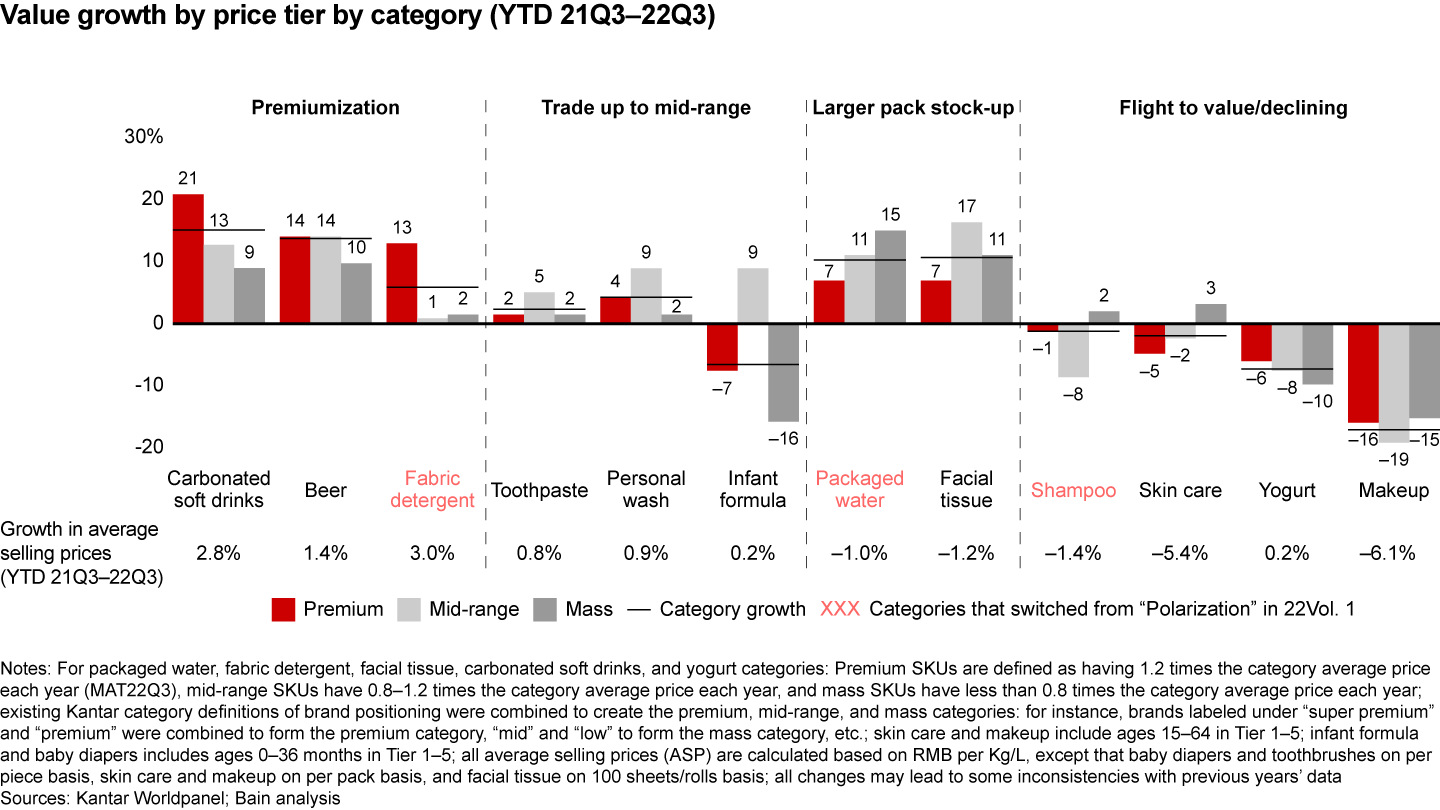
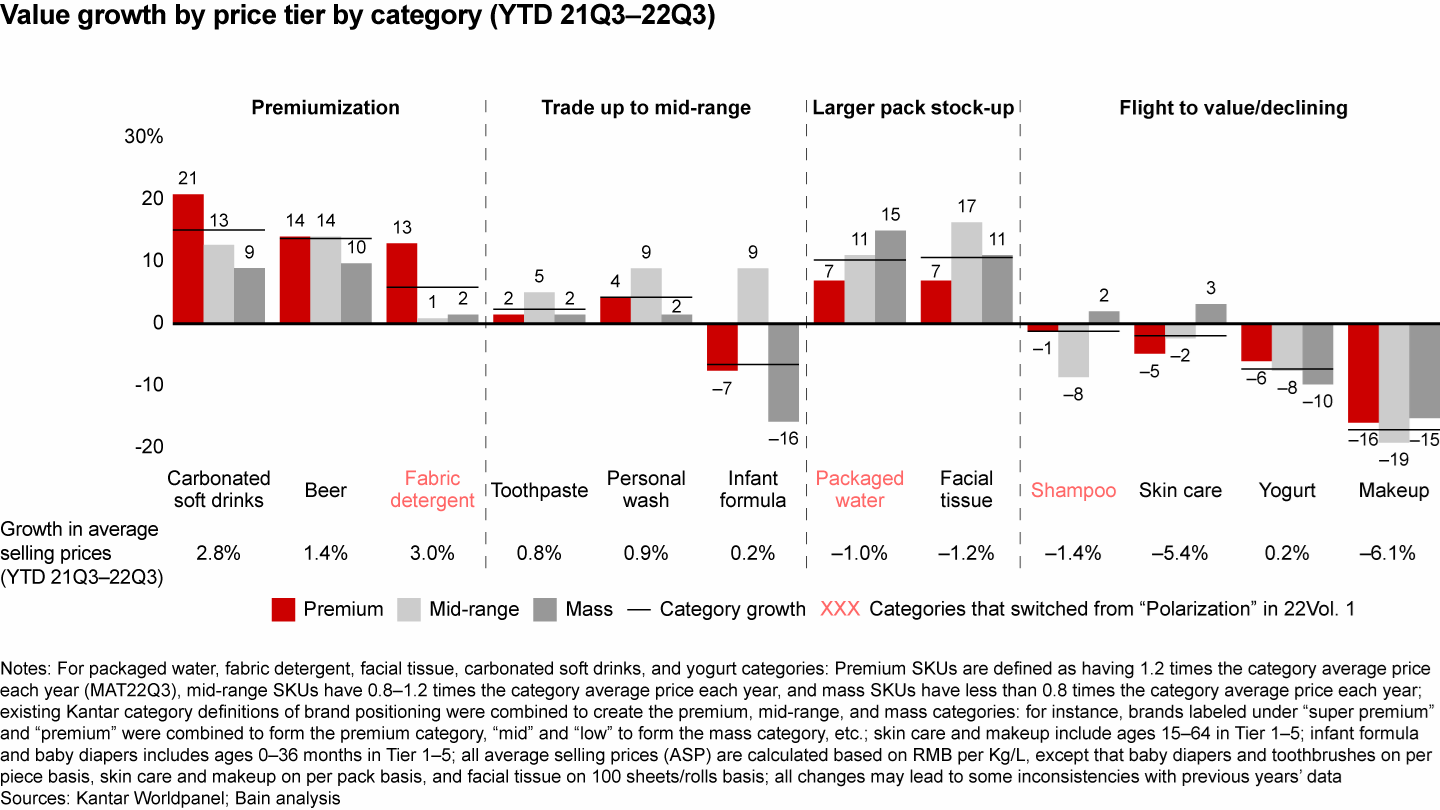
Continuous premiumization: Consumers continued to premiumize carbonated soft drinks and beer. Fabric detergent, which we last reported was a polarizing category, also showed strong (13%) growth in the premium segment, while stagnating in mid-range and mass. Categories in this cluster saw success from continual innovation based on consumer insights and success at targeting products to consumers’ preferences.
Fabric detergent’s evolution—from basic powder, then liquid, to concentrate and capsule—drove up the premium segment. Brands like Walch have also made strong inroads with a nascent but growing specialty segment, lingerie detergent, which outpaced the overall detergent category. Another example is carbonated soft drinks, which kept its premiumization momentum as local insurgent and traditional brands frequently launched innovative flavors that attracted new customers and kept others coming back for more.
Trade up to mid-range: Toothpaste, personal wash and infant formula all maintained their previous trend, showing strong growth momentum in the mid-range price segment. In a bid to win new customers and earn loyalty from existing ones, insurgent and incumbent personal wash brands introduced myriad new product concepts over the past couple years. However, relative to skin care, personal wash is a relatively “low involvement” category; consumers return to the familiar rather than research new options. Without a compelling reason to buy premium, consumers opted for hero products from household names like Lux, which led the category with continuous investment in marketing that reinforced its “top-of-mind” brand value.
In toothpaste, products with articulated functional claims tended to enjoy greater pricing power compared with offerings with differentiated packaging. Domestic players like Yunnan Baiyao drove this overall trend toward mid-range by precisely identifying consumers’ unmet needs and zeroing in on functional benefits for painful/bleeding gums. With this focused approach, the brand steadily gained share from established multinational players.
Larger pack stock-up: Packaged water and facial tissue both saw a 1% decline in ASP, with the lower-price tier segments leading the growth. Sporadic Covid lockdowns motivated consumers to purchase daily essentials in bulk, which dragged down the average price point per volume. In packaged water, a 4-liter Nongfu Spring product could be more than 25% less expensive per liter than a regular 550-milliliter bottle. In the past, it was hard to justify selling multi-pack or larger-size packaged water online, due to the high delivery cost relative to product price point. That changed as the O2O model converted users and met the moment—consumers’ growing need for at-home consumption.
Flight to value/declining: With inflation came consumers’ growing preference for value-for-money options for a few categories. Among them was skin care, which saw a continuation of its early 2022 downward slope, and shampoo, which previously showed a polarization trend. The headline in skin care is a noteworthy consumer shift toward more affordable products through domestic substitution. Proya, Winona, and Chando are all domestic skin care winners that showed remarkable growth this year despite industry decline.
Yogurt and makeup continued to show a steady declining trend across all price tiers. From the demand side, consumers curbed their non-necessity spending during lockdown. Relatively weak association between yogurt and health benefits (particularly relative to milk) made it a less essential category and resulted in its decline across the board. Beyond weaker consumer pull, the makeup category also faced fierce competition and relied on larger promotions to generate sales, seeing drastic declines in all price segments.
City tier variance
Across all city tiers, price trend differences were most pronounced in beverage and home care categories, where Tier 1 cities scored positive ASP growth and reached approximately 5 percentage-point-variance with Tier 5 cities.
Consumers in Tier 1 cities drove the growth in categories with ongoing premiumization like carbonated soft drinks, beer, and fabric detergent. In contrast, the downward ASP trend in Tiers 2 through 5 were mainly driven by consumers’ value-seeking behaviors, including trading down to more affordable alternatives or purchasing larger pack sizes.
What’s ahead in 2023—and what it means for brands and retailers
No doubt 2022 was a challenging year, marked by the pandemic’s resurgence and the resulting soft economy. Following its plummet in April, consumer confidence will take a long time to recover, and shoppers will continue to want to build savings. Next year is likely to remain volatile, resuming some of the trends we’ve seen in 2022 while seeing improvement in others. China’s government recently announced plans to refine Covid control measures to mitigate the impact on both economic development and daily lives. While this is good news for the FMCG industry, players must stay agile and prepare for shake-ups.
So how can brands best position themselves for success?
Identify growth opportunities: As market dynamics shift and competition intensifies, brands must find new growth engines. By thoroughly assessing market and consumer trends, they can expand into new geographies, enter or create new market segments, sell into new channels, and interact with consumers via new touchpoints—all potential avenues to growth.
Improve efficiency: Rising input cost and unexpected supply chain disruptions will force brands to manage cost more carefully or even reset their cost base to deliver sustainable financial returns. To sustain consumer demand and preserve brand relevance, brands should adopt a test-and-learn approach: continuously optimize marketing effectiveness, while dynamically adjusting pricing, assortment, packs, and promotion to maximize revenue potential.
Plan for uncertainty: Facing enduring pandemic and geopolitical tension, brands must better anticipate changes and build flexibility and resilience. Scenario planning can help them develop non-regret moves and contingency plans for different events based on signposts and triggers.
Retailers also have their marching orders.
Transform business model with balanced scorecard: As the retail industry faces continued deflationary pressures, retailers need to shift focus from GMV and topline growth to sustainable operations and profit margin. Critical levers include optimizing store footprint and SKU assortment.
Improve shopper loyalty with distinct shopper experiences: In a challenged retail market, retailers need to focus on core consumer segments and improve shopper loyalty via differentiated services and consumer engagement across multiple channels. Doubling down on creating a frictionless O2O shopping experience could help pave the path to success.
Build differentiation with exclusive assortment: As consumers are pulling back on spend, and capital markets are investing less into the retail markets, retailers need to establish a differentiated portfolio. Private label or exclusive products could help draw traffic and attract new consumers.
The good news is there are reasons to be optimistic. China’s FMCG industry has demonstrated remarkable resilience in the first three quarters, as both brands and consumers have honed their adaptability to changing circumstances. Further, there are beacons of hope: China’s growing middle class, continuous urbanization, and a controlled inflationary environment. If FMCG companies can keep their fingers on the pulse of consumer needs and remain nimble, they can chart a path toward healthy performance.

Kantar—Understand People, Inspire Growth
As part of Kantar, the world’s leading marketing data and analytics company, Worldpanel provides brands and retailers with a unique, 360-degree understanding of consumer behaviour across the globe. We are shopper-centric, continuously monitoring the purchase and usage behaviour through the largest omnipanel in the world to shape the brands of tomorrow by better understanding people everywhere. With unparalleled datasets, pioneering technology and expert analysts, we partner with brands and retailers of all sizes, empowering them to reimagine what’s possible, and change the landscape to create a better, healthier, more sustainable and inclusive world. In the China market, the Worldpanel division is one of the services in CTR, covering over 100 FMCG categories, 50,000+ brands and 100+ retailers, among many others.
Notes
- These 26 categories are (a) packaged food: biscuits, chocolate, instant noodles, candy, chewing gum, and infant formula; (b) beverages: milk, yogurt, juice, beer, ready-to-drink tea, carbonated soft drinks, and packaged water; (c) personal care: skin care, shampoo, personal wash, toothpaste, makeup, hair conditioner, diapers, and toothbrushes; and (d) home care: toilet tissues, fabric detergent, facial tissues, kitchen cleaner, and fabric softener.
- These categories include beer, chewing gum, chocolate, yogurt, milk, candy, biscuits, packaged water, ready-to-drink tea, juice, and carbonated soft drinks