


Expert Commentary


|
At a Glance
When a company needs to determine which drivers have the greatest influence on an outcome, it can turn to key driver analysis. This allows decision makers to learn where to focus their efforts so as to achieve the greatest impact. The Elements of Value in retail bankingIn this commentary, we use the same dataset as in an earlier commentary. Our hypothetical retail bank is trying to understand what drives customer advocacy. Data comes from a survey of 2,500 consumers, asking how likely they are to recommend a certain brand to a friend or colleague—the core Net Promoter ScoreSM question. This likelihood to recommend becomes the outcome variable, the goal being to understand which variables have the strongest associations with the NPS® metric. Potential drivers are a set of 30 attitudinal statements capturing how well a certain brand performs on the Elements of Value® as experienced by customers (see Figure 1). The survey asked respondents to rate their experience with the bank on each Element of Value using a scale of 0–10. Delivering on multiple Elements of Value can lift products or services above commodity status.
Figure 1
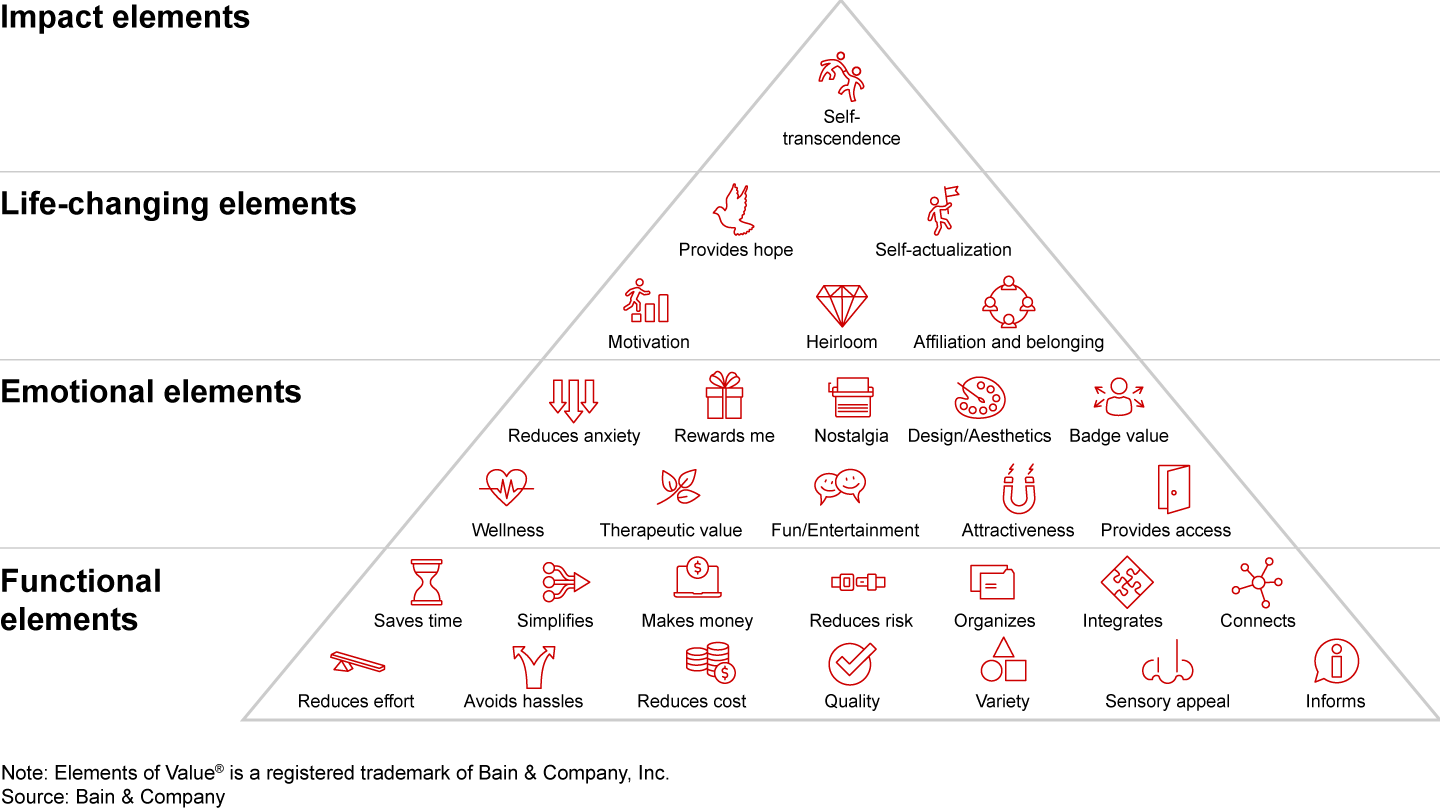

Variable importanceIn the earlier commentary, we discussed analytical techniques commonly used for key driver analysis. We demonstrated that many methods, such as MLR, random forest variable importance, or partial correlations, penalize collinear drivers by reducing their ranking compared with other, less collinear drivers. This behavior can be problematic when collinearity among drivers is high. An important driver should still be important even if it is collinear with other drivers. We recommend using methods that assess the relationship of a driver with the outcome variable independently of other drivers in consideration. Correlation analysis is the most prominent of such methods. The first task of driver analysis is to rank drivers in the order of their importance. We concluded the earlier commentary by showing the relative importance of the drivers according to Pearson correlation1 with likelihood to recommend (see Figure 2).
Figure 2
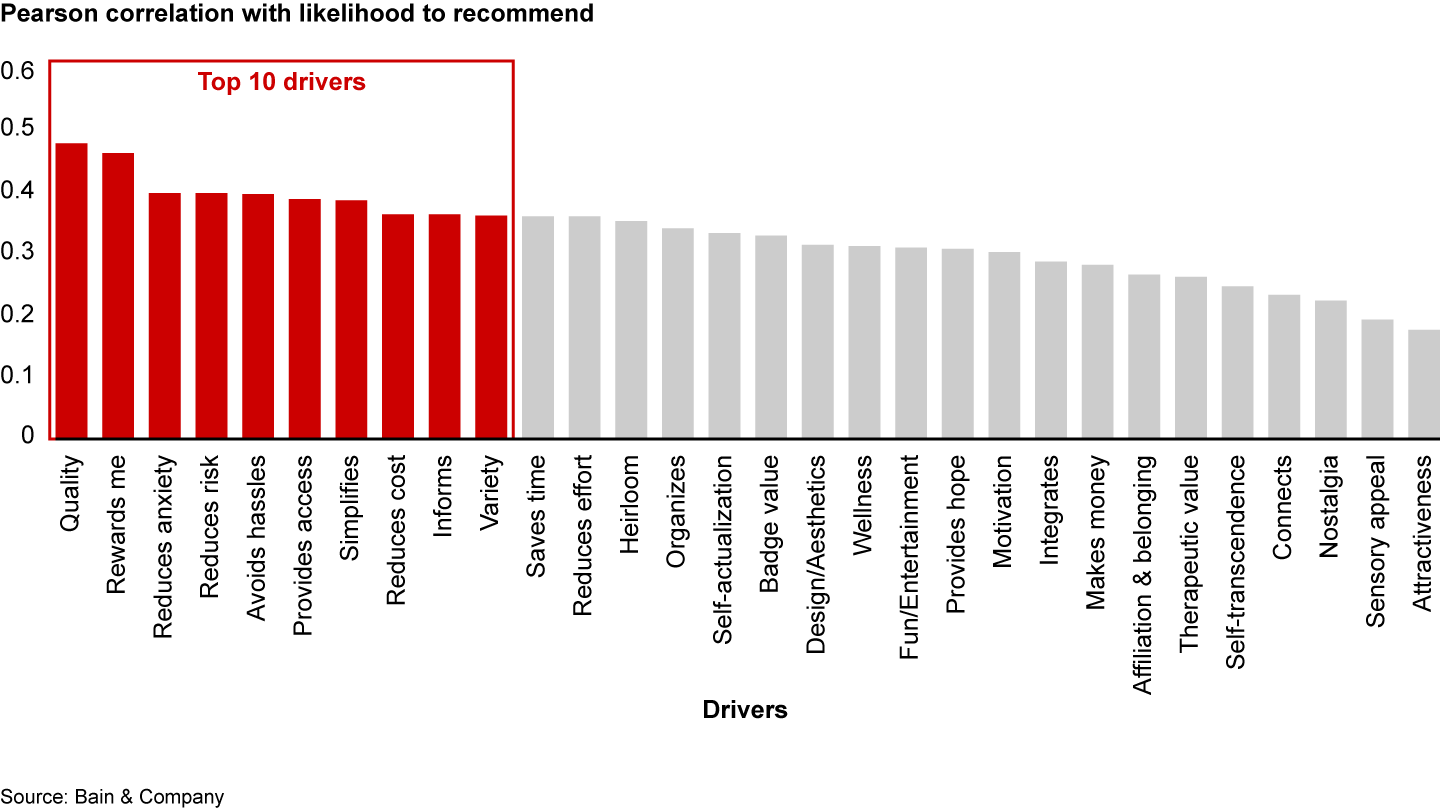

Quality was ranked as the most important driver, with Rewards me and Reduces anxiety in second and third place, respectively. This outcome makes intuitive sense given that our survey focused on retail banking products. Many companies would conclude their driver analysis by shortlisting the top 5 or 10 drivers. We recommend taking an additional step, namely, analyzing how drivers are interrelated among themselves. Understanding interdependencies among driversUnderstanding dependencies among drivers is not just a theoretical exercise. This analysis has practical implications that many business managers will find helpful when designing interventions:
An analyst can use one of two approaches, or both, to determine driver interdependences. Approach 1. Dimensionality reduction methods such as principal component analysis (PCA). Dimensionality reduction can reveal groupings of drivers that are interrelated. As our drivers are psychometric measurements obtained through survey research, variable groupings in this context reveal drivers that are similar in the minds of survey respondents, and hence have similar ratings. Figure 3 demonstrates the results of running PCA on our driver data, with the top 10 drivers highlighted by PCA groupings.2
Figure 3
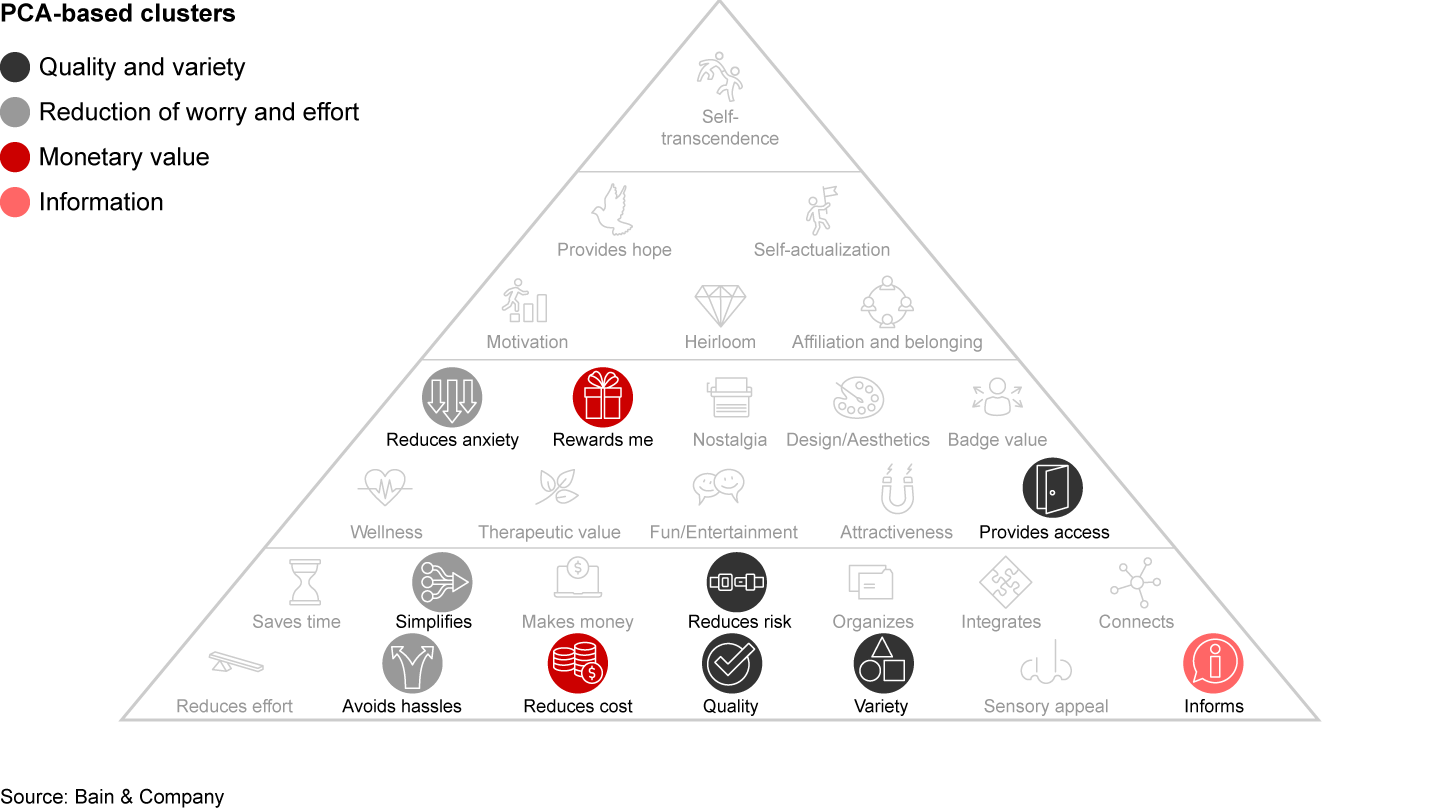

Drivers of the same color are interlinked in the minds of consumers. There are two potential interpretations:
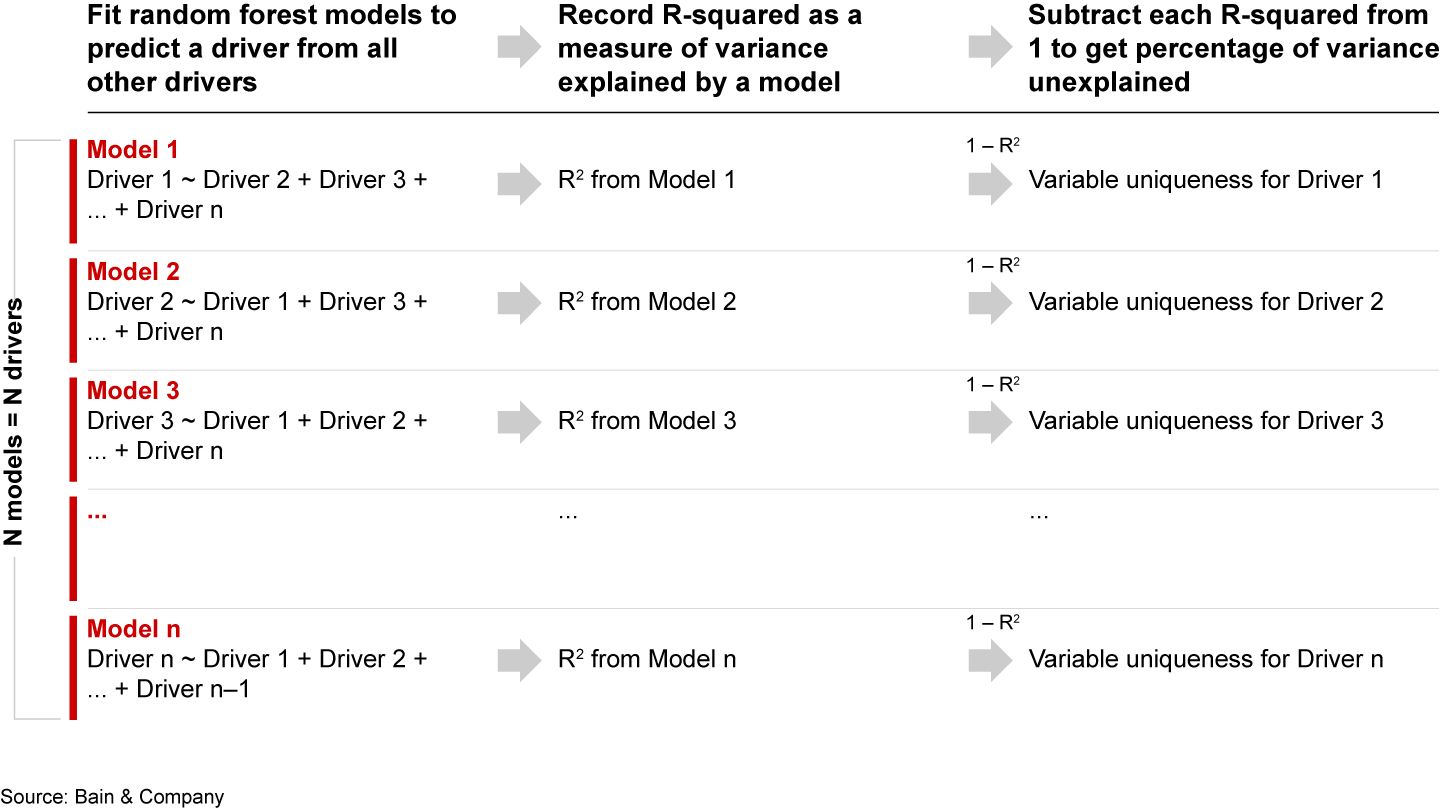
As with any descriptive analysis, PCA cannot directly answer causal questions. Yet the groupings can provide valuable clues. One might want to consider whether a grouping potentially contains a root cause driver, because improving that driver might boost customer perception of other elements in the group. In perceptions of Quality, Reduces risk and Provides access tend to move together in consumers’ minds. This might indicate that perceptions of quality of retail banking products are driven by how well a bank manages to reduce risk for customers and provide access to products and services. Quality can mean different things in different industries, so knowing what other factors Quality links to in an industry can be helpful. Approach 2. Measuring variable uniqueness To estimate variable uniqueness for a driver, we fit a random forest3 model where that driver itself is the dependent variable, and all other drivers are independent variables. R-squared4 from that model is an estimate of the percentage of variance in driver A explained by other drivers. To estimate variable uniqueness, we subtract R-squared from 1 (see Figure 4).
Figure 4

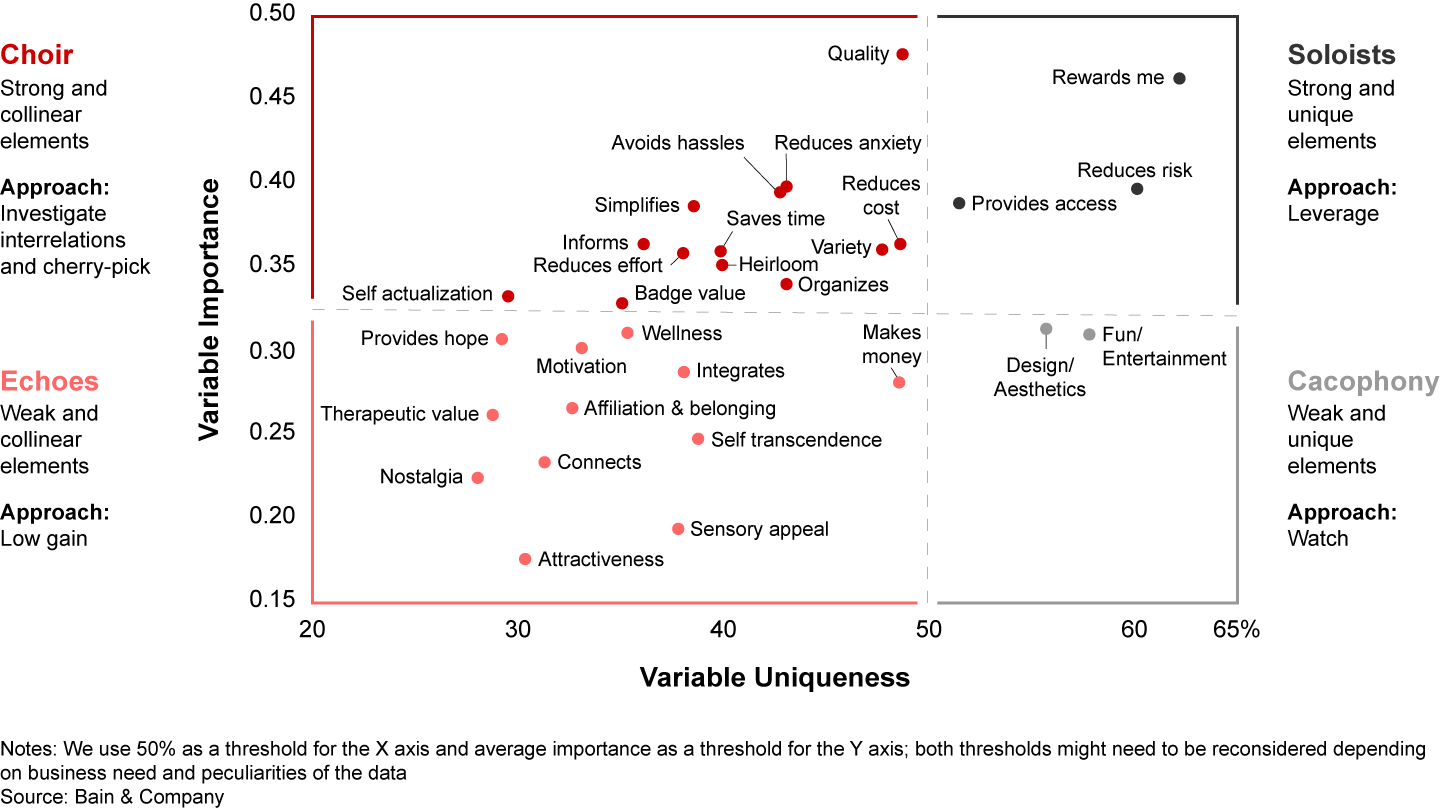
How can companies use variable uniqueness? We suggest using it alongside the chosen metric of variable importance. Figure 5 shows drivers plotted according to their importance and uniqueness, with a separate approach to drivers in each quadrant.
Figure 5

An effective key driver analysis should include two steps. First, an analyst ranks potential drivers by the strength of their relationship with the outcome variable, using correlation analysis or other bivariate methods. Next, the analyst aims to understand interrelations among drivers. Understanding collinearity allows managers to make an informed decision on whether a single set of actions can address several drivers at once, or whether each driver needs an approach of its own. Net Promoter®, NPS®, NPS Prism®, and the NPS-related emoticons are registered trademarks, and Net Promoter Score℠, NPSx℠, and Net Promoter System℠ are service marks of Bain & Company, Inc., NICE Systems, Inc., and Fred Reichheld. Elements of Value® is a registered trademark of Bain & Company, Inc. |