


Report

|
|
Executive summary When Chinese shoppers purchase most consumer products, they typically choose among several brands instead of showing loyalty to a specific brand. Winning shoppers in this environment is both a challenge and an opportunity for marketers. Success rests on understanding actual shopper behavior—what they do at the point of sale as opposed to what they say they’ll do in surveys. Bain & Company partnered with Kantar Worldpanel to study the shopping habits of 40,000 Chinese households. Our study helped us gain invaluable insights into how shoppers make purchases in 26 important consumer goods categories (see Figure 1). Among the key findings: • In most situations, as shoppers buy more frequently in a category, they also tend to buy more brands in that category. We call this tendency to choose different brands for the same occasion or need repertoire behavior (repertoire being the set of brands purchased by a consumer or shopper within a given category). Their willingness to buy a variety of brands is just as true for heavy shoppers in a category—those who are the top 20% of the most frequent purchasers in a category—as it is for average shoppers. • It’s not a matter of brands being unimportant to these shoppers. Based on our experience working with clients in China, brand is always a major purchasing criterion. The importance of brands has been established by earlier Bain studies involving buyers in several food and non-food categories in China. In those studies, more than 60% of shoppers listed brand among the top considerations in the purchase process. But the fact is, while Chinese shoppers think about brands, our latest study found they don’t necessarily think about any single brand when they make a purchase.
• While repertoire behavior prevails in China, there are a few product categories where shoppers are more loyal—they repeatedly buy one brand for a specific need or occasion. Those categories include infant formula, baby diapers, beer, milk, carbonated soft drinks and chewing gum. In these categories, the increase in buying frequency does not translate into purchasing more brands. • Two factors contribute to the loyalist behavior of these shoppers. First, brand concentration: Chinese shoppers typically have a limited number of brand choices when buying beer, milk, carbonated soft drinks and chewing gum. Second, routine consumption: In categories such as milk, people who consume the product on a regular basis tend to be more loyal. Buying the brand becomes a habit. However, these more loyal shoppers are a small group, representing less than 10% of total brand sales in these categories. Data and insights to help consumer goods players in China Understanding category dynamics is critical for consumer goods makers racing to keep pace with surging demand for their brands by a new generation of Chinese shoppers. With China’s gross domestic product growing by 10.5% annually in the past five years, the average household’s disposable income rose 13.3% in the same time period to RMB 75,800 in 2011, according to Euromonitor. With more money to spend, Chinese shoppers have catapulted China ahead of Japan to make it the world’s second-largest consumer goods marketplace, following the US. This report presents a groundbreaking look at Chinese shoppers, bringing their purchasing behaviors into sharper focus. For consumer goods makers in search of growth, the findings help fill a serious void, providing detailed data and in-depth analysis of shopper behavior—information that has been limited until now. Our study provides much richer analysis and sharper insights into shopper behavior than traditional market research. Instead of simply asking questions about past purchases and future intentions, Kantar armed shoppers in 40,000 households with scanners that tracked their actual purchases in real time. Together, we looked at detailed records in the 26 selected consumer goods categories for 2011 and reached several important—and at times, surprising—conclusions. This comprehensive study covers all Chinese city tiers and life stages. Shoppers from 373 cities in 20 provinces and four major municipalities participated.1 They reflect the vast range of shopping options available in China today, from the modern trade that flourishes in Tier-1 cities (hypermarkets, supermarkets and convenience stores) to traditional trade that is common in smaller modern cities (mom-and-pop grocery shops, specialty stores and department stores). Also included in the study: China’s young but burgeoning e-commerce market. We tracked older, married shoppers buying shampoo in the aisles of a Guangzhou hypermarket and young students purchasing chewing gum in tiny mom-and-pop stores in cities like Lijiang. The categories we analyzed span beverages, packaged foods, personal care and home care—the four largest consumer goods groups, which account for more than 80% of China’s consumer goods market. And the brands we studied represent more than 50% of the market value of these four groups. Implications For marketers, the implications are far-reaching, providing insights that will help them shape strategic decisions. The path to winning begins by understanding the type of category in which you compete. For brands in repertoire categories:
For brands in loyalist categories:
Full report We know from our experience working with clients across consumer goods categories that Chinese shoppers love brands. For example, in Bain studies involving shoppers of shampoo, conditioner and body care products, brand was named among the top considerations in the purchase process by more than 60% of the shoppers studied. However, while brands are important, Chinese shoppers don’t think about one brand very often. That was demonstrated when we looked at how frequently shoppers bought the top three brands in a category (see Figure 2). Of the 16.2 times yogurt was bought by the average Chinese household last year, shoppers chose one of the three top brands for only 4.6 of those purchases. This low purchasing frequency indicates that Chinese shoppers don’t often have just one brand in mind, despite what marketers sometimes think.
Bain has been codifying shopper behavior in different consumer goods categories since 2007. Based on that experience, all shopper behavior ranges between two extreme types: loyalist and repertoire. Shoppers demonstrate loyalist behavior when they frequently buy one brand for a specific need or occasion. In contrast, shoppers exhibit repertoire behavior when they choose multiple brands within a category for the same occasion or need. Most people display a range of both loyalist and repertoire behaviors, depending on the category. Also, the same category may elicit different purchasing behaviors from one country to another. Brand strategy and activation models work best when tailored to consumer behavior. Prevalent repertoire behavior In most of the 26 consumer goods categories, we found that the vast majority of shoppers are, in fact, defined by repertoire behavior. The shoppers tend to choose more brands in the categories that they buy more frequently (see Figure 3). 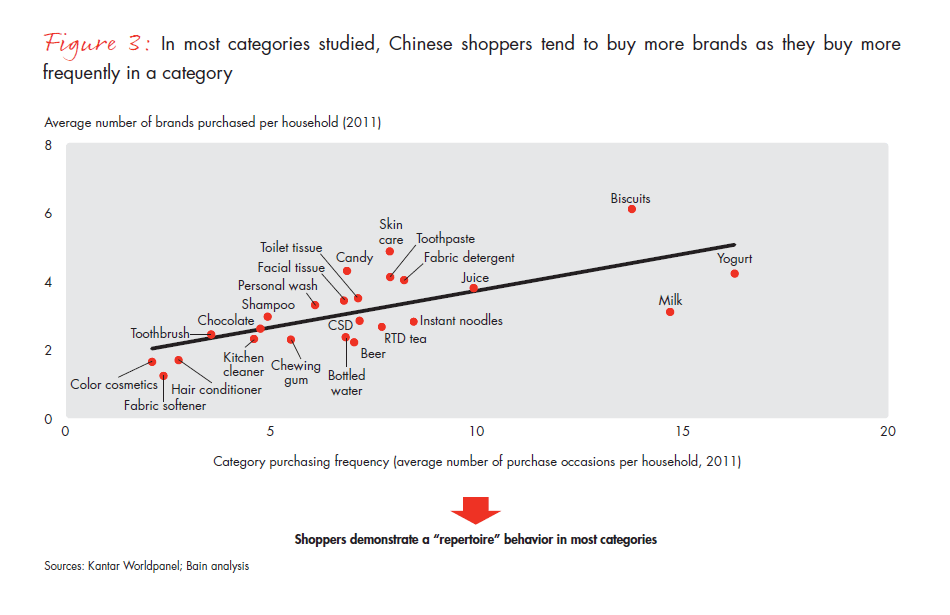
Another finding is that even as shoppers increase their purchasing within most categories—as they buy more juice or chocolate, for example—they use it as an opportunity to try different brands in the category (see Figures 4 and 5). The average Chinese household purchased 6.2 brands of biscuits (cookies) last year. The heavy shoppers in the category—those representing the top 20% of biscuit purchasers who buy most frequently—bought 10.4 brands. 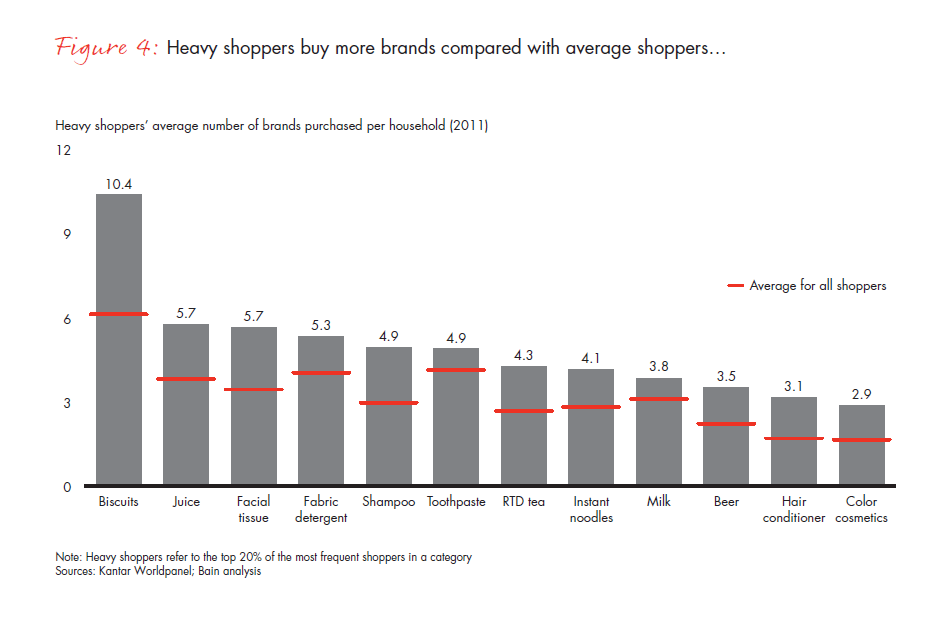
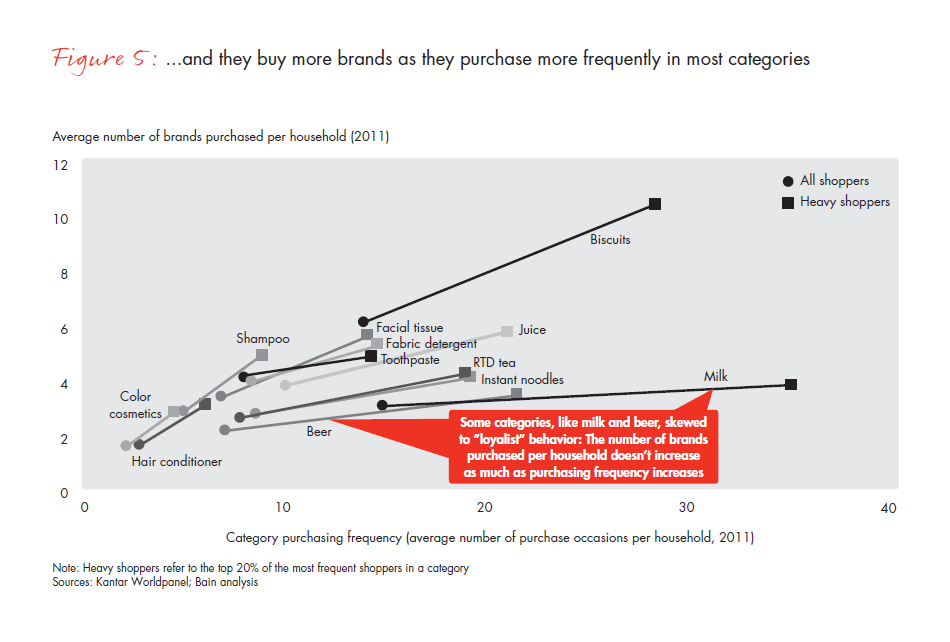
Or take facial tissue. The average shopper bought the product 6.7 times last year, alternating between three and four brands. But heavy shoppers, who purchased facial tissues 14 times last year, chose five or six brands. Indeed, our research suggests that in repertoire categories, a brand’s heavy shoppers are often heavy shoppers of competing brands, too. Consider the story of Oreo, the market leader in China’s biscuit category. Since introducing Oreo to Chinese shoppers in 1996, Kraft Foods took a number of steps to recruit new consumers. For example, it jump-started sales by lowering the sweetness level to adapt to local tastes. It also introduced smaller packages of the original Oreo biscuits and also Mini Oreo in cups, to make Oreo more affordable to the majority of Chinese shoppers and better suited to their preference for bite-size treats. And it introduced local flavors like green tea ice cream. To educate Chinese consumers about the American tradition of pairing cookies with milk, Kraft launched TV commercials and a grassroots marketing campaign. It recruited 300 university students to serve as Oreo brand ambassadors. By 2008 Oreo reigned as China’s top-selling biscuit, doubling its sales by 2009. Following the right approach in this typical repertoire category, Kraft focused on extending its brand penetration and did not try to push brand loyalty. The 20% of Oreo shoppers who are the product’s most frequent purchasers in China contribute 60% of its sales value. That sounds impressive until you consider the same shoppers also contribute 25% to 35% of competing brands’ sales value. And these heavy shoppers of Oreo spend three-quarters of their biscuit budget on other biscuit brands (see Figure 6).
In fabric detergents, Diaopai's heavy shoppers contribute about 50% of its sales value. But these shoppers also contribute a large percentage to competing brands’ sales value. And the heavy shoppers devote about 65% of their spending to other brands (see Figure 7).
How can brands benefit from heavy shoppers in a repertoire category? The smartest move is not to make your own brand’s heavy shoppers the target of marketing initiatives intended to increase their loyalty. It’s hard to distinguish them from category heavy shoppers—the top 20% of households that make the most frequent purchases in a category. You won’t necessarily make them more loyal. Instead, go after category heavy shoppers as a group. These people are buying different brands, so there’s the opportunity to attract them to your brand. Based on our experience with clients in a range of countries and across consumer goods categories, we found that marketing focused on specific channels or occasions is often the most effective way to target category heavy shoppers. Signs of loyalist behavior In other categories, however, we find shoppers do not increase the number of brands they buy as their purchasing frequency increases—a sign of loyalist behavior. In infant formula and baby diapers, shoppers buy the same number of brands no matter how frequently they purchase them. A heavy shopper buys infant formula 13.4 times a year, while an average shopper makes the purchase 7.1 times. But in either case, there’s little variation in the number of brands they choose—1.8 brands compared with 1.5 brands (see Figure 8).
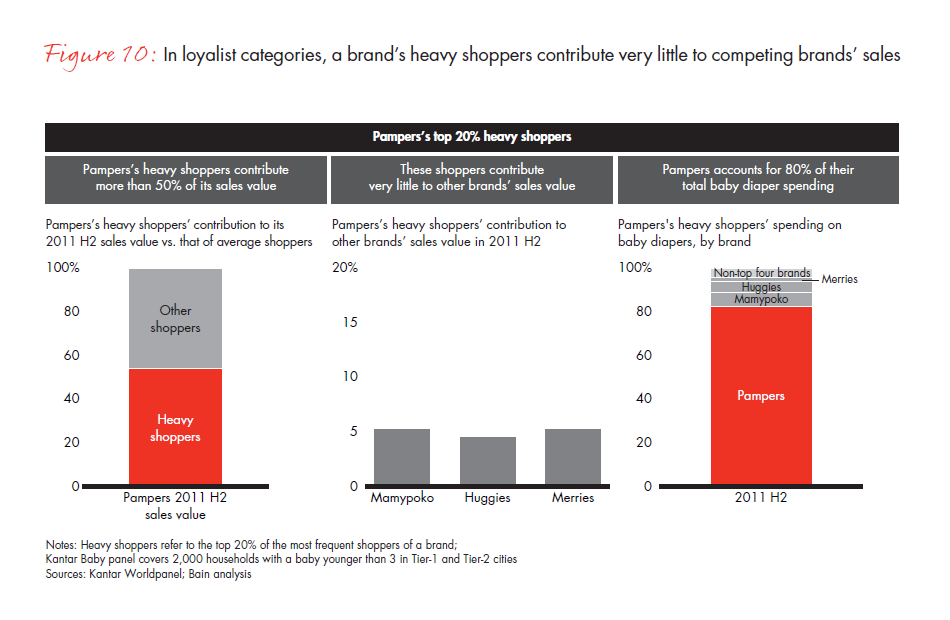
In contrast with the repertoire categories, a brand’s heavy shoppers tend to spend little on competing brands, and the brand has a high share of wallet among its heavy shoppers. (Share of wallet is the percentage of a shopper’s spending that's devoted to a given brand within a category.) Consider the infant formula segment. The top 20% of Mead Johnson’s heavy shoppers account for 40% of the brand’s sales but contribute at most 10% to competitors’ sales. And Mead Johnson claims a significant share of those shoppers’ wallets. Those heavy shoppers devote 85% of their infant formula spending to Mead Johnson (see Figure 9). The situation is similar with Pampers in baby diapers. More than 50% of Pampers's sales come from heavy shoppers, and those shoppers contribute less than 6% to any one competitor. And Pampers earns a high share of wallet from these heavy shoppers—a full 80% (see Figure 10).
One Bain study of shoppers of infant products found that they don’t have motivation to switch brands. The babies aren’t providing feedback on the benefits or drawbacks to the product, so shoppers have little reason to change one brand for another. Also, studies have shown that mothers feel it’s beneficial to a baby’s health to stick with a single brand. And this is one situation in which shoppers often are introduced to a particular brand in the hospital or clinic at the critical moments following a child’s birth—and they tend to stay loyal to that brand. That is why leading infant formula players have medical detailing teams visiting hospitals, nurses and pediatricians, in addition to their salesforce visiting other sales channels. Four other categories show signs of loyalist behavior: milk, beer, chewing gum and carbonated soft drinks. Unlike most other categories, where shoppers try more brands as they buy more frequently, heavy shoppers in these loyalist categories don't increase the number of brands they purchase as they increase their rate of purchase. As their consumption becomes routine, they tend to stick to one preferred brand—which gets more of their share of wallet. And these shoppers tend to spend less on competing brands. We also see loyalist behavior in categories and geographies that are highly concentrated, where the top three brands account for the overwhelming majority of category sales (see Figure 11). Because there are so few players, shoppers are more likely to repeatedly choose the same brand. They are, in effect, forced to be loyal. For example, beer is a category with a particularly high degree of regional consolidation in China, with the top three brands accounting for up to 60% of off-premise sales in a region. That dynamic is reflected in the number of brands shoppers choose. The average household purchased 2.2 brands of beer in 2011 in off-premise channels, which is less than the three brands purchased, on average, across all loyalist categories.
There’s another important factor limiting brand options: traditional trade. Traditional trade accounts for more than half of all beer sales volume in off-premise channels in Tier-2 to Tier-5 cities. Given the limited shelf space in mom-and-pop stores, traditional trade outlets often stock only two brands of beer—compared with six or more brands sold in a modern trade outlet. Therefore, the shoppers sometimes are forced to choose the same brand repeatedly, because it’s the only option they have. What brands are doing to win When we analyzed the leading brands in each of the repertoire categories, we found that winners have one critical thing in common: high rates of penetration compared with the average of the top 20 brands in their category (see Figure 12). 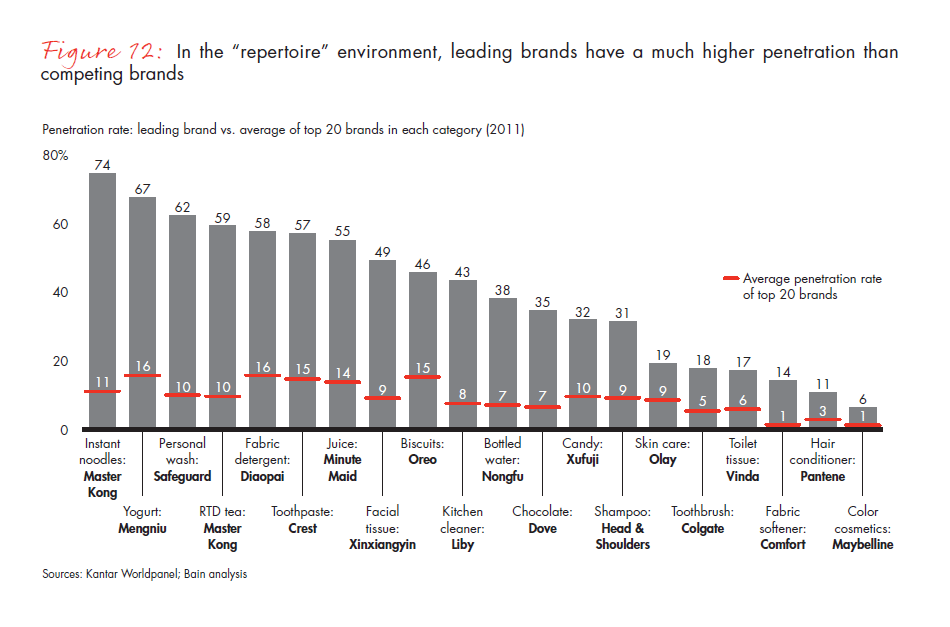
In toothpaste, Crest is the brand with the highest penetration rate—57% compared with the average of 15% for the category’s top 20 brands. Not surprisingly, it’s also the category leader, with 15% market share. Like leading brands in other categories, Oreo maintains the highest penetration rate among any biscuit player. Its penetration rate of 46% is nearly three times the national average for the top 20 brands, and its market share of 10% is higher than that of its competitors. Master Kong has a 29% penetration rate and 4% market share. Nestlé maintains a 16% penetration rate and 3% market share, although its penetration rate is higher in Tier-1 cities. Penetration and purchasing frequency often work hand in hand (see Figure 13). Just as it leads in penetration and market share, Oreo has the highest rate of repurchasing frequency. The brand was repurchased 3.3 times per household in 2011 compared with 2.7 times for Master Kong and two times for Nestlé.
In these categories, success for leading companies has more to do with penetration than other factors, such as whether shoppers make repeat purchases of the brand more than once a year (see Figure 14). In fact, even for the leading brand in each category, more than 40% of brand shoppers are still trial shoppers—they bought the top brand only once last year. Looking at fabric detergents, brand leader Diaopai’s repeat purchase rate of 64% is not significantly higher than followers like OMO (55%) and Bluemoon (46%). And in toothpaste, the rate of repeat purchases for the leader, Crest (58%), is not much higher than that of followers like Darlie (52%) and Colgate (51%). Another factor that is less important than penetration is share of wallet among a brand’s shoppers (see Figure 14). Our study found that some leading brands achieved only an average share of wallet. Look at Diaopai’s share among fabric detergent shoppers: It’s actually lower than that of Liby, OMO or Bluemoon—all of which are market share followers. In toothpaste, leader Crest’s share of wallet is actually significantly lower than that of Darlie and not much above the industry average.
And we found that as they increase penetration, leaders focus on the right product format, city tiers and channels. For example, Bluemoon sells only liquid laundry detergent and has been able to target its penetration efforts on Tier-1 and Tier-2 cities, where shoppers prefer the liquid form. Diaopai focuses on laundry powder and laundry bars, striving to build up its high rate of penetration in Tier-2 to Tier-5 cities, where powder and bars are still popular. Rules of the road Whether a brand is a leader or a follower in its category, gaining market share and sustaining growth in China means following some clear rules.2 In repertoire categories:
In loyalist categories:
As demand for everything from fabric softener to hair conditioner to chewing gum increases at a record pace in China, you can develop a strategy that will help you serve that demand—and profit. Understanding the critical nuances of shopper behavior at the point of sale arms you with the ammunition needed to outpace the competition. These findings from our extensive study on China’s shopper behavior—a groundbreaking look—are valuable to any consumer goods company executive searching for the best way to grow and prosper along with China’s economy. Bruno Lannes is a partner in Bain’s Shanghai office and leads the firm’s Consumer Products and Retail practice for Greater China. Kevin Chong is a partner in Bain’s Shanghai office. James Root is a partner in Bain’s Hong Kong office. Fiona Liu is a manager in Bain’s Shanghai office. Mike Booker is a partner in Bain’s Singapore office and leads the firm’s Consumer Products and Retail practices for Asia. Guy Brusselmans is a partner in Bain’s Brussels office. Marcy Kou is managing director at Kantar Worldpanel Asia. Jason Yu is general manager at Kantar Worldpanel China. 1Kantar Worldpanel’s city tier definition is based on China’s administrative definition. Beijing, Shanghai and Guangzhou are Tier-1 cities; 24 provincial capitals and a handful of prosperous prefecture cities, such as Shenzhen, Dalian, Chongqing and Qingdao, are Tier-2 cities; 228 prefecture cities are Tier-3; 322 city associated districts & county-level cities are Tier-4 cities; and 1,300 counties are Tier-5, without coverage in Inner Mongolia, Ningxia, Gansu, Qinghai, Tibet, Xinjiang and Hainan provinces. The 373 cities in the study are a representative sample of all 1,877 cities. 2For more information on Bain approach of brand building, refer to Bain brief “Introducing the Bain Brand AcceleratorSM” published in 2011. 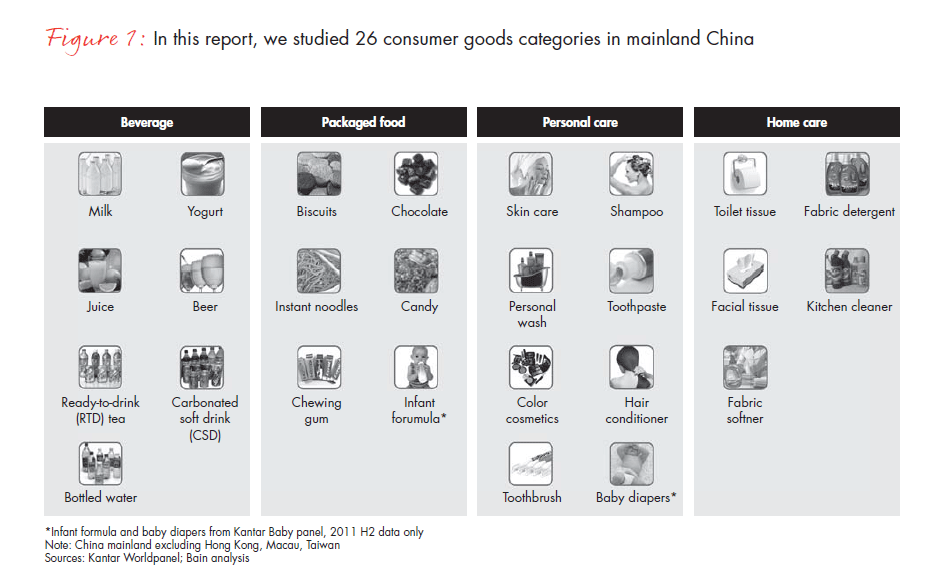 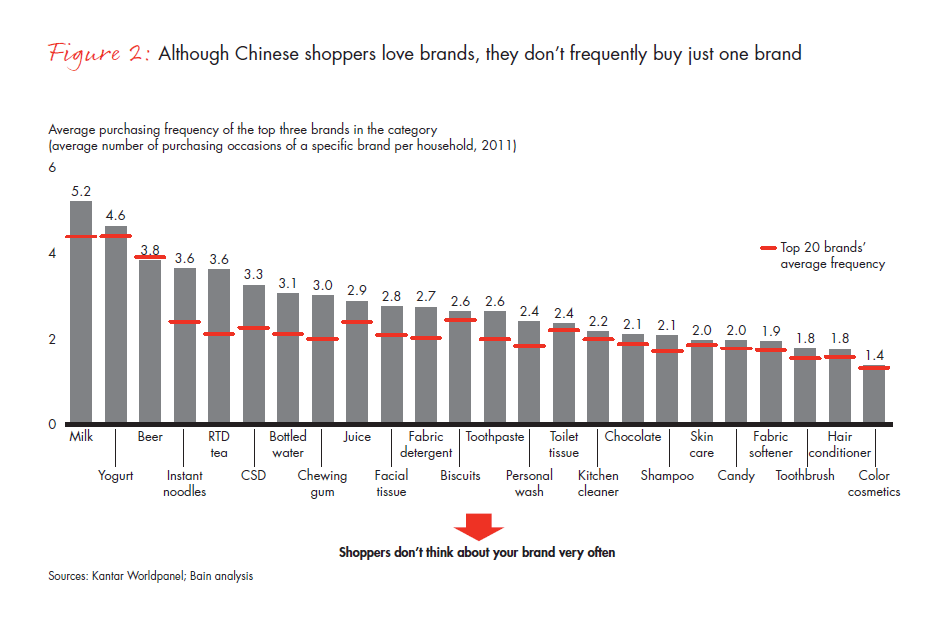 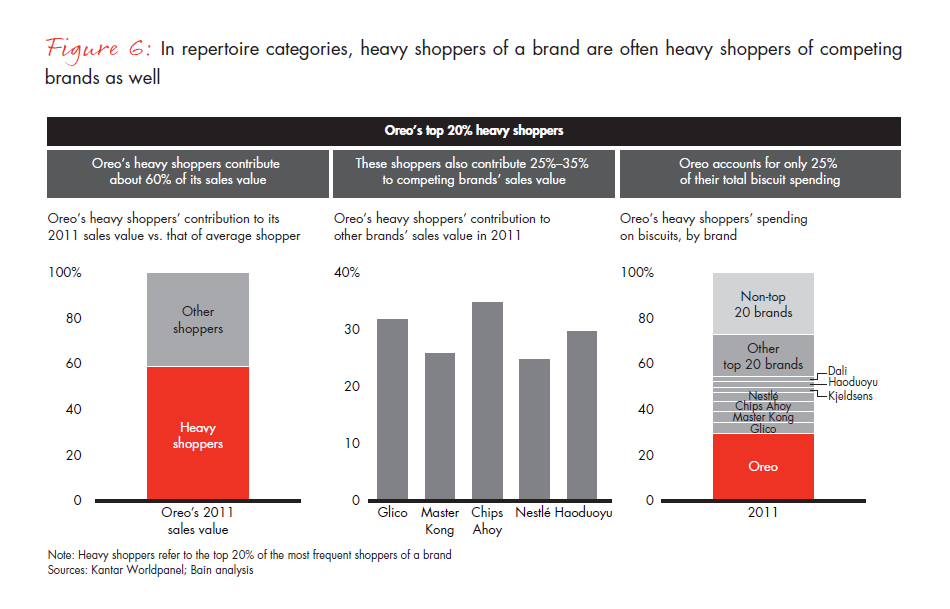 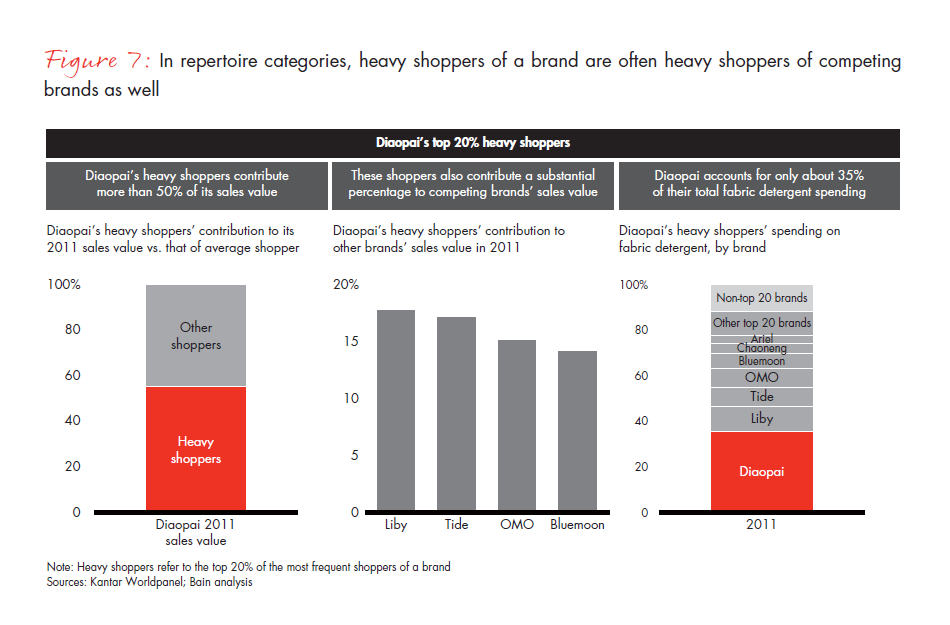 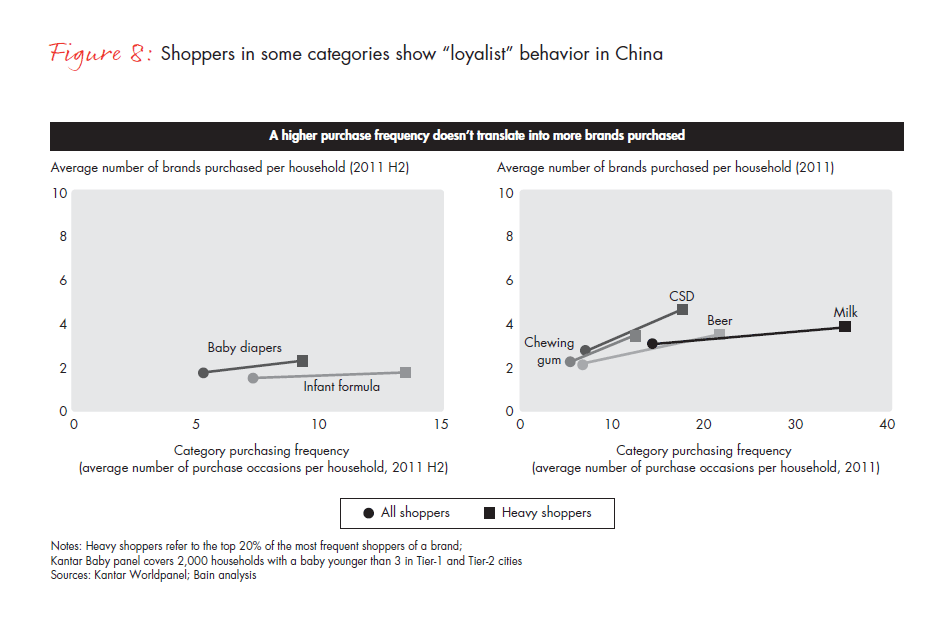 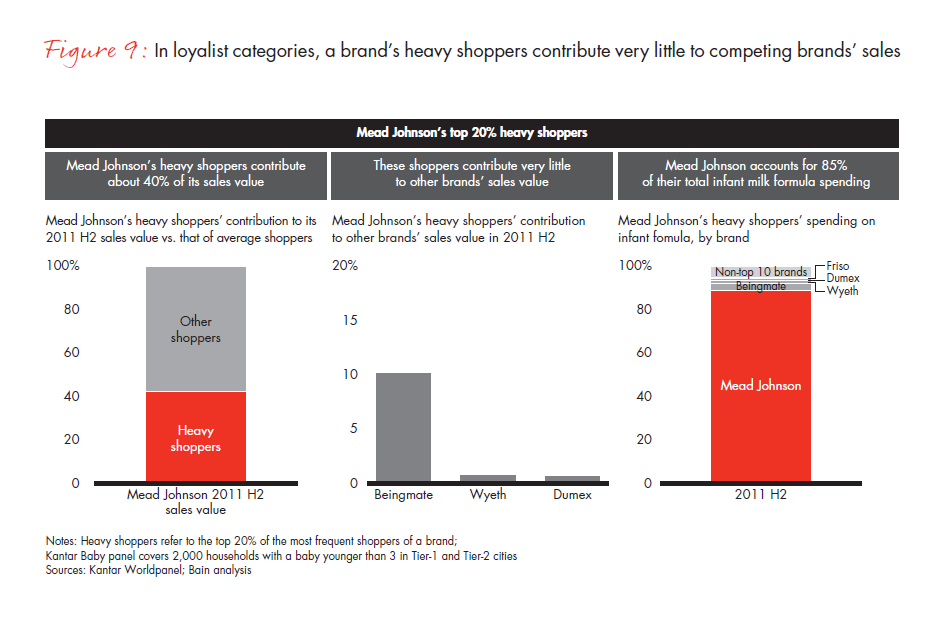 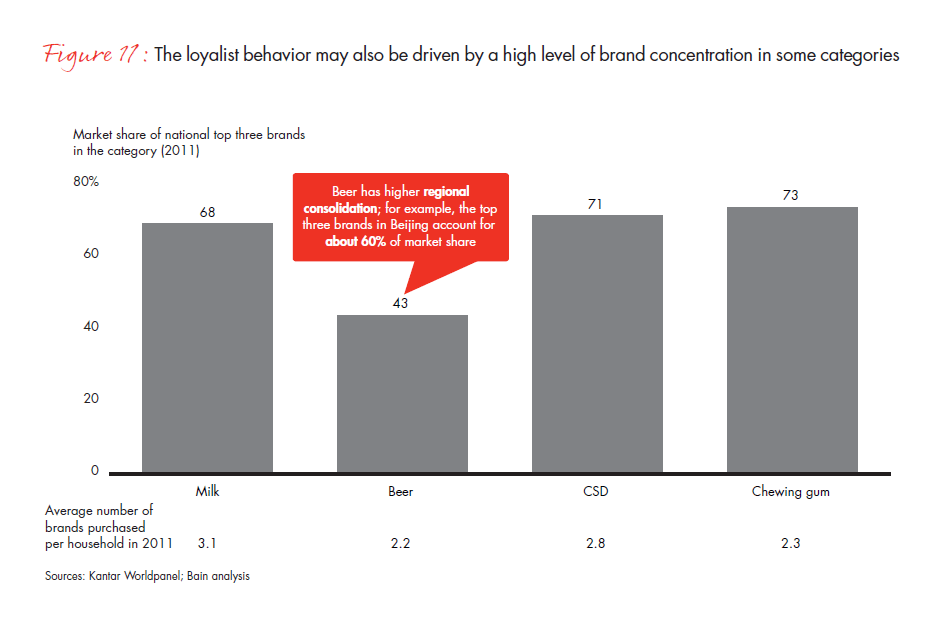 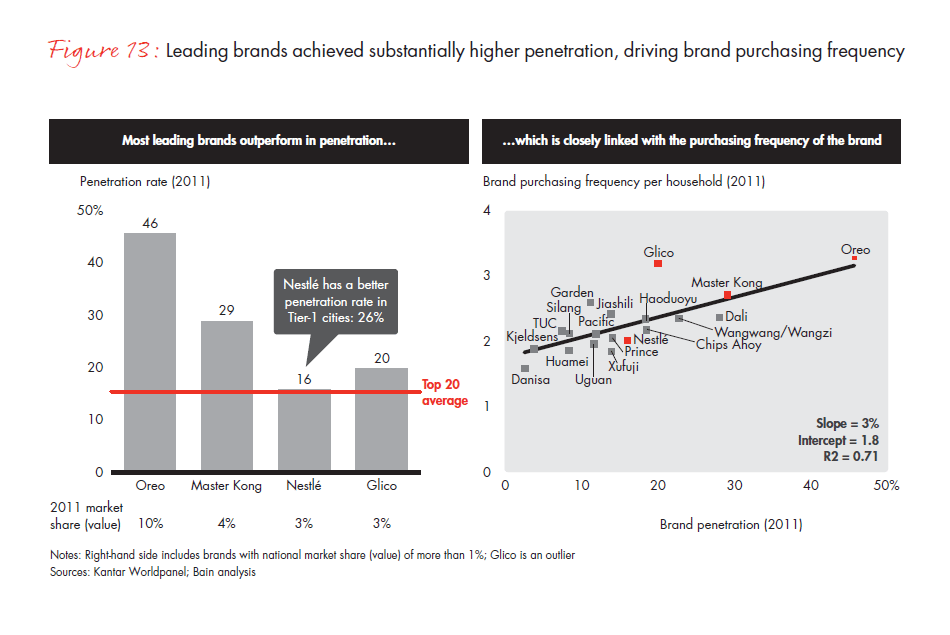 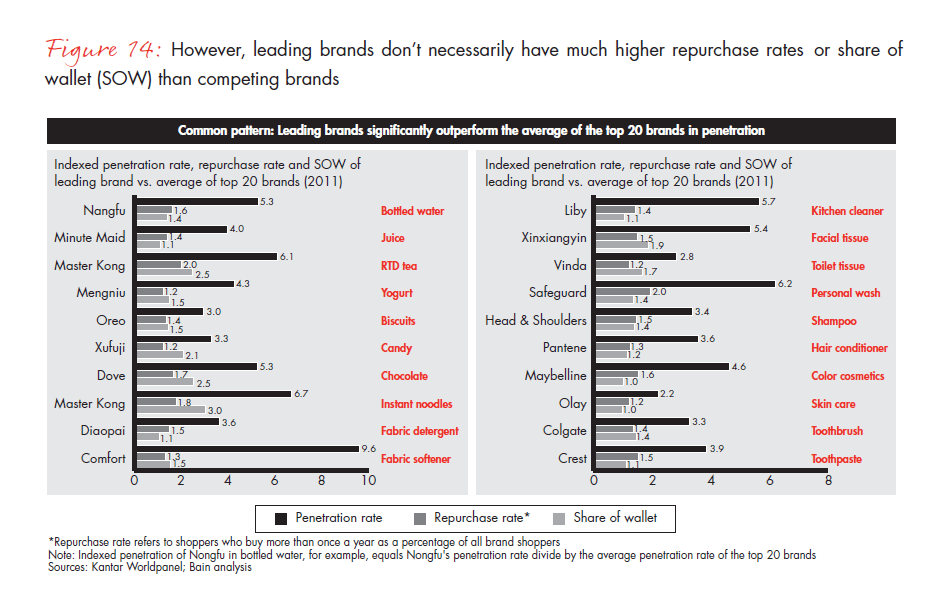 |