Brief

Executive Summary
- Students, parents, policymakers, and the media are shifting their focus from tuition, student debt, and institutional cost management to student outcomes.
- However, differences in student body mix and geographic location can mask which institutions excel at helping students graduate and earn high wages.
- Controlling for these factors reveals that some institutions are better than others at helping students graduate and earn high salaries early in their careers.
- All colleges and universities can implement proven interventions from top performers to improve student outcomes.
The US higher education system has historically inspired the world, generating groundbreaking innovation, expanding knowledge and creativity, and shaping leaders and critical thinkers who advance societal progress. For students, US colleges and universities have offered a path to a brighter future, enhanced social mobility, improved career opportunities, and broadened horizons.
Yet in recent years, the value of higher education has come into question. In a recent Wall Street Journal–NORC poll, 56% of US respondents expressed doubt that a four-year college education is worth the cost.
Underlying that skepticism is the fact that many students don’t achieve the anticipated outcomes. Recent studies show that 36% of students in four-year programs do not graduate even after six years, 40% earn less than a high school graduate after six years, and many graduate with unsustainable debt levels.
Student outcomes vary widely across institutions. But because colleges and universities serve different student populations, it can be challenging to understand which institutions are most successful at helping students graduate and earn high wages. Fortunately, new data sources and advanced analytics can help identify outperformers and offer insights into how to improve student outcomes.
Student outcomes vary by institution
Student outcomes vary widely across the roughly 2,600 four-year colleges and universities in the US (see Figure 1). For example, undergraduate graduation rates range from 20% to over 95%, and median future earnings range from $30,000 to over $100,000 per year in our sample. A strong correlation (r=0.74) exists between graduation rates and earnings across institutions. Other outcomes that are positively correlated with educational attainment (e.g., life satisfaction, social mobility, personal growth, and civic engagement) are also important though not analyzed in this study.
Figure 1
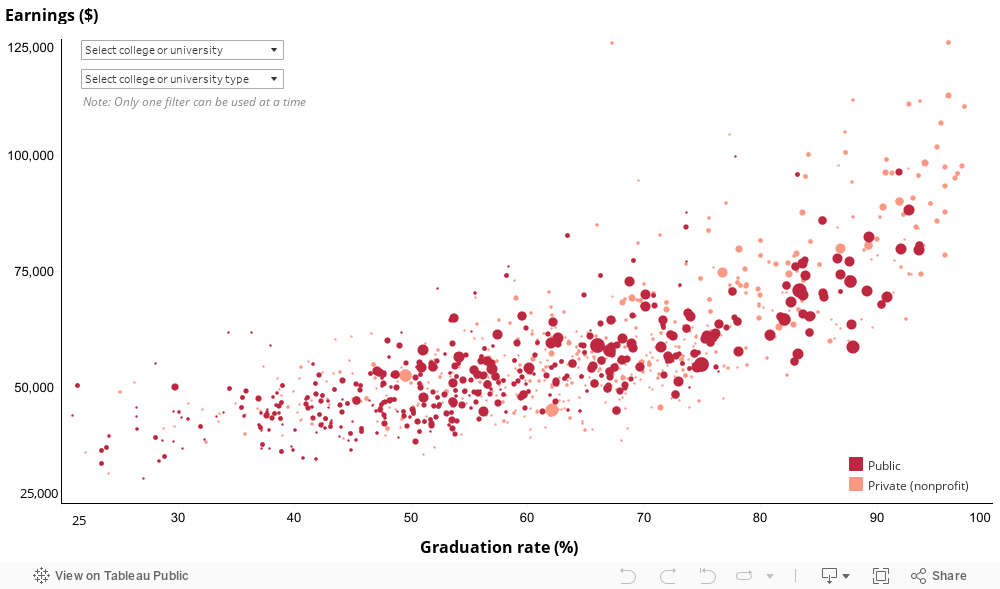
Notes: Graduation rate refers to first-time, full-time students graduating within six years; measured for the 2015–2016 academic year cohort. Earnings refer to the median annual earnings of students who received federal student aid and began college at the institution 10 years prior, regardless of their completion status; based on the pooled 2008–2009 and 2009–2010 academic cohorts; measured in 2019 and 2020, and inflation adjusted to 2021 dollars. Bubble size relates to undergraduate enrollment. The sample consists of 928 public and private nonprofit four-year colleges and universities with undergraduate enrollment of more than 1,000 students and availability of complete data.
Source: College Scorecard; Integrated Postsecondary Education Data System; Bain analysisDespite the wide variation in outcomes, it can be misleading to assume that colleges and universities with higher earnings or graduation rates are doing more than other institutions to help their students succeed. Why? A large body of research shows that the underlying readiness and background of incoming students as well as the local cost of living impacts these outcomes.
Some institutions, for instance, serve a higher proportion of students who have had fewer opportunities to prepare for college-level coursework. The graduation rates of these students may be lower than those of better-prepared peers. Other factors outside an institution’s direct influence that affect higher-education outcomes include a student’s family income, full- vs. part-time status, gender, race, age, and whether they are the first in their family to attend college.
Public and less selective private institutions, for example, tend to have a higher proportion of students receiving need-based Pell Grants. Since family income can be a powerful predictor of future outcomes, these institutions tend to have lower average graduation rates and student earnings (see Figure 2).
Figure 2

A predictive model
A better way to understand how well institutions serve their students is to control for student population and location factors when comparing outcomes.
To do this, Bain built a model to predict graduation rates and future earnings for more than 900 US public and private nonprofit four-year colleges (see Figure 3). Our model controls for student body characteristics, including family income and education history; academic preparation; full- or part-time status; racial, ethnic, and gender demographics; and the local cost-of-living index. Comparing each institution’s predicted outcomes to actual results gives us a starting point for understanding which institutions excel at helping students succeed compared to others serving a similar student population, even if factors like program mix affect these outcomes.
Figure 3
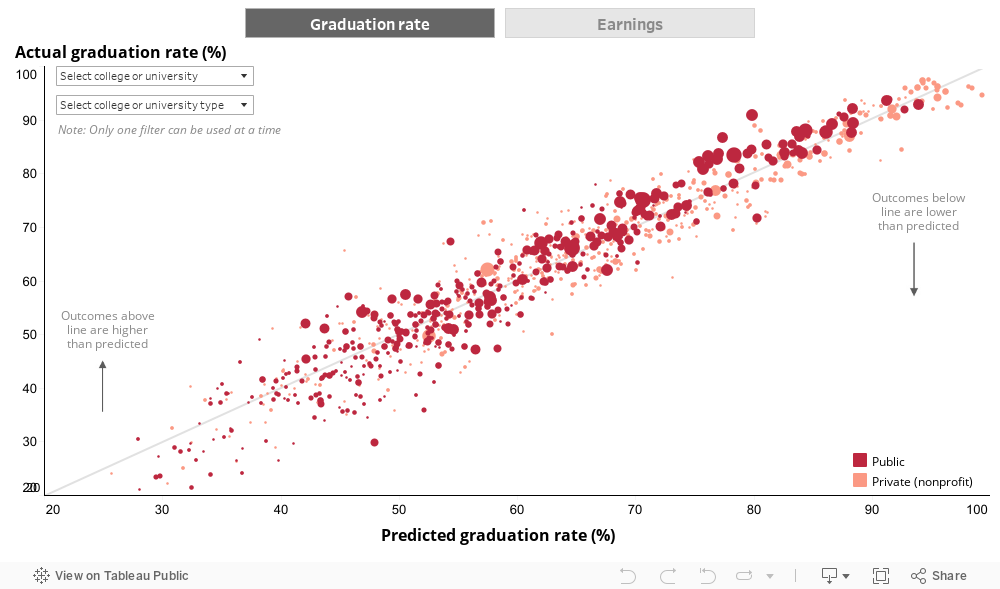
Notes: Graduation rate refers to first-time, full-time students graduating within six years; measured for the 2015–2016 academic year cohort. Earnings refer to the median annual earnings of students who received federal student aid and began college at the institution 10 years prior, regardless of their completion status; based on the pooled 2008–2009 and 2009–2010 academic cohorts; measured in 2019 and 2020 and inflation adjusted to 2021 dollars. Bubble size relates to undergraduate enrollment. The predicted graduation rate and predicted earnings are based on the authors’ calculations, controlling for student body characteristics, including family income and education history; academic preparation; full- or part-time status; racial, ethnic, and gender demographics; and local cost-of-living index. The sample consists of 928 public and private nonprofit four-year colleges and universities with undergraduate enrollment of more than 1,000 students and availability of complete data.
Source: College Scorecard; Integrated Postsecondary Education Data System; Bain analysisBain’s model reveals a strong relationship between actual and predicted outcomes, confirming that much of the variation across colleges and universities relates to the factors described above. Still, many institutions outperform expectations. Graduation rates for those in the 75th percentile are 5.4 percentage points higher than those in the 25th percentile with the same predicted graduation rate. Median annual earnings for institutions in the 75th percentile are at least $5,000 higher per year than those in the 25th percentile with the same predicted earnings.
For example, Florida International University has invested heavily to improve graduation rates. The university uses data science to identify students at risk of not graduating on time and alerts academic advisers so they can provide support. Such efforts have helped improve graduation rates from 43% in 2006 to 67% in 2022, now five percentage points higher than our model would predict for institutions serving a similar student body.
Another top performer in helping students graduate is Berea College, a small liberal arts college in Kentucky. Berea achieves a graduation rate of 66%, about 20 percentage points higher than predicted, while serving a student body where nearly 90% of individuals receive Pell Grants. Berea achieves these outcomes in part by eliminating some of the hurdles typically faced by its students. The college covers 100% of tuition expenses through its endowment and in-year donations and offers work opportunities for students throughout the entire period of study.
Interestingly, overperforming on graduation rates is no guarantee that an institution will overperform on student earnings, or vice versa. Some institutions overperform on one outcome but underperform on the other. Many universities prioritize improving graduation rates given their importance and visibility, but they could have even greater impact if they also prioritized initiatives that enhance their graduates’ future earnings, such as expanding experiential learning, partnerships with employers, and embedding career-oriented skills. Other institutions deliver high graduate earnings but may focus less on graduation rates.
Our analysis has important implications for leaders in higher education.
First, it’s difficult to exceed predictions on student outcomes. For graduation rates, only the top 10% of more than 900 institutions outperform their predicted graduation rate by more than 5 percentage points. For earnings, the top 10% of institutions have median annual earnings at least $4,600 higher than predicted.
Second, institutions that overperform represent a wide cross-section of US higher education, but a few noticeable trends emerge. For graduation rates, institutions in the top 10% of overperformers (in actual vs. predicted graduation rates) are evenly represented across institution types, but a disproportionate number of institutions in the bottom 10% are small or regional public institutions (categorized as “Other public” in the accompanying figures). For earnings, private institutions represent a disproportionate number of top performers.
Third, top-performing institutions prove that students from any background can succeed at high levels given the right support. That result contains a powerful message for leaders at all educational institutions, including in K–12 systems, to learn from what works and take action to improve student outcomes.
A roadmap for action
Every institution, regardless of its starting point, can improve students’ graduation rates and future earnings. Based on our research and experience working with more than 200 colleges and universities, leaders focus on four priorities to improve outcomes:
- Make student outcomes leadership’s top priority: Announce publicly that student outcomes are the top institutional priority, and shift time, attention, and resources accordingly. College and university leaders have many pressing concerns, and boosting student outcomes requires sustained, deliberate support from an institution’s board and senior leadership.
- Address systemic barriers to student success: Map the student journey from admission to graduation to tackle barriers preventing students from succeeding. These can include internal barriers such as complex course registration or degree requirements, and external barriers such as financial need, mental health challenges, and family obligations. Universities can also improve outcomes by helping students make informed decisions about their courses, majors, and career paths, as well as better understand financial aid application processes and requirements.
- Implement a strong career-connected learning strategy: Prepare students for successful careers and lives through a combination of classroom learning and real-world experiences. Partner with employers to determine the skills and experiences they value most, and then embed career-connected learning in the curriculum and academic journey of every major. Expand relevant, paid, work-based learning experiences like internships.
- Employ data to set targets and inform the approach: Use data to understand institution- and department-level student outcomes and set realistic but ambitious improvement targets. Strong data infrastructure can also be used to monitor student progress throughout the college journey, identify students at risk of falling off track, and pinpoint trends and interventions capable of helping more students flourish.
Many US institutions are already taking action to improve student outcomes. In 2011, the University of Texas at Austin set a goal of increasing four-year graduation rates from 51% to 70%. Shortly after that, the university implemented a student success program that provides peer mentoring, academic support, and enhanced scholarships to a significant number of incoming students. As of 2023, the university’s four-year graduation rate had increased to 74%, and six-year graduation rates had risen from 81% in 2013 to 88%. Student earnings 10 years after entering college also rose by more than $19,000 during this time, far outpacing the $11,500 median increase across all institutions in our sample.
Georgia State University has also become a national role model for improving graduation rates. Since 2003, Georgia State has increased graduation rates from 32% to 56%, while also increasing its percentage of students receiving Pell Grants by more than 20 percentage points and closing gaps in graduation rates among underrepresented students. While these results required a dedicated effort, a key lesson learned was the power of removing hidden institutional barriers to student success, such as complex processes related to financial aid, registration, and academic major selection.
Every institution’s journey to improving student outcomes will be different, depending on the students it serves. Colleges and universities that deliver relatively weaker results should use a data-driven approach to understand the root causes and then wield best practices to improve student performance. The institutions already helping students achieve at high levels can innovate further, proving that any student is capable of high levels of achievement with the right support.
The authors would like to recognize and thank Reed Abraham and Jackson Perry from Bain’s Advanced Analytics Group for their partnership and support in leading the analysis used in this brief.