Report

Note to Readers
Welcome to the eighth annual report on the global diamond industry prepared by the Antwerp World Diamond Centre (AWDC) and Bain & Company. This year’s edition covers industry developments in 2017 and the first half of 2018 and takes a close look at key industry trends.
Written in collaboration with
Written in collaboration with
![]()
We begin with important developments along the value chain. In subsequent sections, we review factors that influenced rough diamond production and sales, midstream performance and global diamond jewelry demand in major markets.
We also provide an update on the long-term outlook for the diamond industry through 2030. The 2030 supply-demand forecast considers announced production plans, recent changes in mining operations, potential additional sources of supply, expected changes in global and regional macroeconomic parameters, and potential effects of lab-grown diamonds.
Readers looking for a brief overview of this report can find key points below:
- Following a period of high volatility, 2017 was strong for the diamond industry, with approximately 2% growth across all segments of the value chain. In 2018, revenues are expected to grow again, even accelerating in the mining and jewelry retail segments. Volatility persisted in 2018; the final outcome for the year will be determined by sales performance during the holiday season.
- Rough diamond mining companies delivered unprecedented production growth of nearly 20% in volume in 2017. The production increase came mostly from mines with lower-quality assortments. Mining company revenues grew by 2% overall, indicating a positive trajectory for the second year in a row. In 2017, some major producers reported decreases in their EBIT margins, mostly due to currency appreciation in production countries. However, mining companies’ profitability bounced back in the first half of 2018.
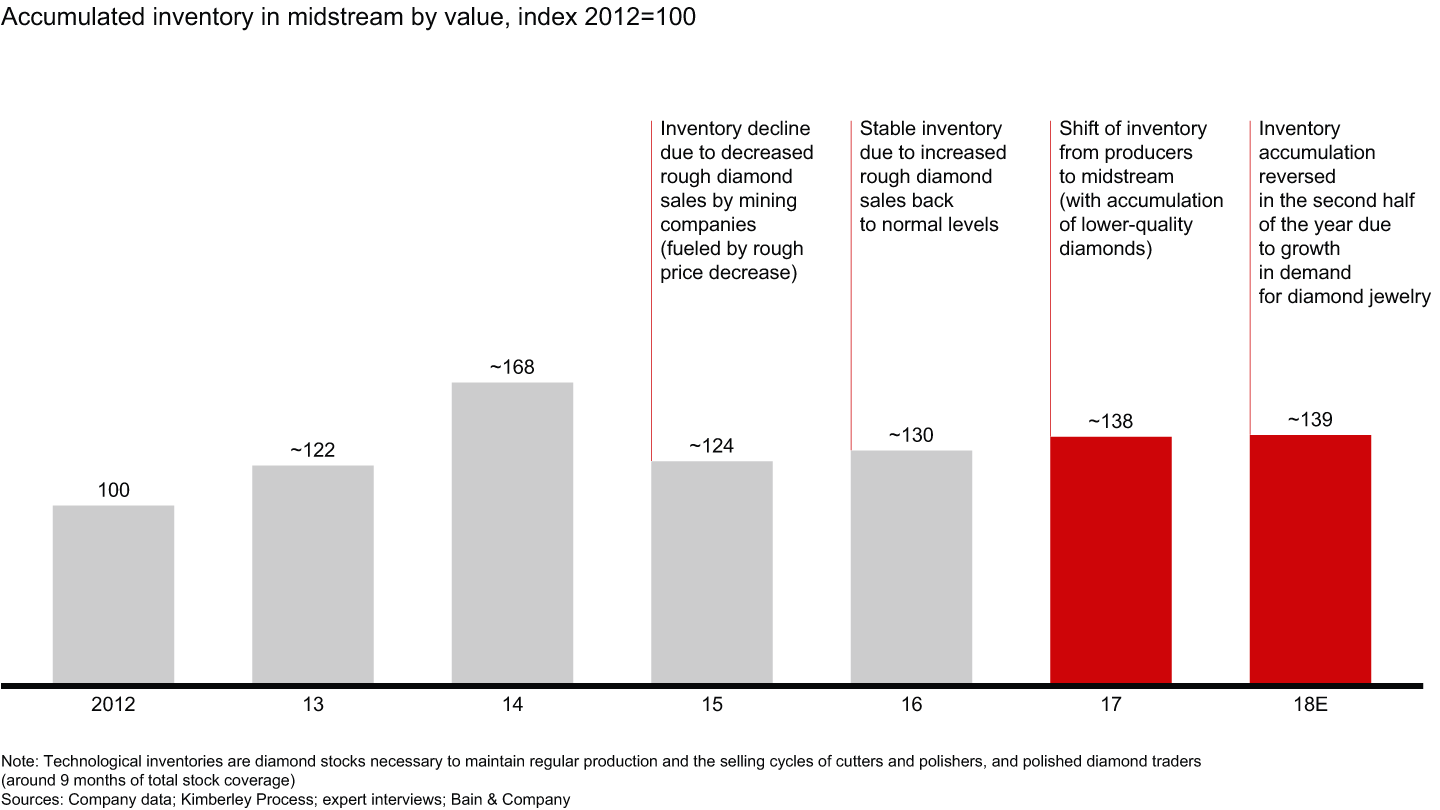
- Midstream profitability remained positive with margins of about 1% to 3%. Assuming the demand for diamond jewelry continues to rise through the end of 2018, overall profitability of the cutting and polishing segment is expected to improve. Midstream inventories increased in 2017–18, particularly in lower-quality and small-size assortments, as midstream players prepared to ride another demand surge for those categories in 2018. India continued to grow its leadership position in the cutting and polishing segment due to lower labor costs, a favorable regulatory environment and relatively better access to financing. Even though financing availability remains an issue in the midstream segment, transparent and financially healthy companies report little impact on their ability to secure funding.
- In line with positive luxury market trends, global diamond jewelry sales grew 2% in US dollar terms in 2017, fueled by strong macroeconomic fundamentals in the US, resurging demand from Chinese millennials, and increasing sales in the self-purchasing category in China. The demand for diamond jewelry is expected to accelerate in 2018. However, if the trade war between the US and China continues, it may have a negative effect on the growth prospects for global demand in the short to medium term.
- Three key industry trends are shaping the future of the diamond industry.
- One of the most important opportunities is the increasing influence of digital technologies. Emerging and maturing digital technologies are affecting all parts of the value chain, enabling diamond producers, midstream players and retailers to increase efficiencies within their operations. Marketing efforts that use digital technology can also deliver superior customer experiences.
- The second trend is the growing presence of lab-grown diamonds. Lab-grown diamonds are clearly here to stay. De Beers Groups’ launch of a lab-grown fashion jewelry retailer called Lightbox Jewelry, and the US Federal Trade Commission ruling on diamond terminology were major news in 2018. Lightbox does not provide grading reports for its products, as it states that grading reports exist as a record of a diamond’s rarity and, therefore, its value—with products that can be mass-produced to a particular recipe, Lightbox notes that grading reports could confuse consumers about the value of their lab-grown stones. The effects on natural diamond demand and price will depend on consumers’ perceptions and preferences. If the natural diamond industry can differentiate its stones from lab-grown diamonds (perhaps positioning lab-grown diamonds as fashion jewelry rather than luxury items), the effect on natural diamond demand by 2030 will be limited up to 5% to 10% in value terms. Given the pace of declining production costs and wholesale and retail prices, we expect lab-grown stones to become accessible to a wider consumer audience, potentially increasing demand for diamonds in general. In the short to medium term, growth of lab-grown diamonds will be limited by manufacturing capacity, access to technology and intellectual property, and availability of funding.
- The third key trend is the shifting preferences of younger generations of consumers. Younger generations of consumers are causing industry players to rethink their sales and marketing strategies. The self-purchase product category continues to grow as millennial and Generation Z’s female spending power increases. Younger generations are also more inclined to consider the opinions of social influencers, customer reviews and “likes” when making purchasing decisions. Social media shopping is expected to increase significantly as the spending power of Gen Z rises. Many retailers are already strategizing how the shifts in preferences will change their approaches to marketing and operations.
- The long-term outlook for the diamond market remains positive. Rough diamond supply is projected to be negative 1% to 1% annually in volume terms. We expect demand for natural rough diamonds to stay flat or grow up to 2% annually through 2030 in real terms (2% to 4% in nominal), backed by strong fundamentals in the US and the continued growth of the middle class in China and India. Our outlook incorporates possible demand substitution from lab-grown diamonds, which is estimated to be 5% to 10%. It also reflects fundamental long-term supply and demand factors rather than short-term fluctuations.
Bain Partner Olya Linde explains the impact of three key trends on the global diamond industry.

1. Recent developments in the diamond industry
- Every segment of the value chain improved in 2017, with industry revenue growing around 2%. In 2018, we expect revenues to continue to trend upward, and project accelerated growth in the mining and jewelry segments.
- Revenue for rough diamonds increased, continuing a climb that started in 2016. Revenue growth for rough diamonds is largely attributed to increased production by smaller players. The top five mining company aggregates faced unfavorable exchange rates in 2017, which contributed to lower profit margins of about 5%.
- Cutting and polishing revenues increased slightly in 2017 due to healthy demand, marking a turnaround from prior years. Average profitability was stable at 1% to 3%, with the most efficient players delivering margins of around 10%. We expect cutting and polishing profitability to improve in 2018, supported by rising prices for polished diamonds and increased demand for diamond jewelry.
- Midstream inventory has increased in anticipation of higher demand, particularly in lower-quality and smaller-sized assortments.
- Global retail sales of diamond jewelry increased in 2017 due to a strong economy in the US, the world’s largest diamond jewelry market. A resurgence of luxury spending among Chinese millennials also contributed to the increase.
- De Beers Group launched Lightbox Jewelry, a lab-grown fashion jewelry retailer with a new linear pricing model and no grading reports for its products, in September 2018. Along the value chain, companies are evaluating how to strategically respond.
- Performance across the value chain was strong during the first half of 2018, with accelerated growth expected among mining companies and jewelry retailers. The final outcome for the year hinges on holiday sales in December.
Figure 1
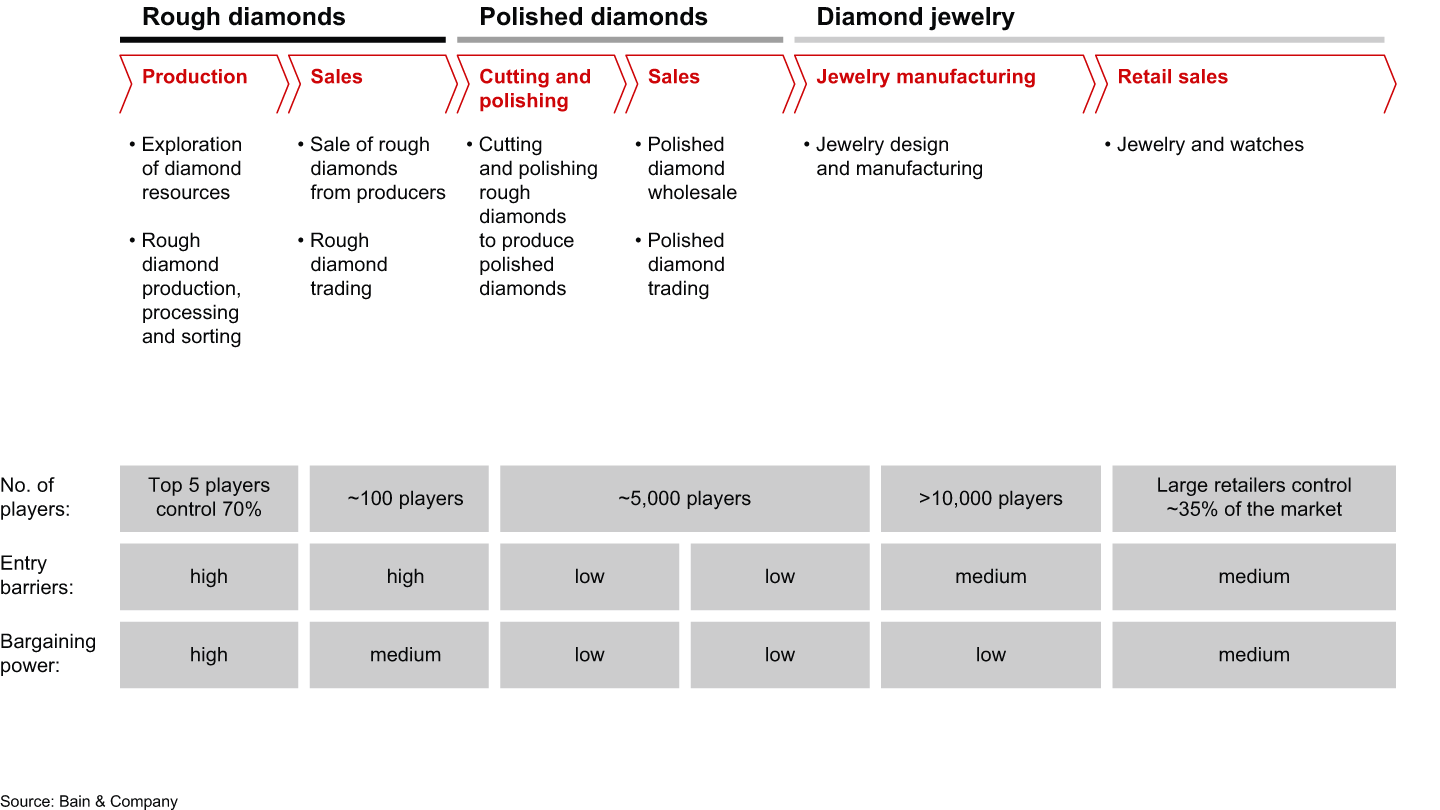

Figure 2
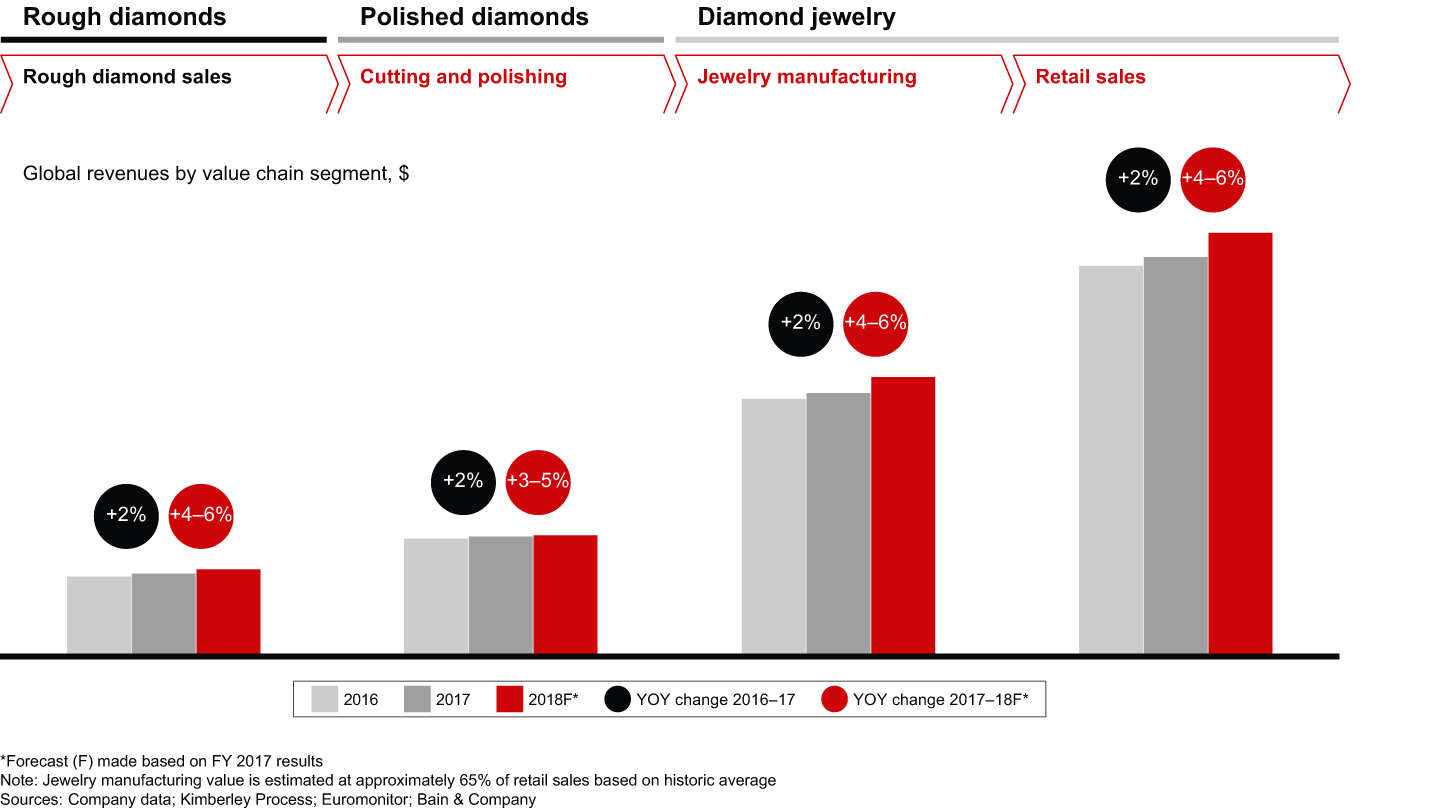

Figure 3
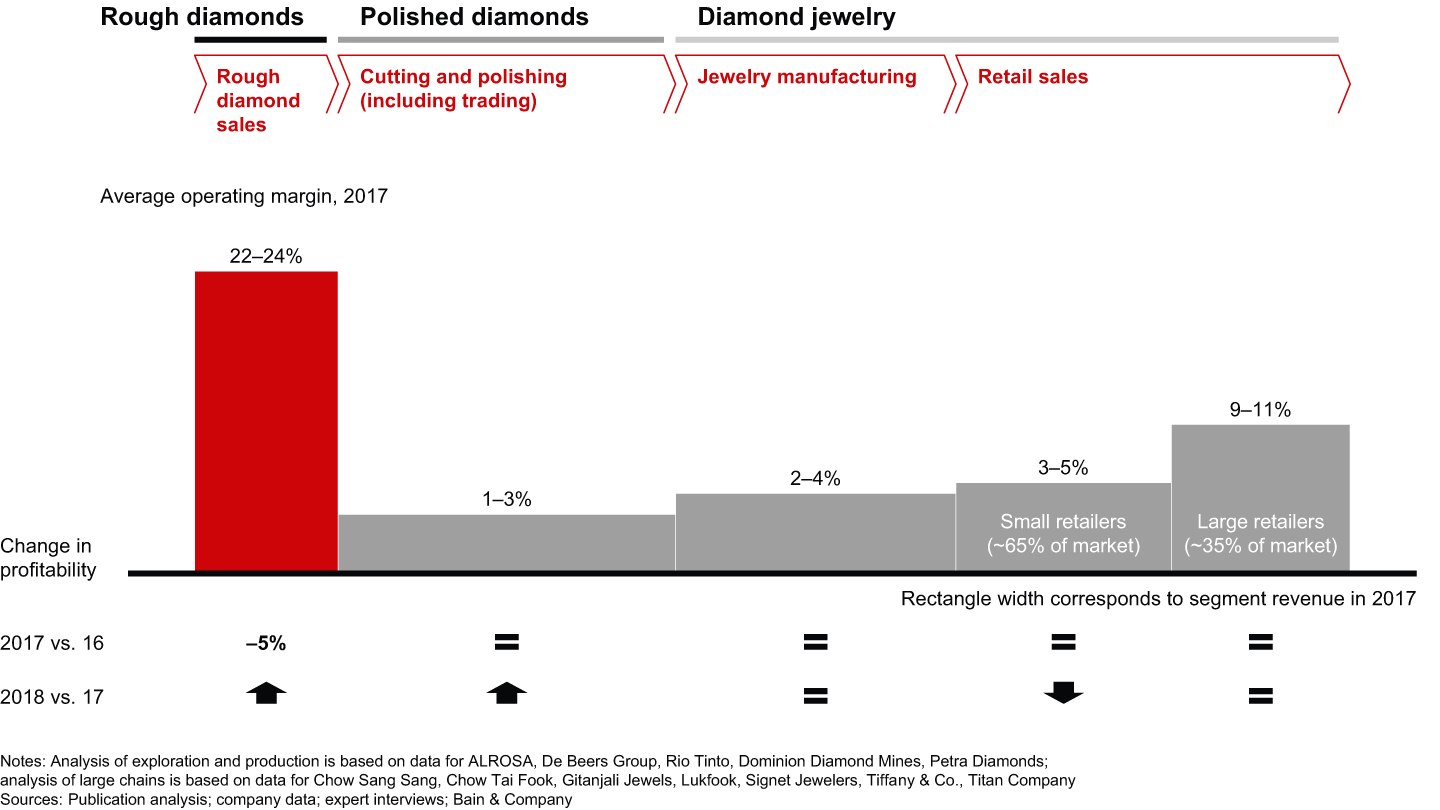

Figure 4
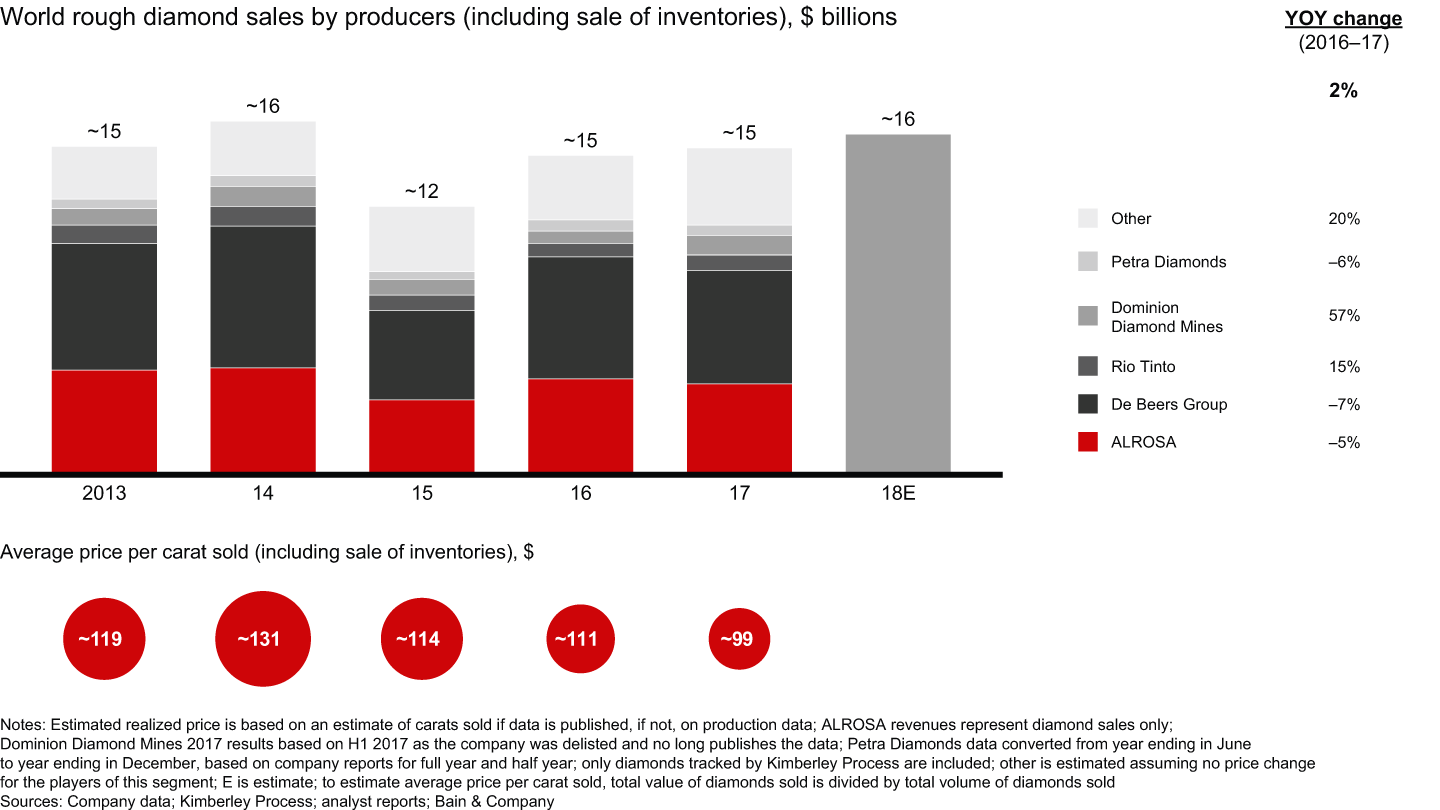

Figure 5
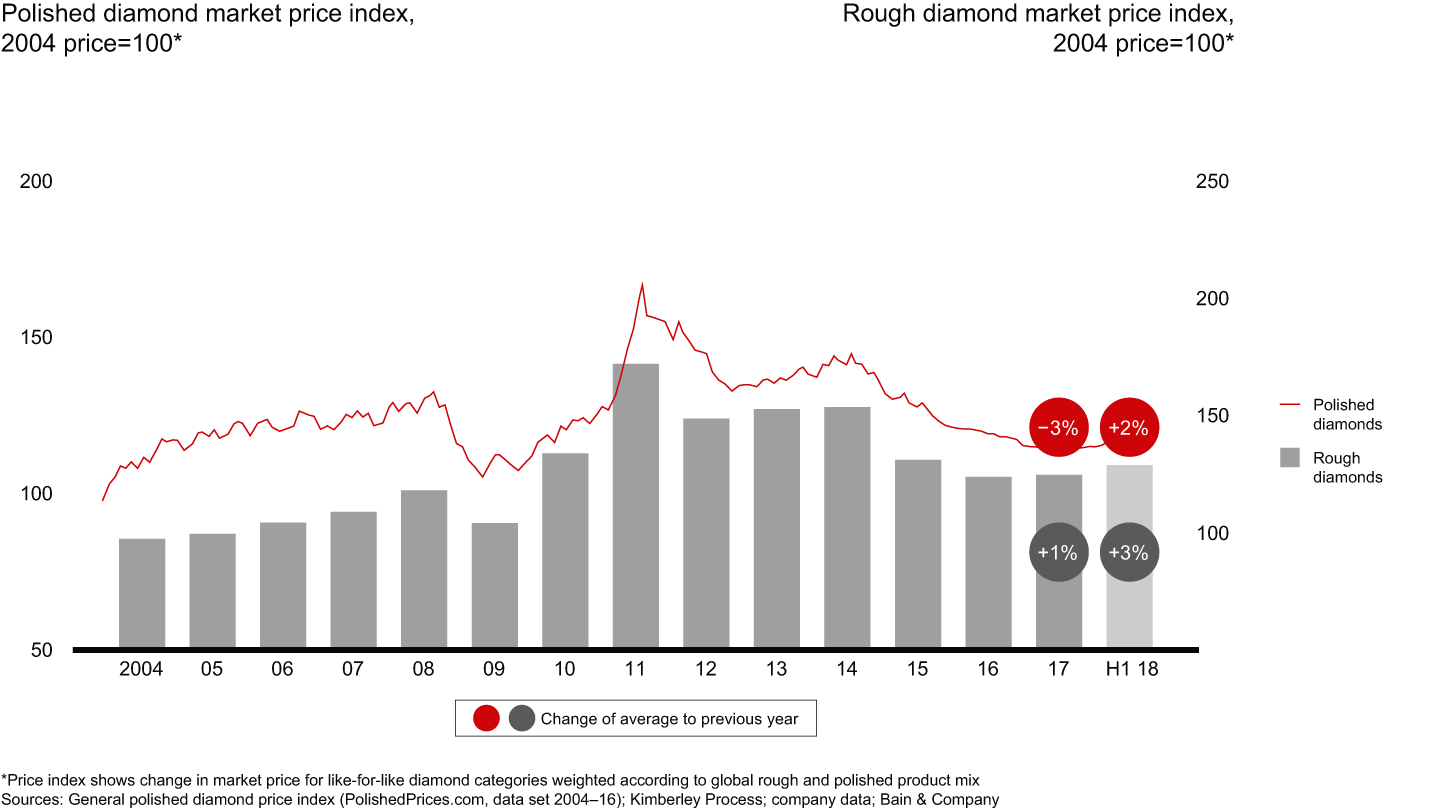

Figure 6

2. Rough diamond production
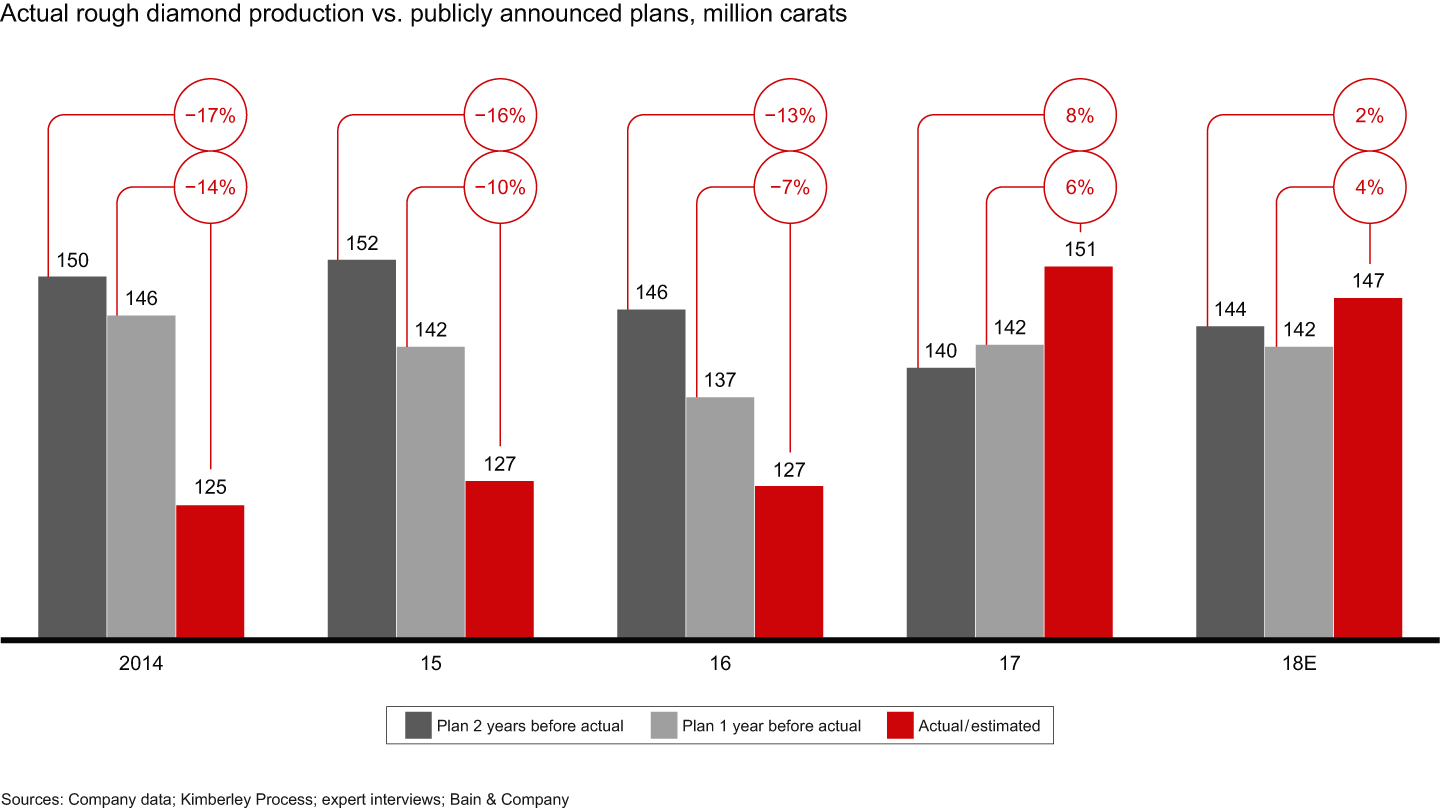
- All of the top mining companies increased production in 2017, leading to an unprecedented 19% growth in rough diamond production; volume reached 151 million carats in 2017, breaking an eight-year trend of flat output. However, the increase was largely attributed to the processing of lower-quality supplies and tailings, diminishing the effect on revenues.
- Canada, the Democratic Republic of the Congo, Australia, Botswana and Russia accounted for 90% of the output increase in 2017. Canada led the way, with the largest production increases coming from commercial mining efforts in Gahcho Kué and Renard, both of which started production in 2016 and early 2017.
- We believe that 2017 was the pinnacle production level for the natural diamond supply. From here on, output is expected to remain stable at best. Miners’ plans and actual production volumes in the first half of 2018 suggest production may even decline in the near future.
- The most significant decreases are expected from Mirny in Russia and Voorspoed in South Africa, resulting from their closure; Jubilee in Australia from lower-grade mining; and Argyle, also in Australia, because of depleted reserves in its block cave. Meaningful increases are expected from Orapa and Jwaneng in Botswana.
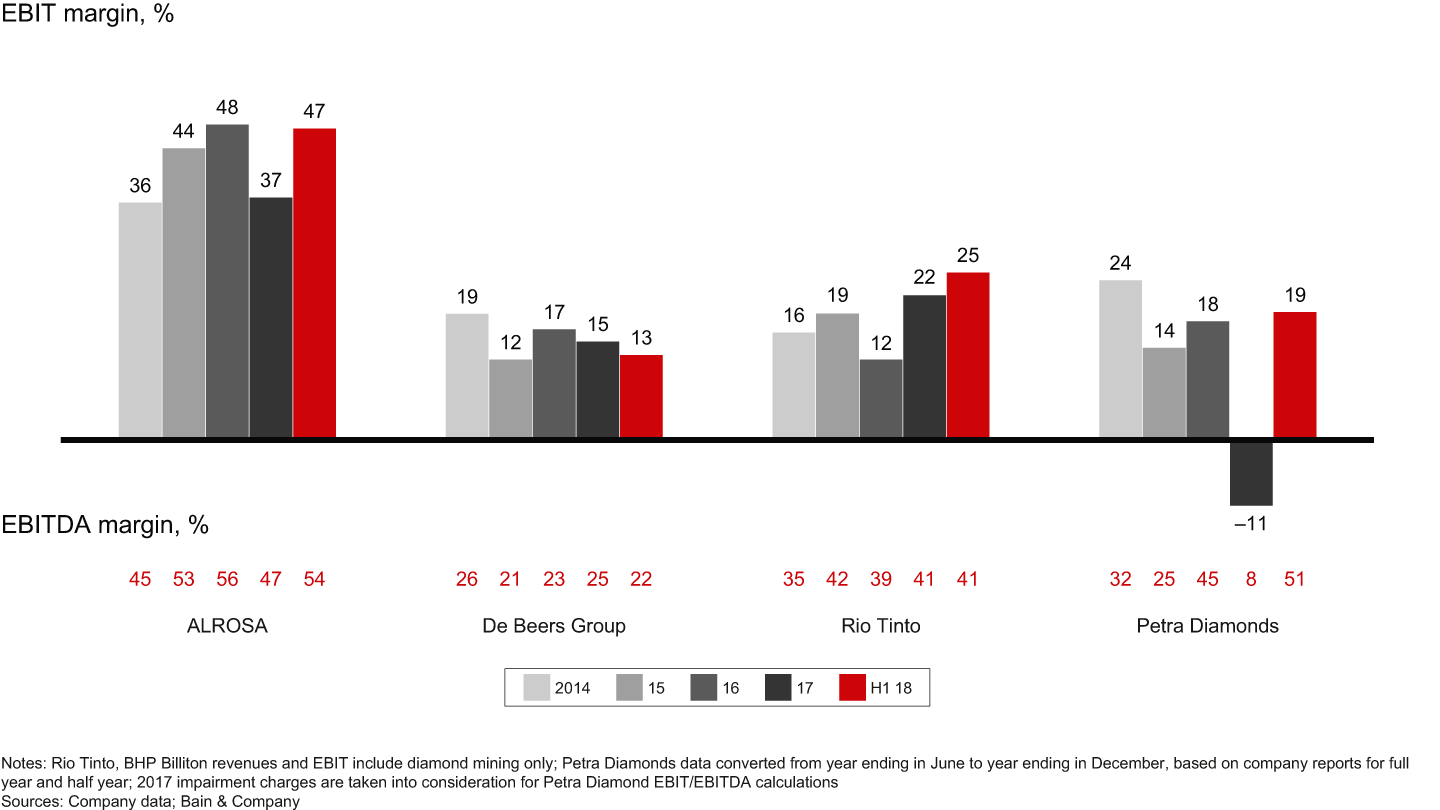
- Currency adjustments in production countries lowered the EBIT margins (earnings before interest and taxes) for De Beers Group and ALROSA in 2017. ALROSA returned to positive in the first half of 2018 and maintains the highest margin in the segment, attributable to rises in rough diamond prices, currency devaluation and strong cost containment. Petra reported negative EBIT margin in 2017 but rebounded in 2018.
- Merger and acquisition activity was focused on the mining segment, with key industry players investing in mining resources and operations. De Beers Group purchased Chidliak, a diamond resource in Canada; ALROSA increased its shares in Catoca from 33% to 41%.
Figure 7
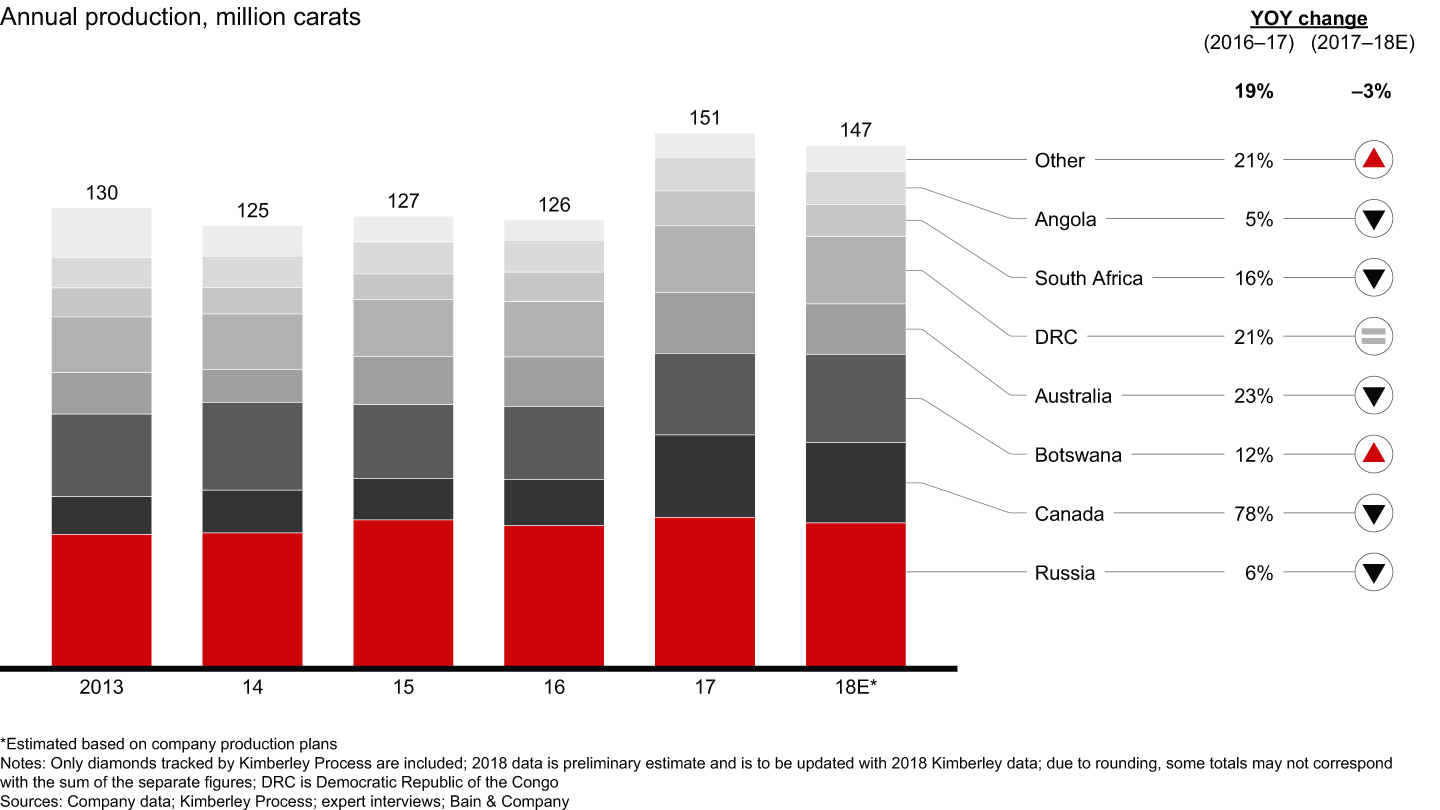

Figure 8
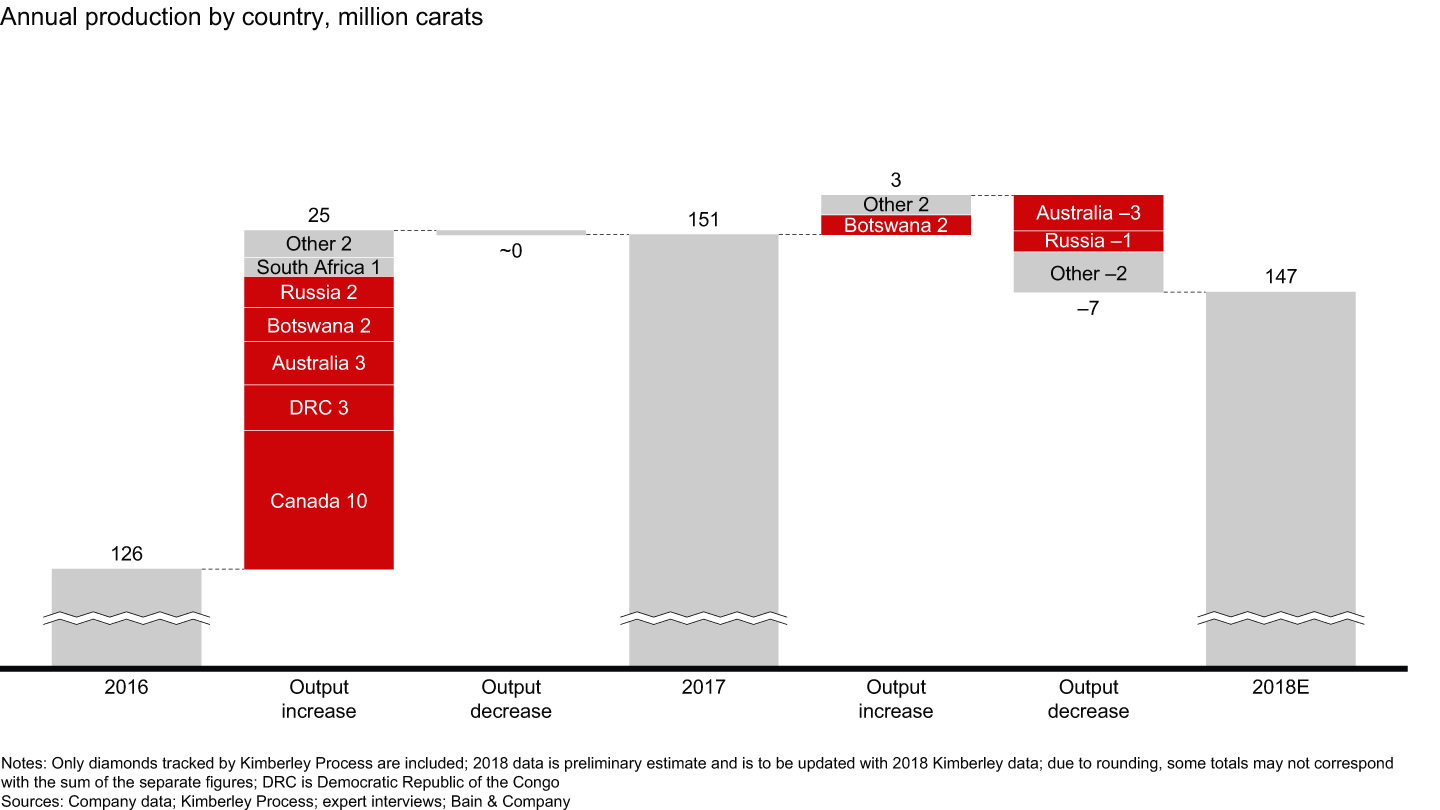

Figure 9
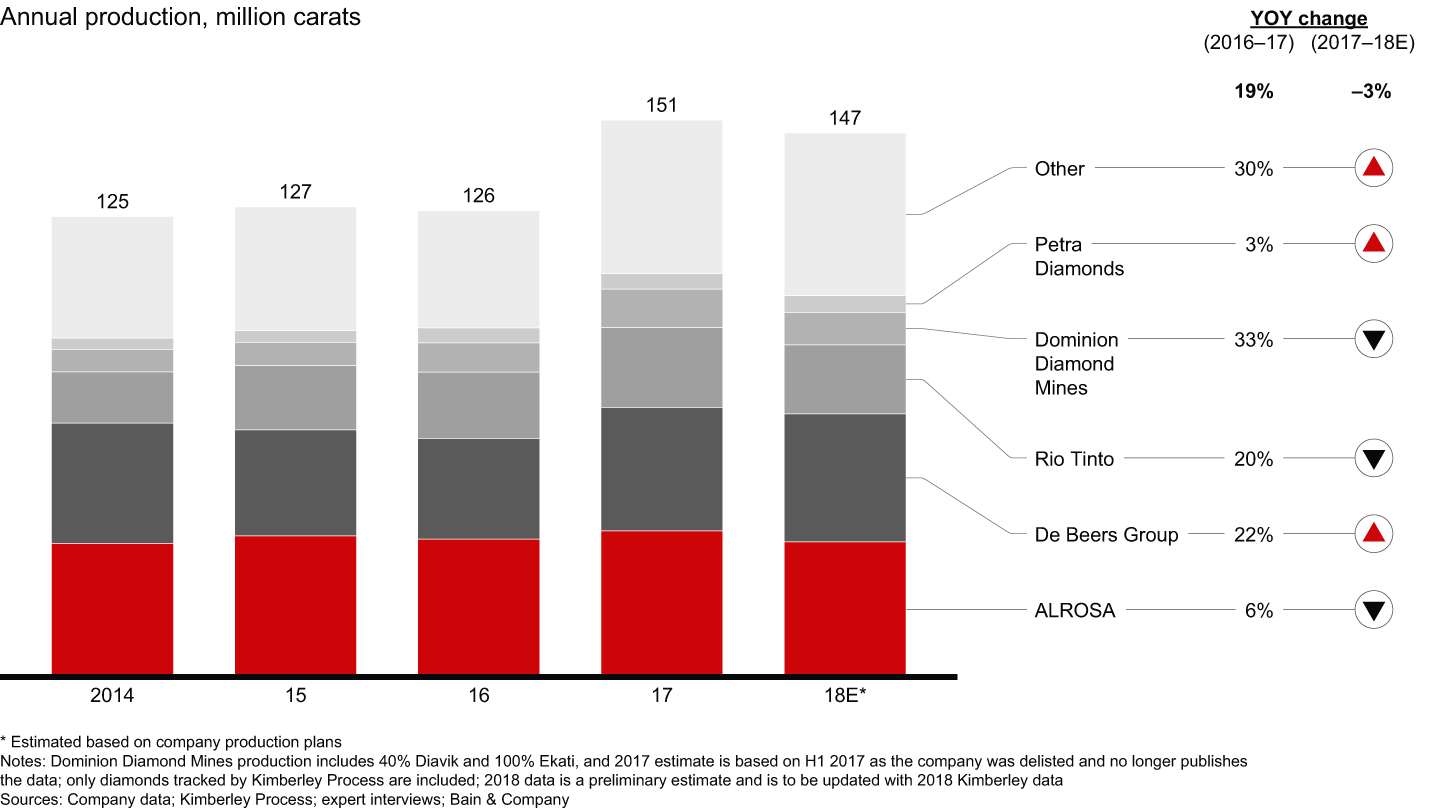

Figure 10

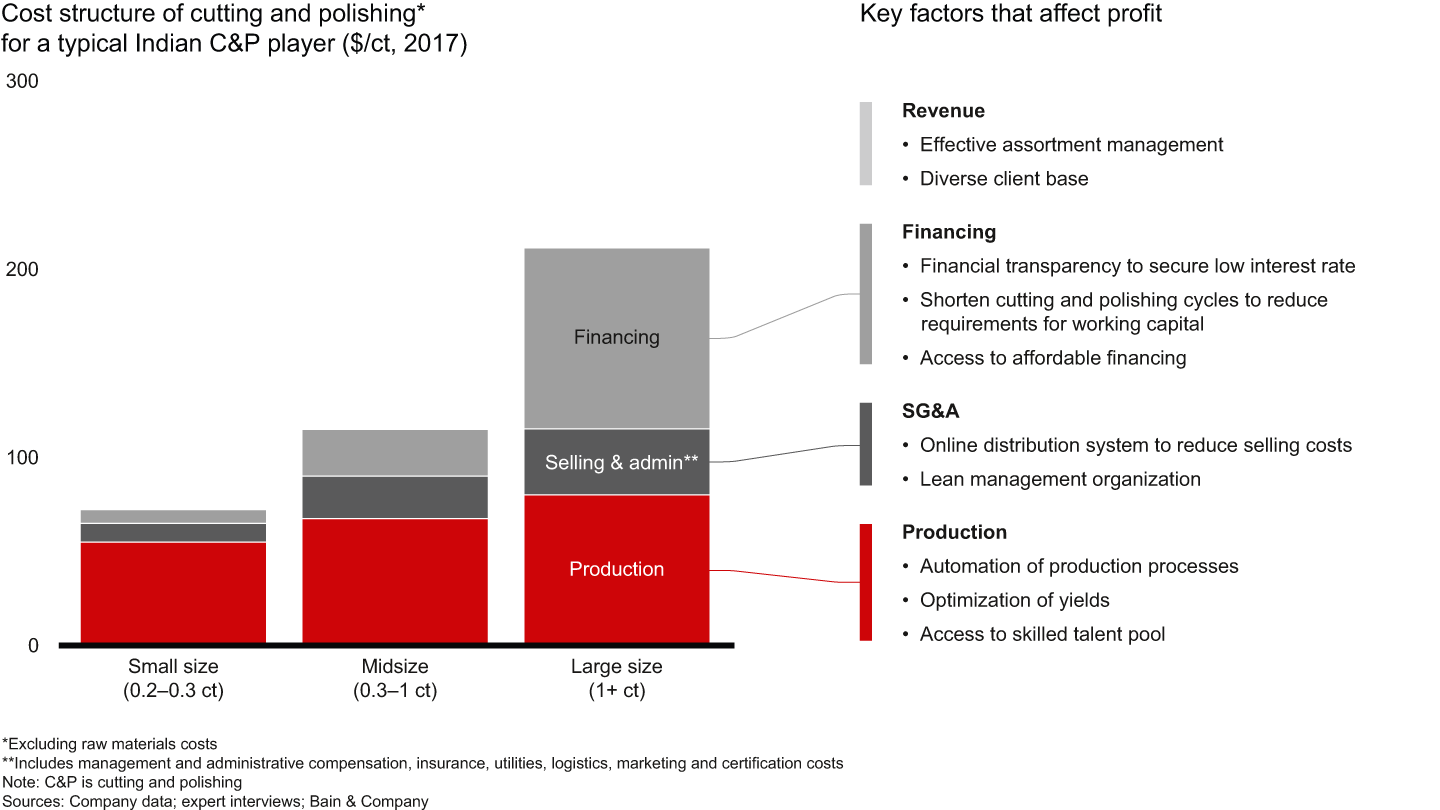
3. Cutting and polishing
- Healthy growth in the diamond jewelry retail market supported a 2% increase in cutting and polishing revenue, putting the segment on positive ground in 2017.
- While the cutting and polishing segment grew overall, profit gains in 2017 were mostly limited to producers of small stones. Companies that specialize in large, high-quality stones experienced pressure from retailers in 2017. That trend reversed in the first part of 2018. To sustain profitability, cutting and polishing companies are focusing on four strategies: managing inventory levels, shortening production cycles, optimizing yields and expanding operations. Technology is leading improvements in the cutting and polishing segment, from digitally mapping and modeling stones to automating cutting processes.
- Because of its low labor costs, favorable regulatory environment and relatively easier access to financing, India continued to gain market share in 2017. India’s growth came primarily at the expense of China and other countries. India accounts for more than 90% of global polished diamond manufacturing by value, and it dominates in all size segments, including the value-add segment of larger stones.
- In China, cutting and polishing revenue increased in 2017, backed by strong domestic jewelry demand.
- Access to affordable financing continues to be an issue for some midstream players. Following several defaults in India, some banks have tightened credit requirements. However, transparent and financially healthy players in the cutting and polishing segment reported only limited influence on their ability to secure funding.
Figure 11
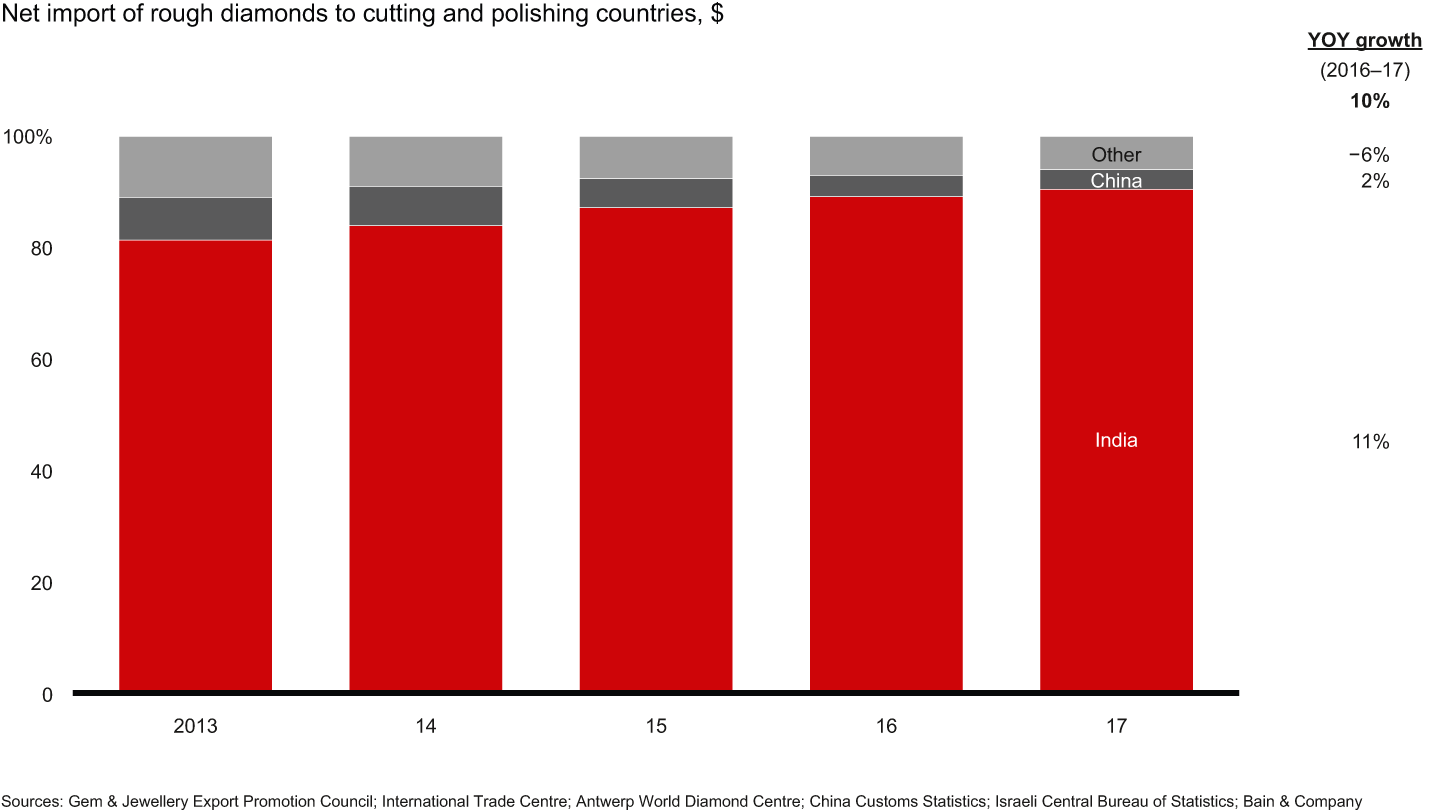

Figure 12
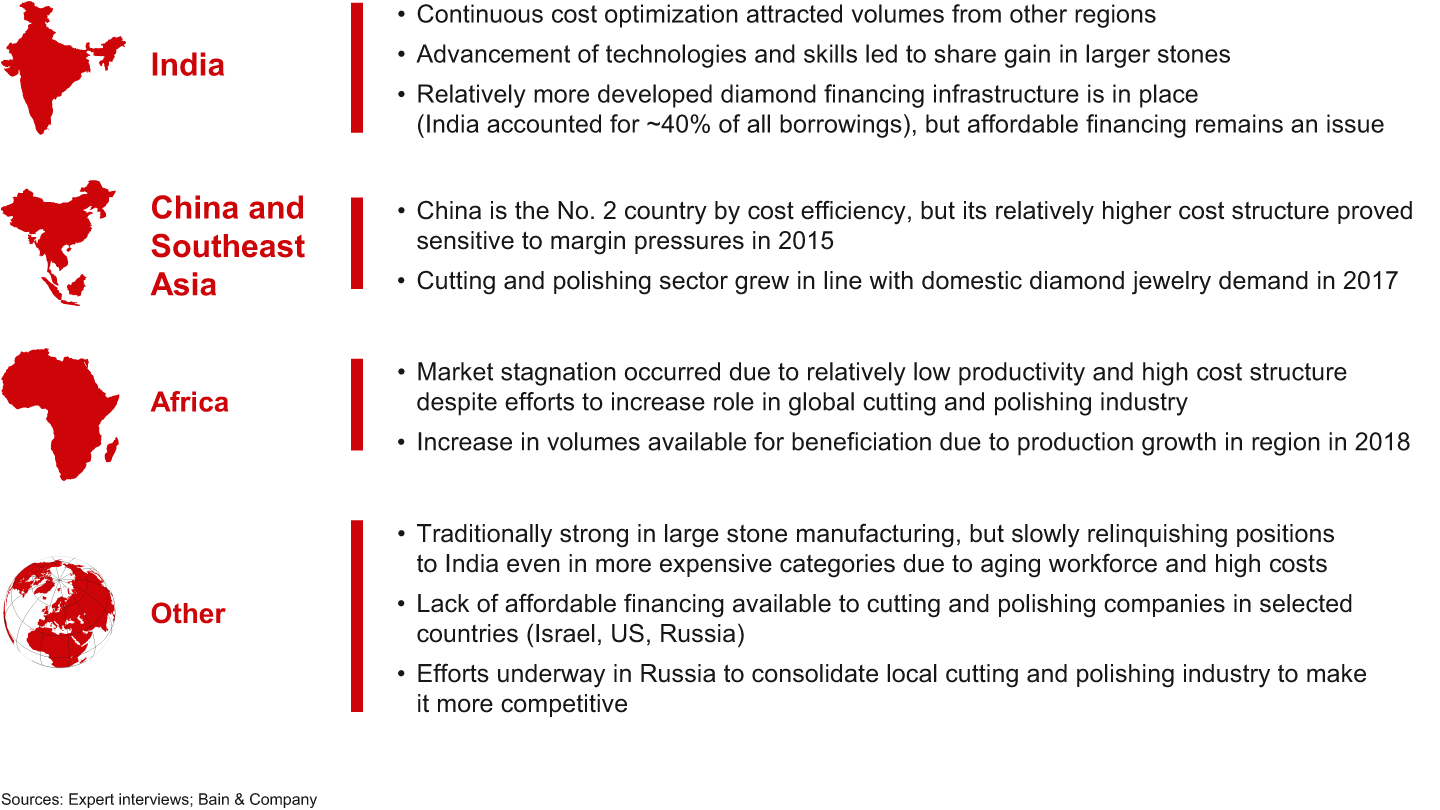

Figure 13

4. Diamond jewelry retail
- The luxury category has been stable compared with global GDP for the past five years, marking a resilience to generational shifts. The luxury segment has adapted to changing consumer preferences and behavior. Keeping in line with luxury market trends, global diamond jewelry sales grew 2% in US dollar terms in 2017. Demand for diamond jewelry is expected to continue or even accelerate in 2018, steered by high demand from affluent consumers.
- An increase in retail diamond jewelry sales is attributed to a strong economy and favorable macroeconomics in the US, namely growing consumer credit, shrinking unemployment and higher wages.
- Demand in China grew for the first time since 2013, picking up momentum from millennial buyers. Favorable adjustments to tax and customs policies should support continued Chinese growth. The online channel is expected to bring additional diamond jewelry sales to regions in China with limited physical retail footprint.
- As in years past, India had the highest potential for diamond jewelry retail growth, yet its revenues remained flat. Despite inflation and a weaker rupee in the first half of 2018, personal disposable income is expected to grow in India and provide basis for increase in demand.
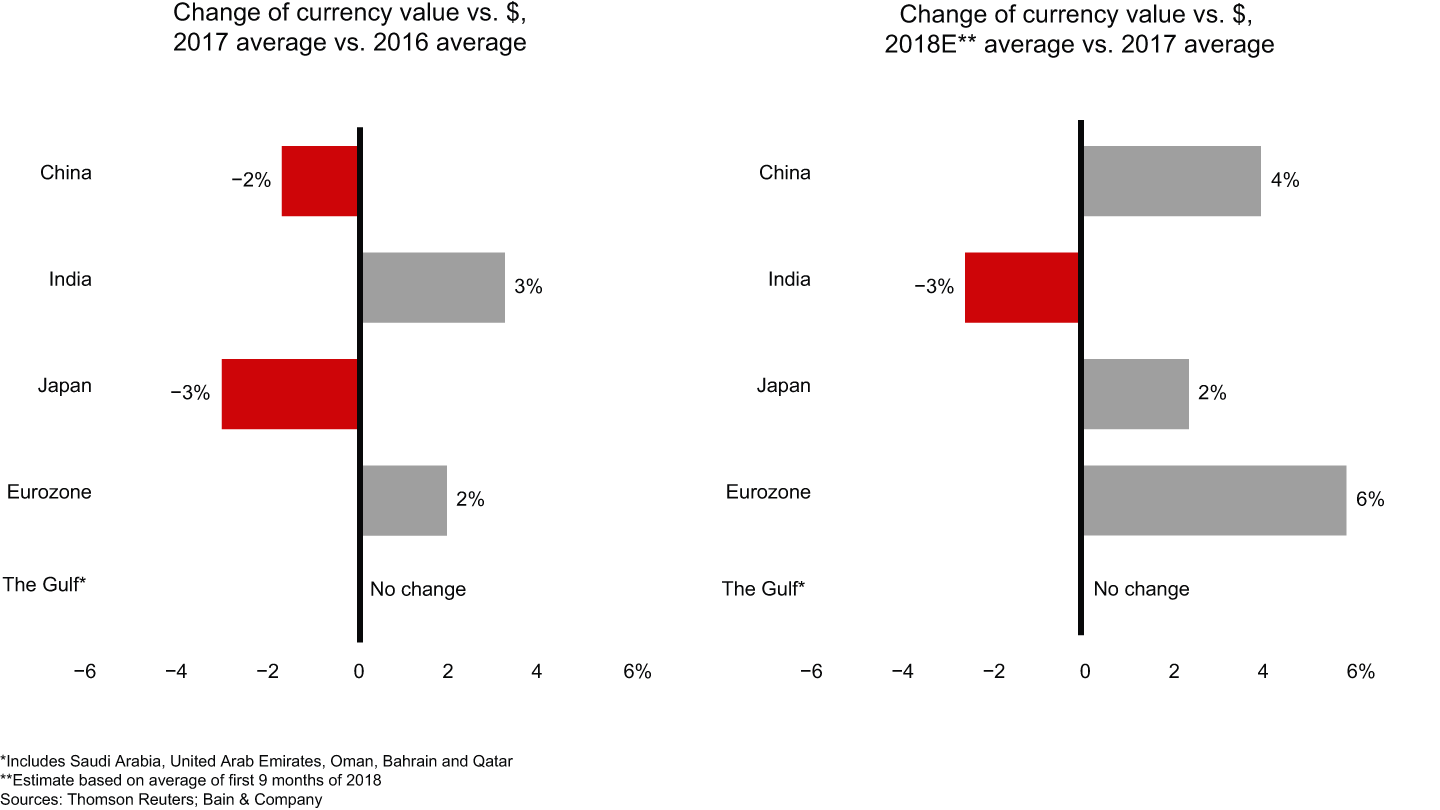
- In 2017, performance was tempered in Europe by lower consumer confidence and in Japan by weak economic fundamentals. Both are positioned to rebound in 2018, thanks to higher tourism volume and euro appreciation in Europe and decreased unemployment in Japan.
- If the US and China continue to dispute trade terms, economic growth prospects in both countries could be negatively affected, or consumer confidence could dwindle. While nothing detrimental has materialized, the potential outcomes of an ongoing trade war should be considered.
Figure 14
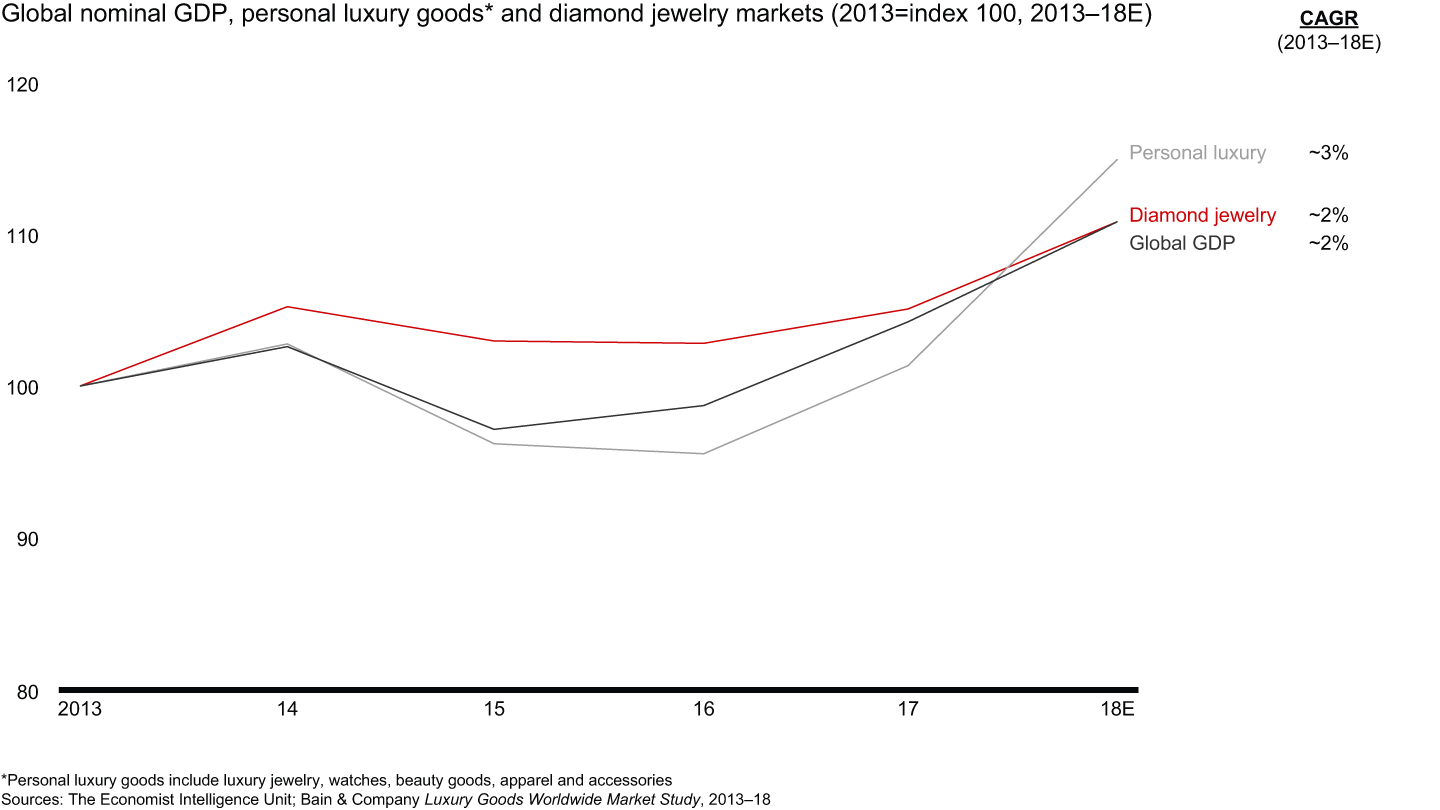

Figure 15
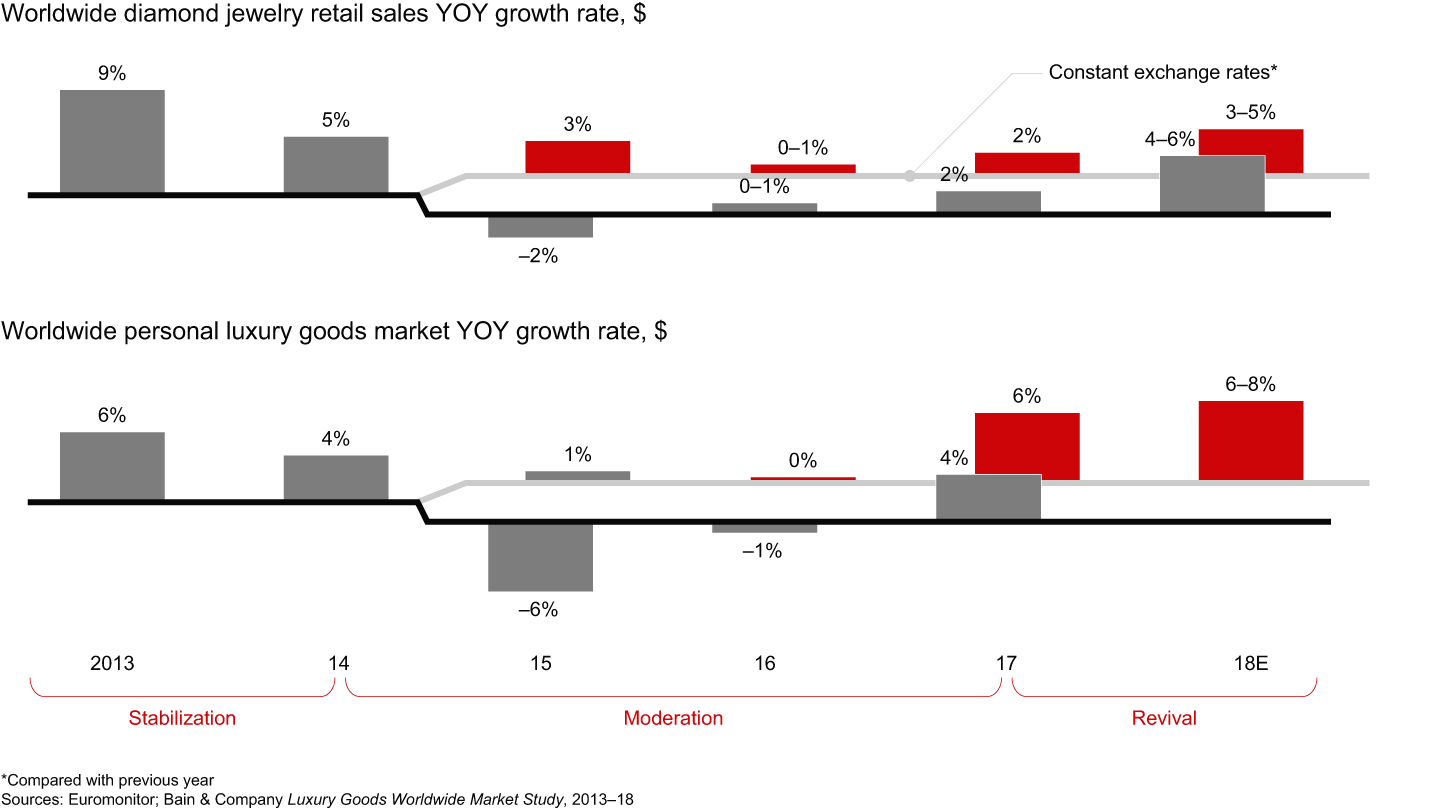

Figure 16
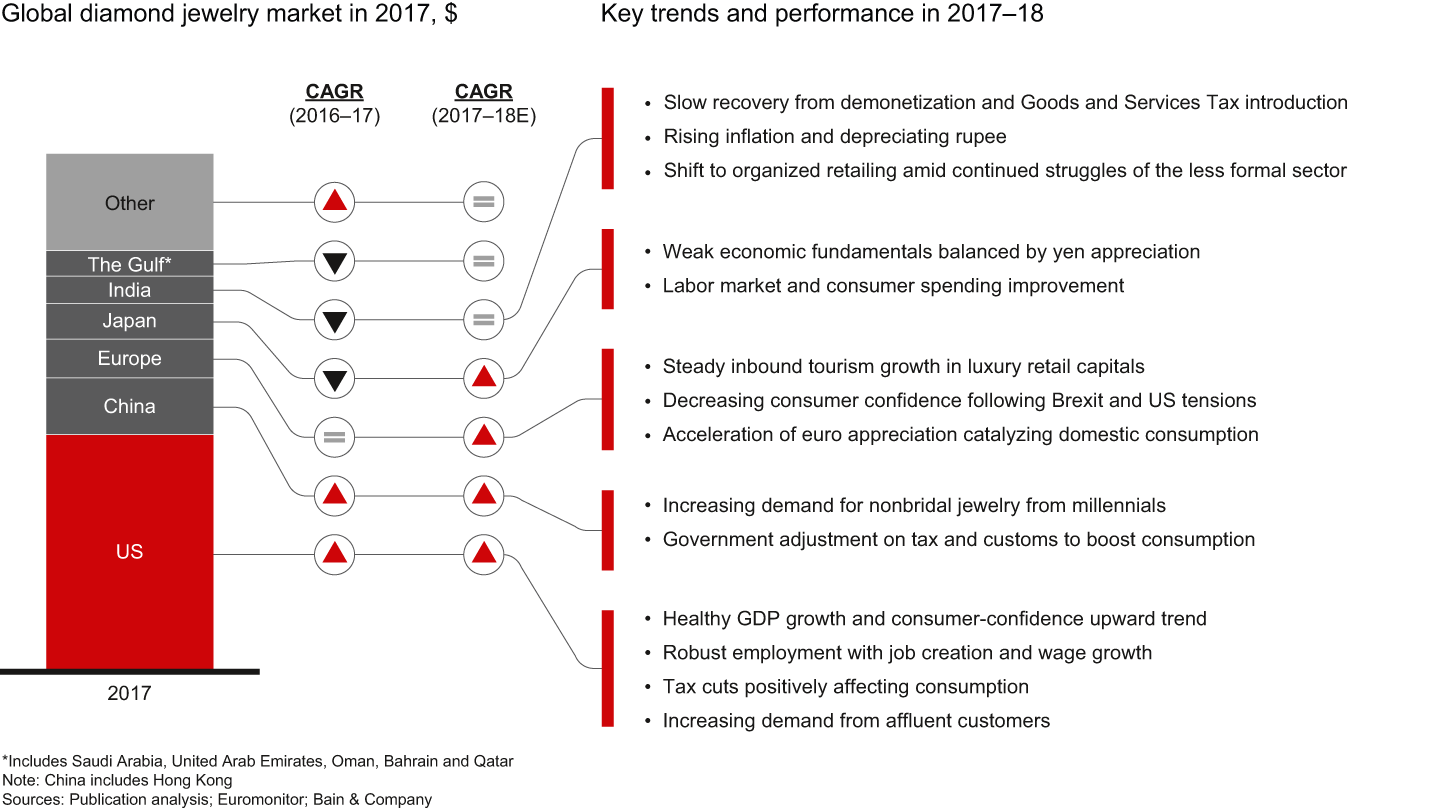

Figure 17

5. Key industry trends
- Three trends have the highest potential to affect the diamond industry in the near term: advancements in digital technologies, the development of lab-grown diamonds and generational shifts in consumer preferences.
- Among other benefits, digital technologies are aiding transparency and efficiency efforts across all segments of the value chain. For example, in 2017 and early 2018, blockchain projects were launched to help consumers confidently identify the origin of their diamonds. Mining companies are using predictive maintenance, real-time controls and artificial intelligence to mitigate rising operating costs. Cutting and polishing players are pursuing advanced solutions in digital mapping, modeling and manufacturing to shorten production cycles and ultimately move toward fully automated processes to manufacture polished diamonds. Consumer behavior is also changing as technology matures; social media, for example, is enabling and influencing new direct-to-consumer and online sales models.
- Two important events occurred in 2018 regarding the lab-grown diamond market. In July, the US Federal Trade Commission amended its Jewelry Guides, clarifying “a diamond is a diamond” regardless of its origin. In September, De Beers Group launched a lab-grown fashion jewelry retailer called Lightbox Jewelry that introduced a new pricing paradigm. Lightbox uses a linear pricing model, reflecting the linear cost of production, whereby all lab-grown stones cost $800 per carat, regardless of size. Lightbox also does not provide grading reports for its products. As the lab-grown industry continues to evolve and lab-grown diamond prices decline, players along the entire natural diamond value chain will need to determine how to respond and how to position their products with consumers.
- While much attention has been paid to millennial buyers, their successors in Generation Z have been gaining buying power, forcing the industry to rethink marketing and sales strategies. Self-purchase sales and social media shopping are expected to increase, attracting younger generations of diamond buyers with distinct preferences.
Figure 18
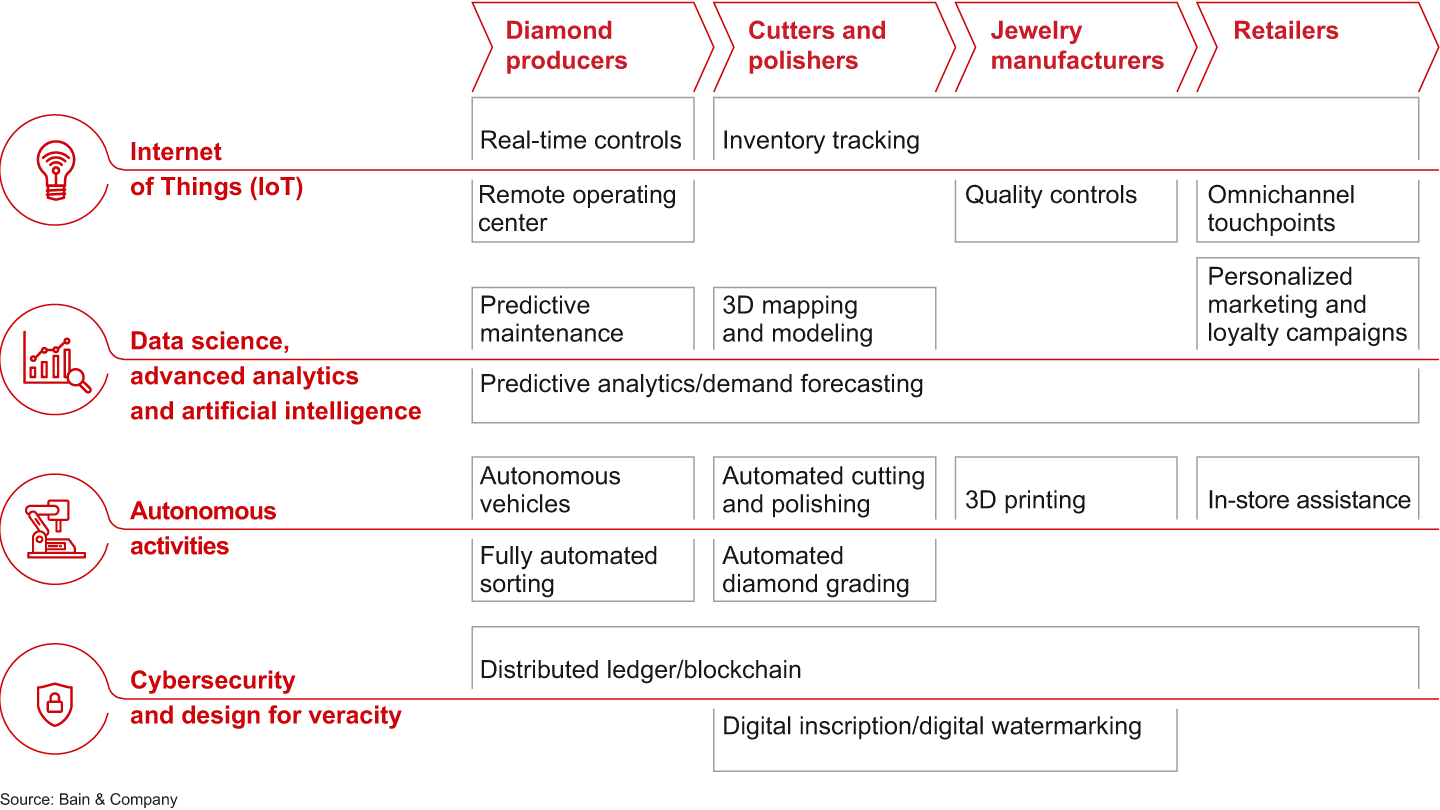

Figure 19


Figure 20
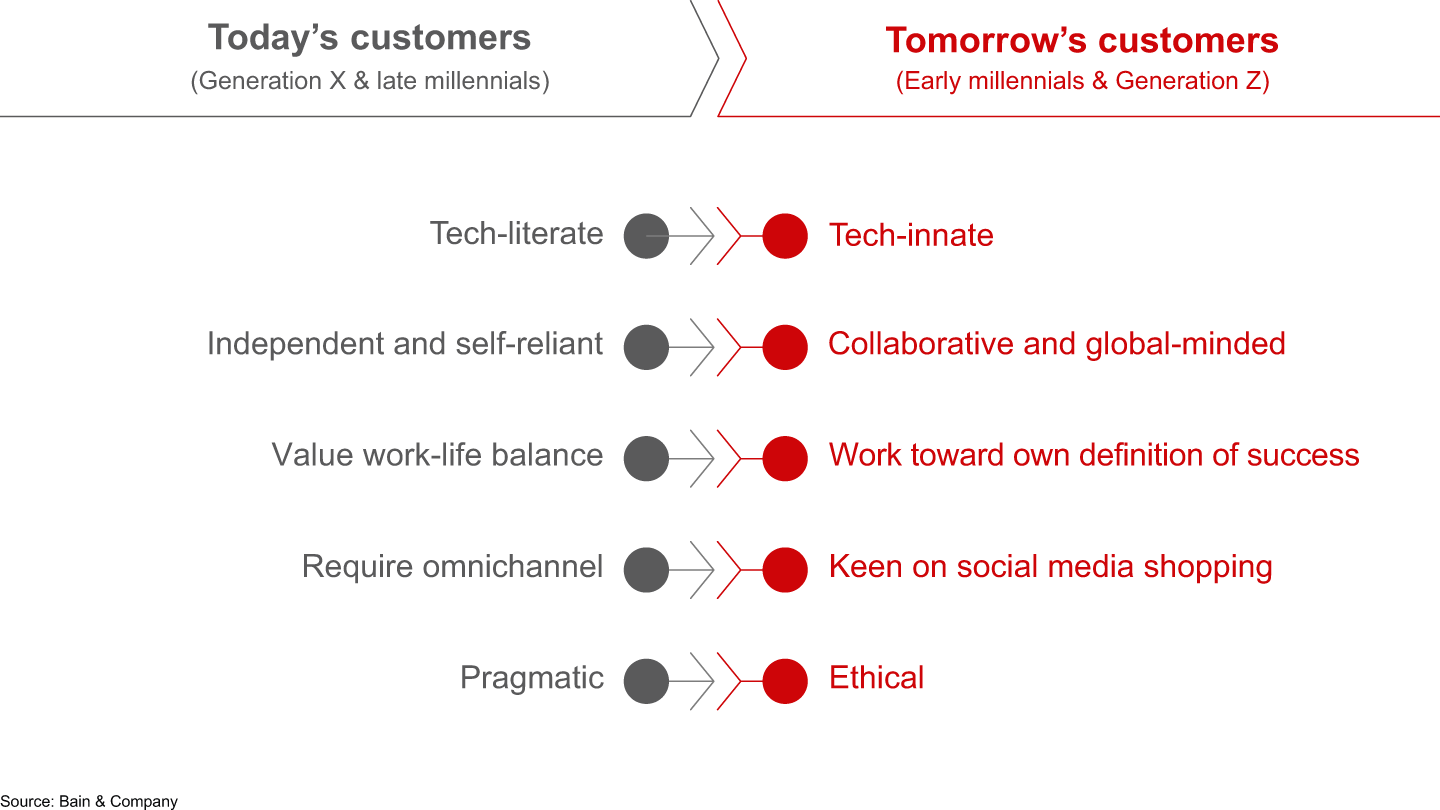

Figure 21

6. Recent developments in the lab-grown market
- Lab-grown diamonds have existed for more than 60 years, with limited effect on the natural gem-quality market. But advancements in technology have pushed the lab-grown market into a more competitive position. Most notably, new chemical vapor deposition (CVD) technology deeply cut the cost to produce larger, higher-quality diamonds. Today, it costs $300 to $500 per carat to produce a CVD lab-grown diamond, compared with $4,000 per carat in 2008.
- As production costs have dropped, retail prices have followed. The retail price of gem-quality lab-grown diamonds nearly halved in the past two years, while wholesale prices dropped threefold. Prices are expected to decrease even further as production efficiencies increase, new competitors enter the market and the segment commoditizes.
- Lab-grown diamond producers have two options: to pursue gem-quality production for retail jewelry sales or to produce diamonds for high-tech applications. The latter option has the greatest potential for long-term growth and profitability, as well as low barriers to entry. Sensors, semiconductors and medical cutting tools, for example, present an emerging market for CVD-produced diamonds.
- The current gem-quality, lab-grown polished diamond capacity is estimated at 2 million carats, the majority of which is melee (diamond size less than 0.18 carats). By 2030, the market could grow to between 10 million and 17 million carats, if the segment can sustain its current growth rate of 15% to 20% annually supported by consumer demand and attractive economics. But we believe manufacturing capacity will be a major limiting factor in the short to medium term.
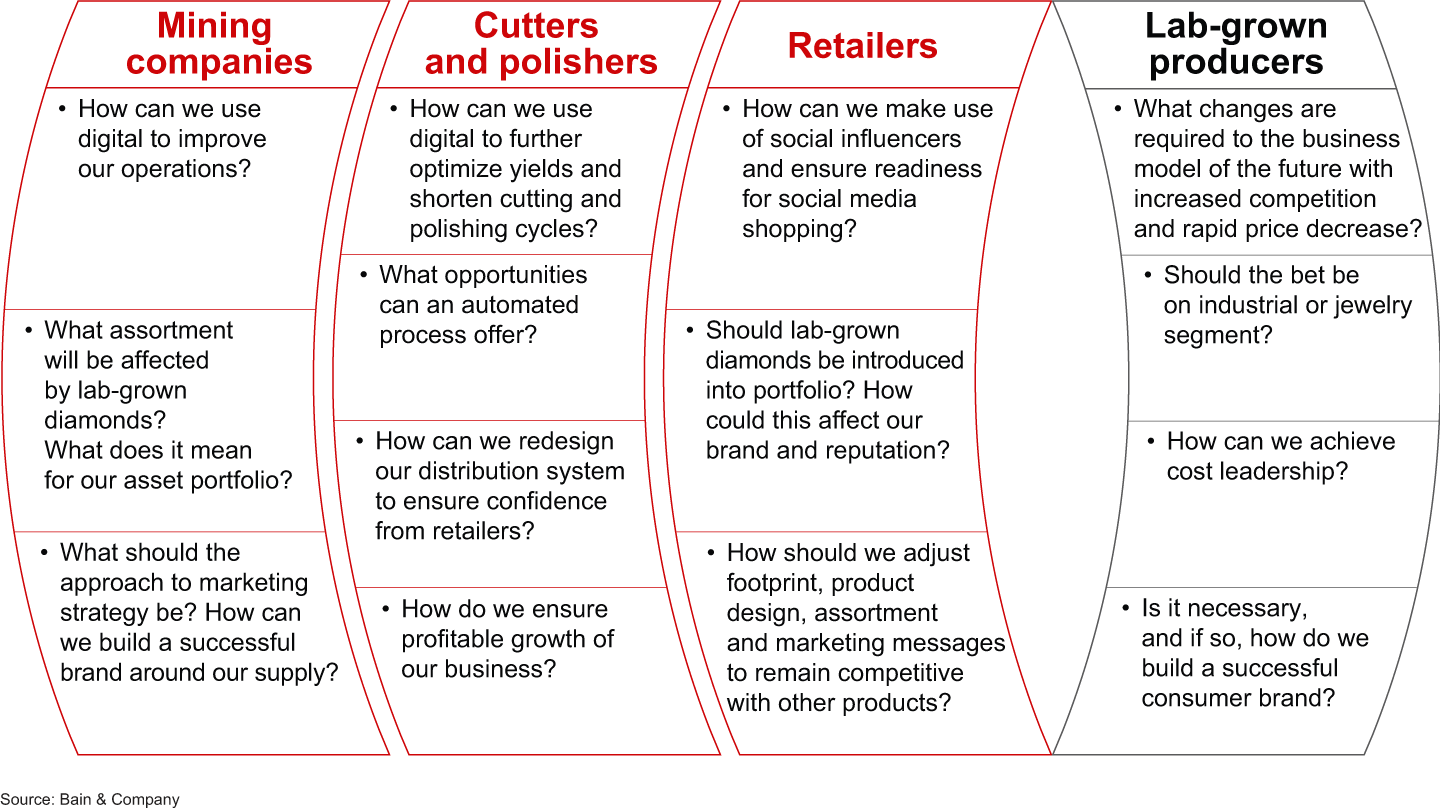
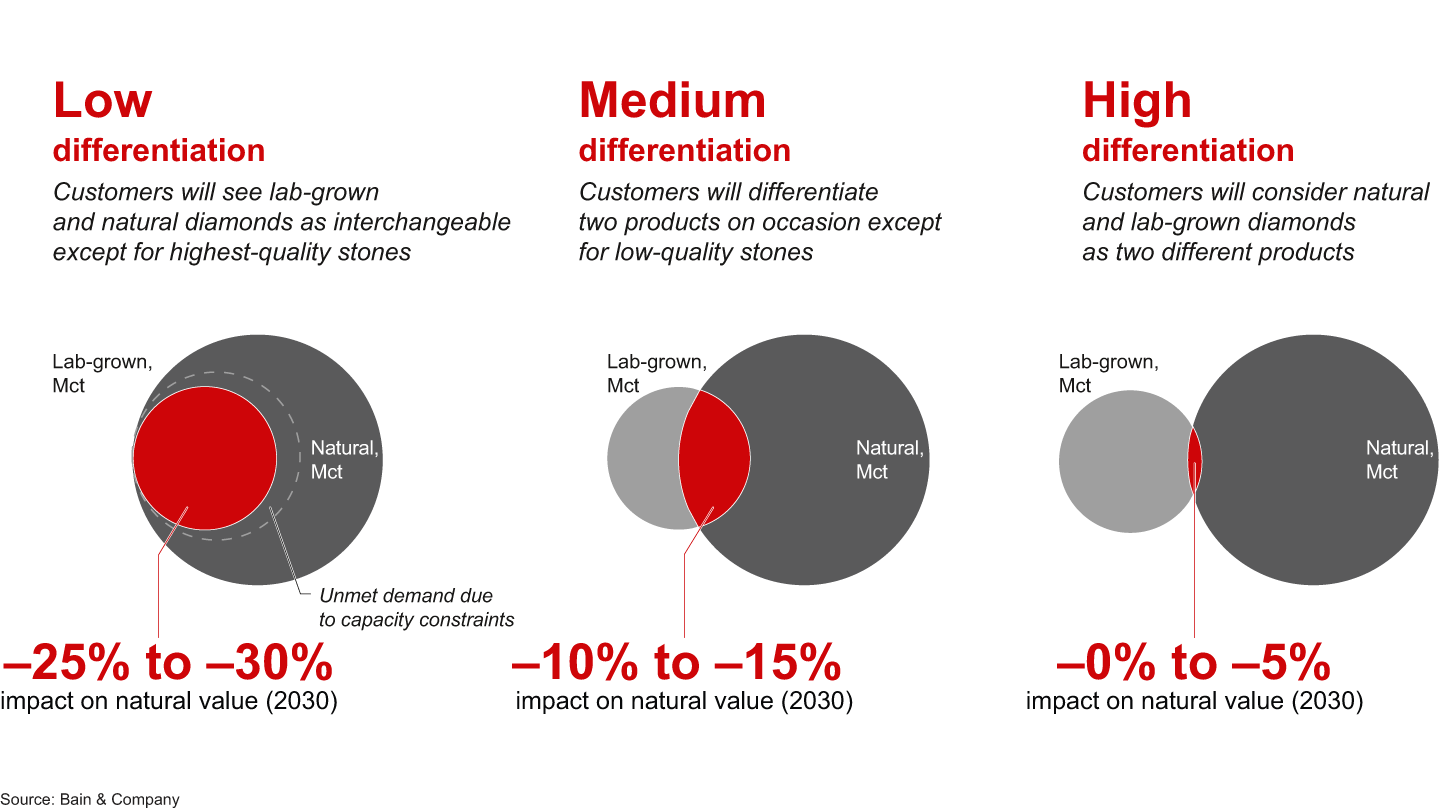
- Ultimately, marketing and consumer perception will determine the effect of lab-grown diamonds on the natural diamond market. Three scenarios exist: Consumers could perceive lab-grown and natural diamonds as interchangeable, as two different products, or somewhere in between. Marketing could uphold the value of natural diamonds, especially if the prices of lab-grown diamonds continue to drop. It’s probable that consumers will view lab-grown diamonds as fashion jewelry but not luxury goods, limiting the effect on natural diamond demand.
Figure 22
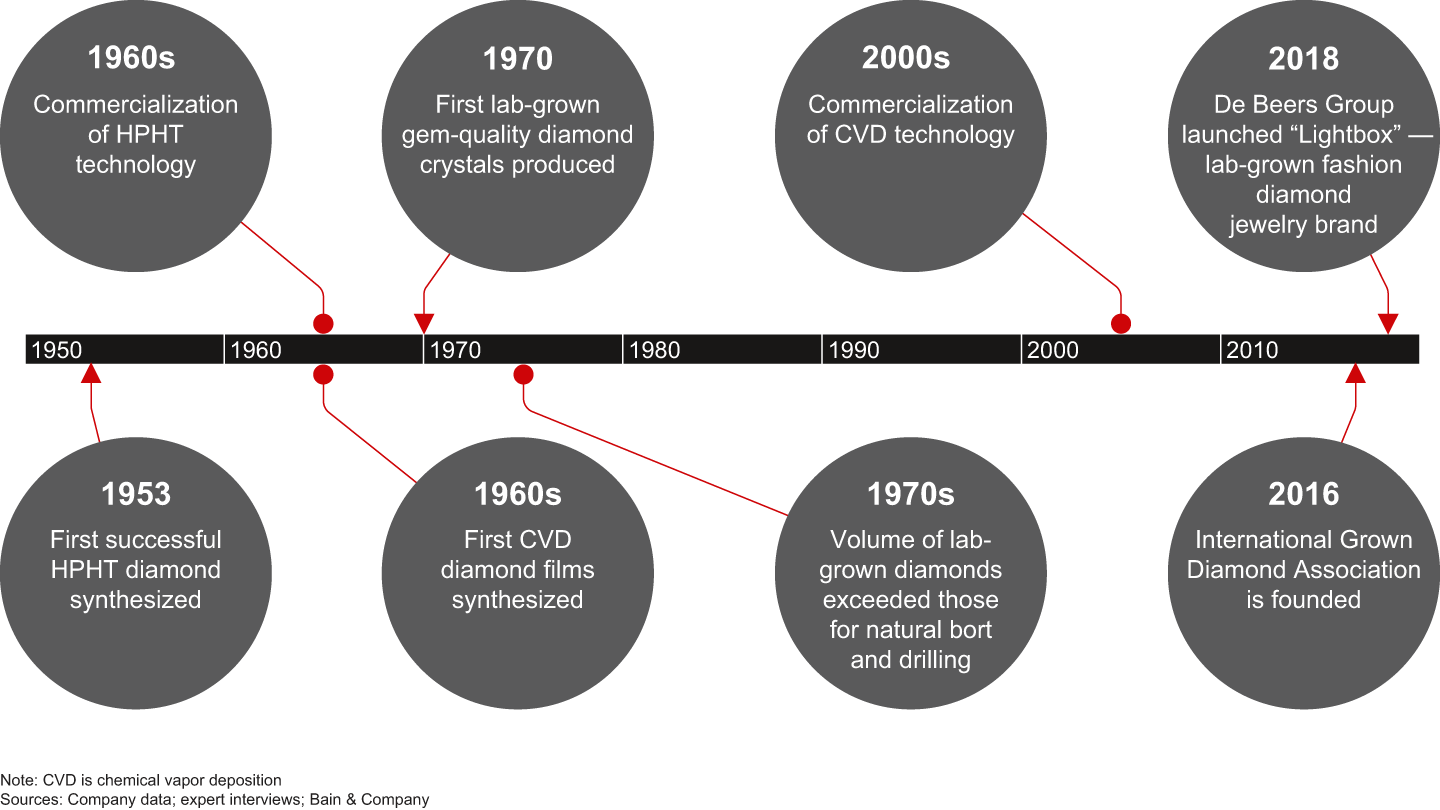

Figure 23
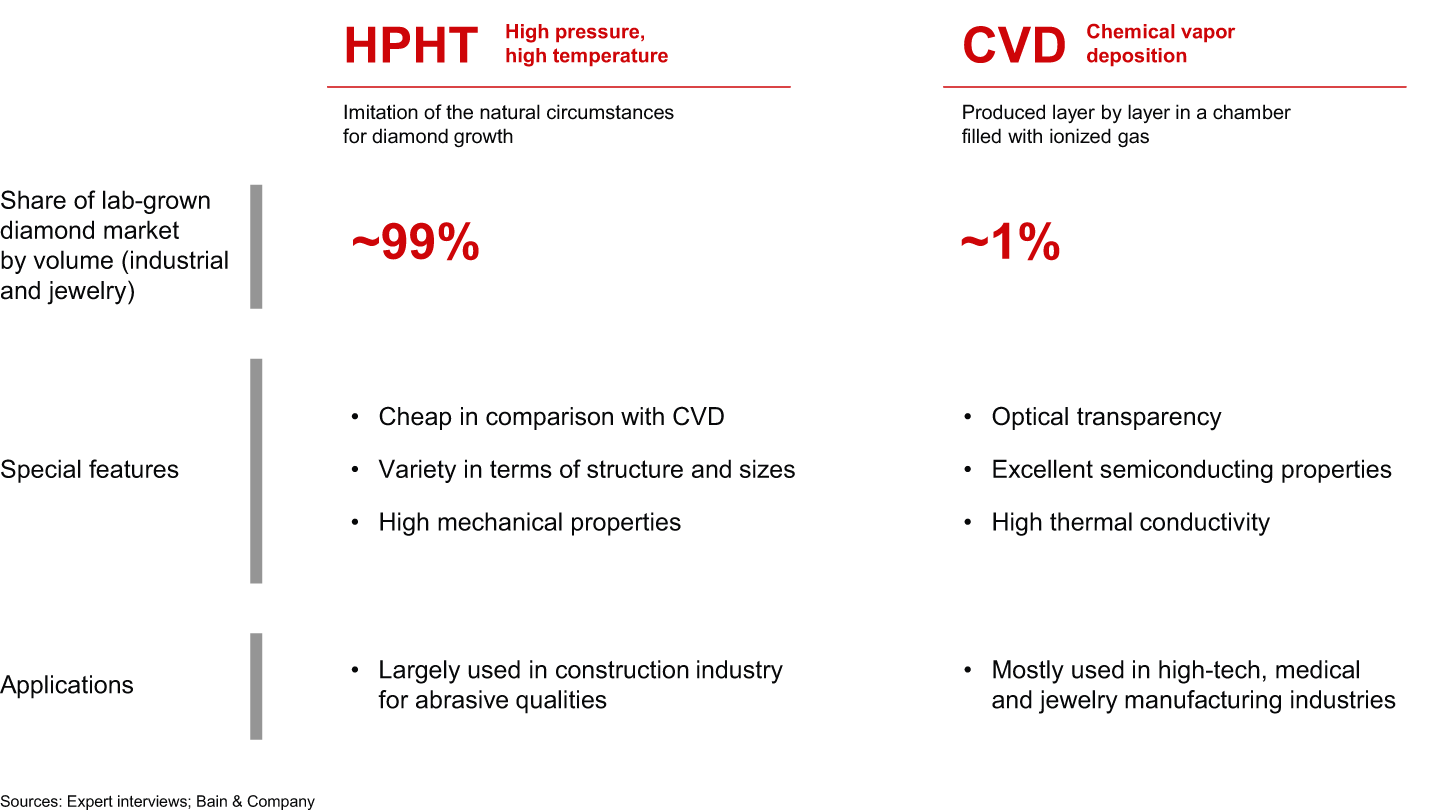

Figure 24
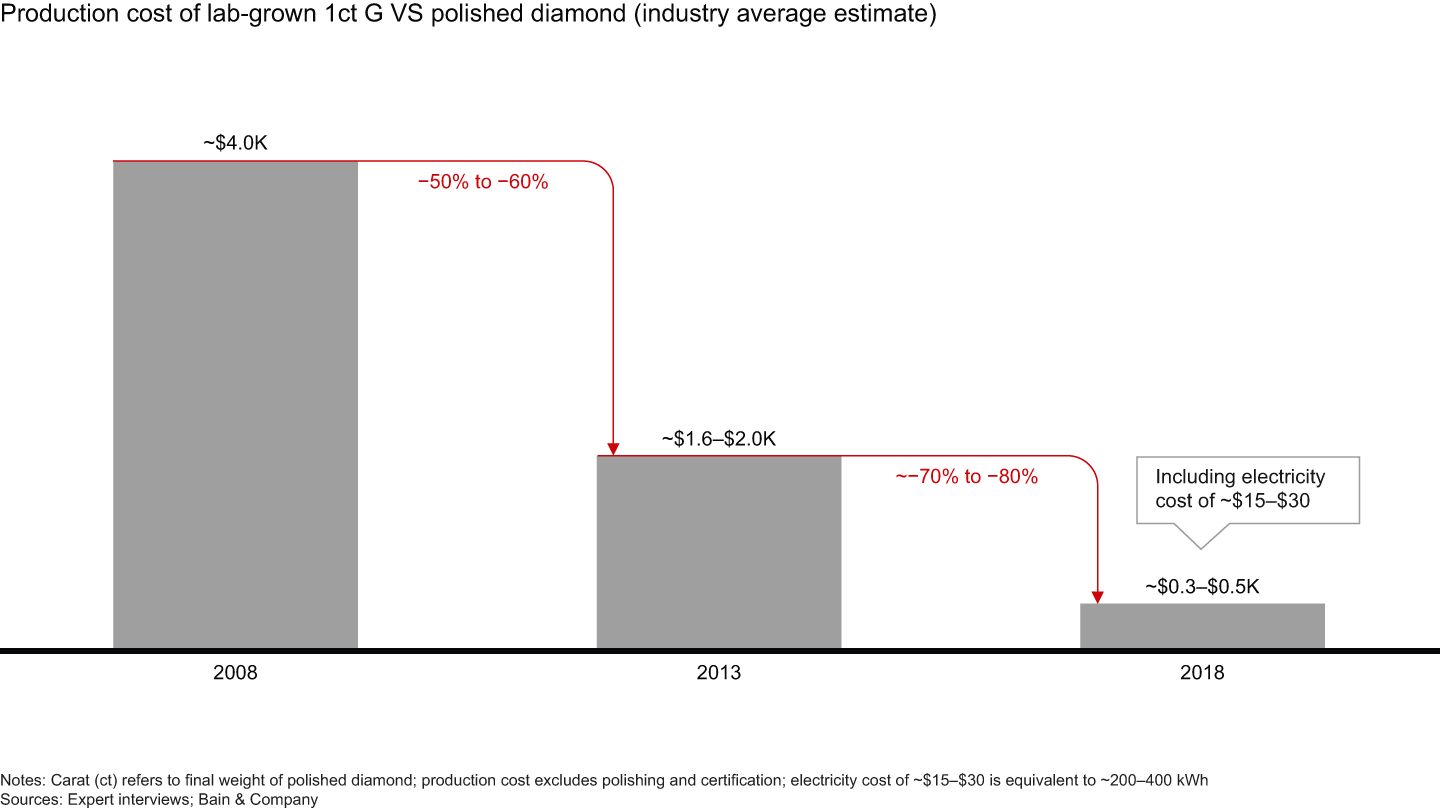

Figure 25
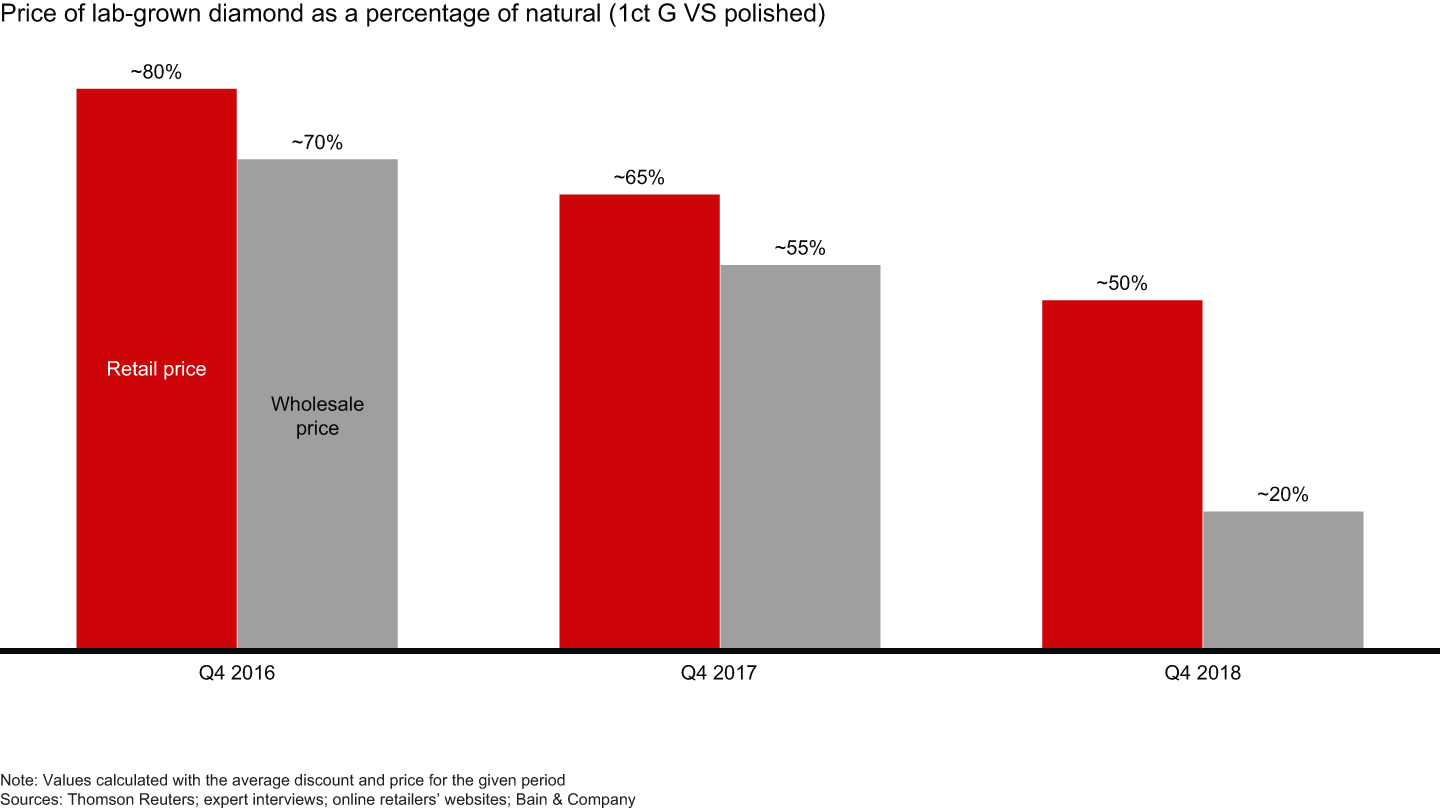

Figure 26
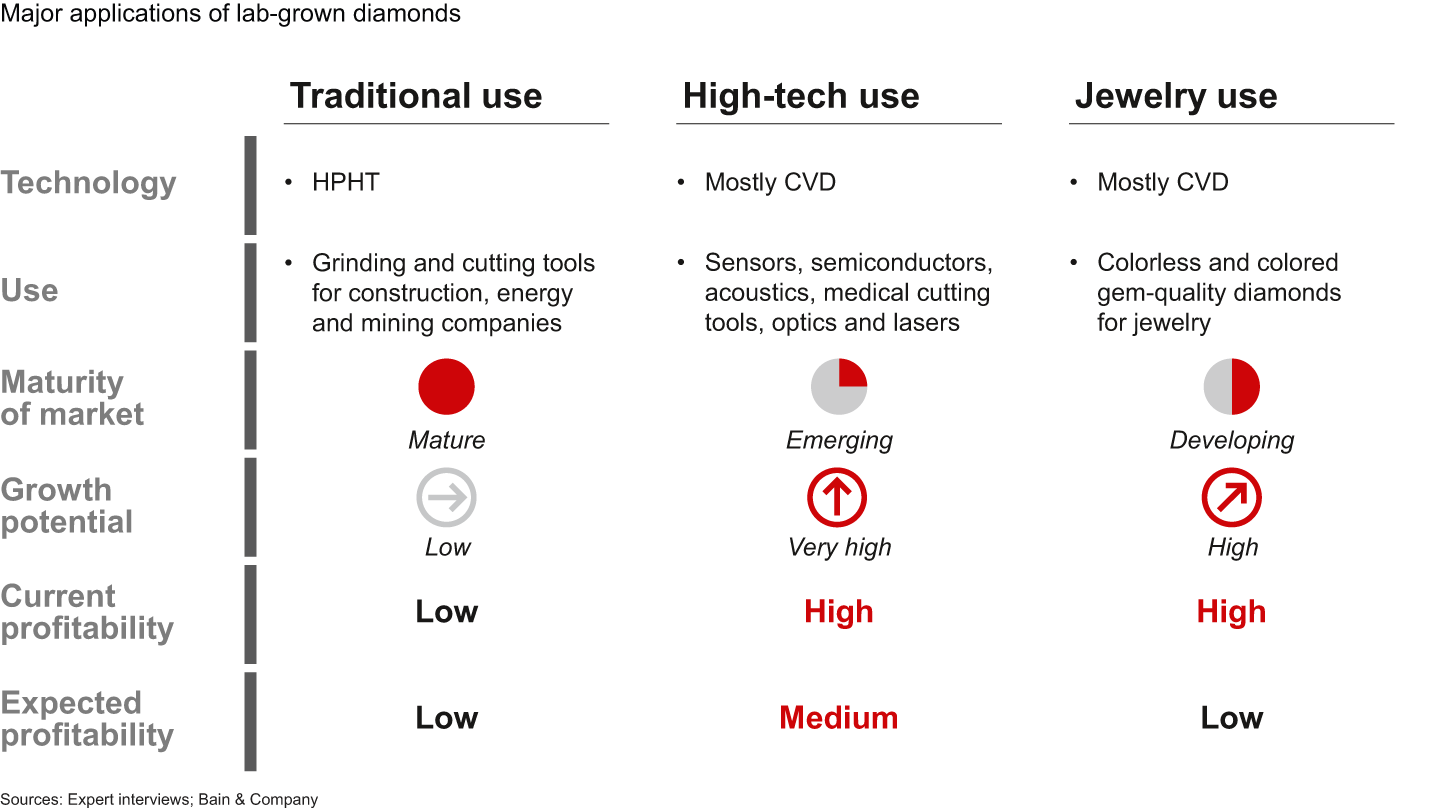

Figure 27
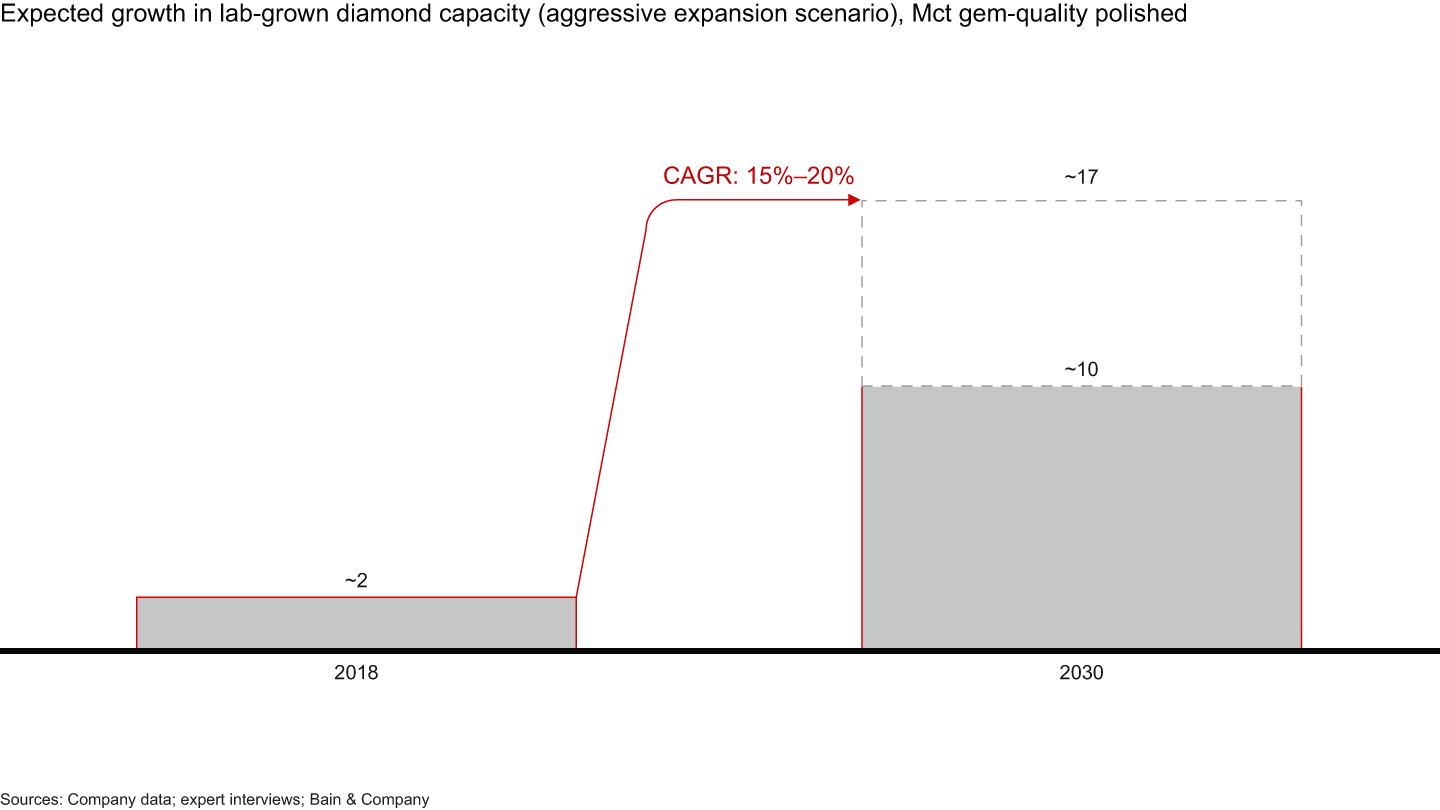

Figure 28

7. Updated supply and demand model
- Based on our analysis, we expect natural rough diamond supply to change at an average annual rate of negative 1% to 1% in volume terms through 2030. We expect demand to grow 0% to 2% in real value terms during the same time frame. Our current outlook versus the forecast from the previous year incorporates revised macroeconomic forecast, possible demand substitution from lab-grown diamonds, and reflects fundamental supply and demand factors rather than short-term fluctuations. The short-term supply-demand balance depends on the actions of major producers and efficiencies along the diamond pipeline.
- We expect China and the US to maintain their leading roles in the diamond jewelry market. Real GDP growth of 2% to 3% per year will fuel US demand, and expansion of the middle class will reinforce China’s positive long-term demand trend.
- India continues to show promising signs of growth, even amid its current market challenges. As India’s middle class expands and bridal jewelry is adopted, demand should follow.
- Europe and Japan are expected to remain relatively stable, with modest long-term growth prospects.
- The rough diamond supply is reasonably predictable over the next 5 to 10 years. However, financial challenges, production mix updates and overall uncertainty over future market conditions could force or delay production. As mining companies can adjust output to react to changing market conditions, production may fluctuate at existing mines.
- We based our rough diamond supply forecast on an analysis of existing mines and anticipated production at planned new mines. Our projections also include potential supply from new sources, such as tailings from older mines, reopening of distressed mines, activation of options in resource development plans and recycling of secondhand diamonds.
Figure 29
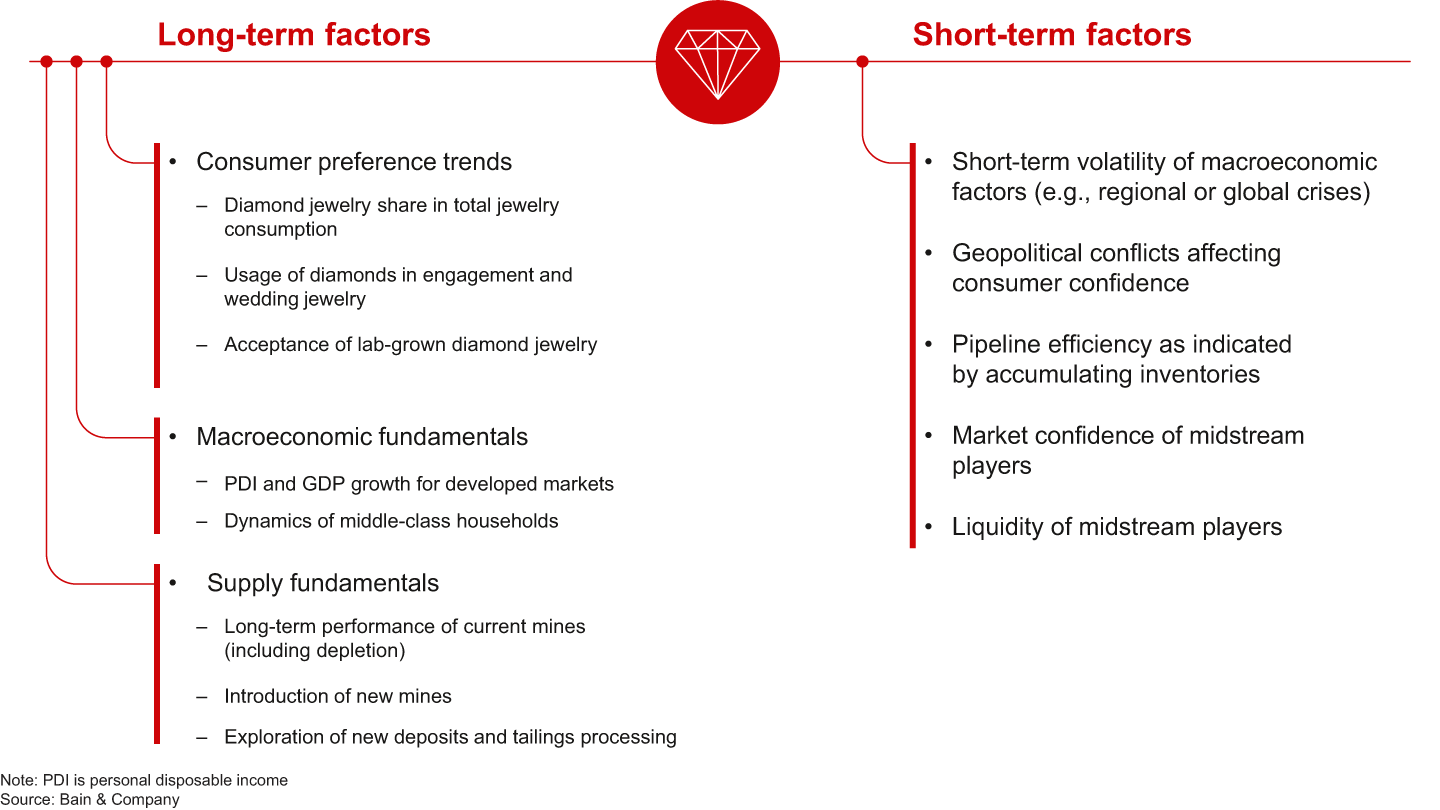

Figure 30
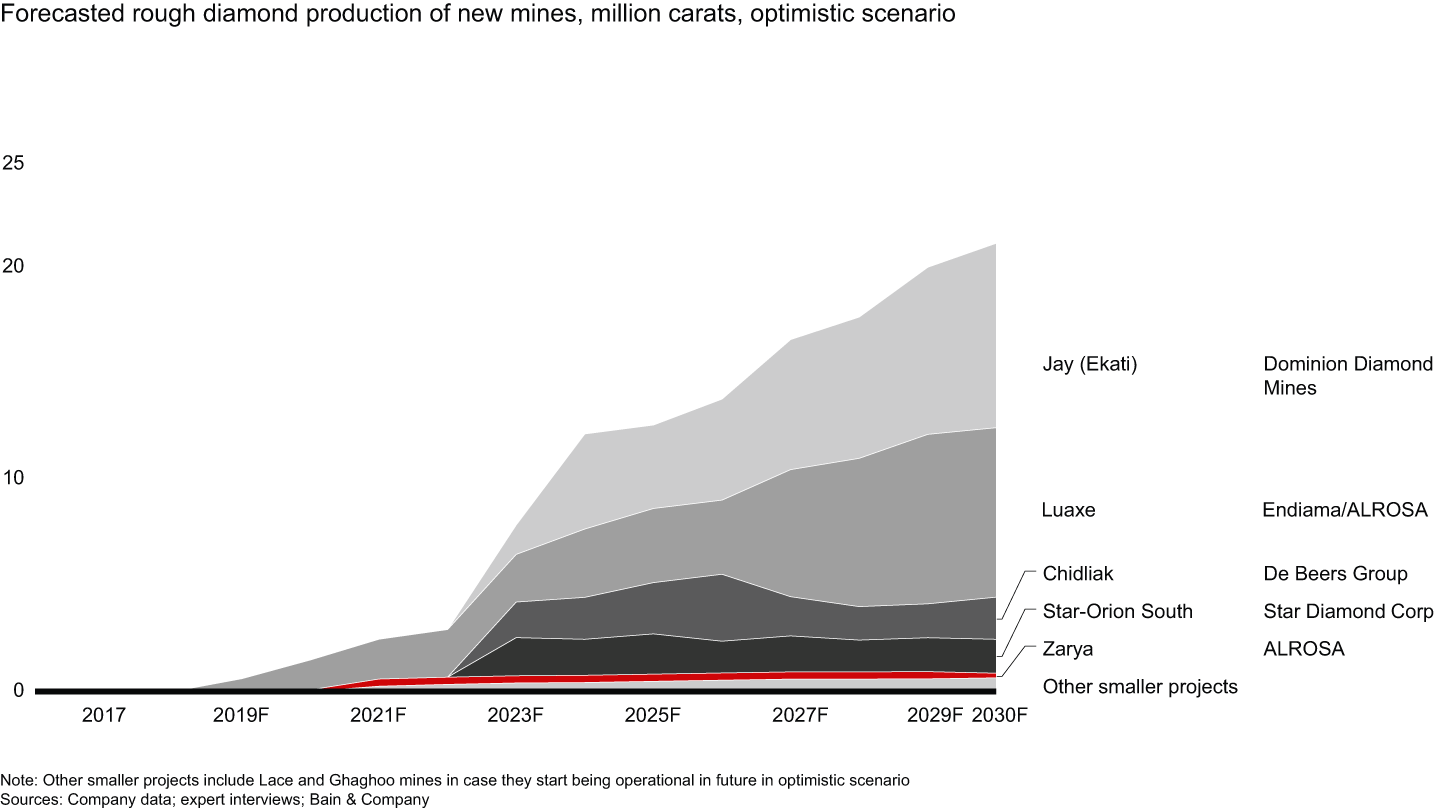

Figure 31
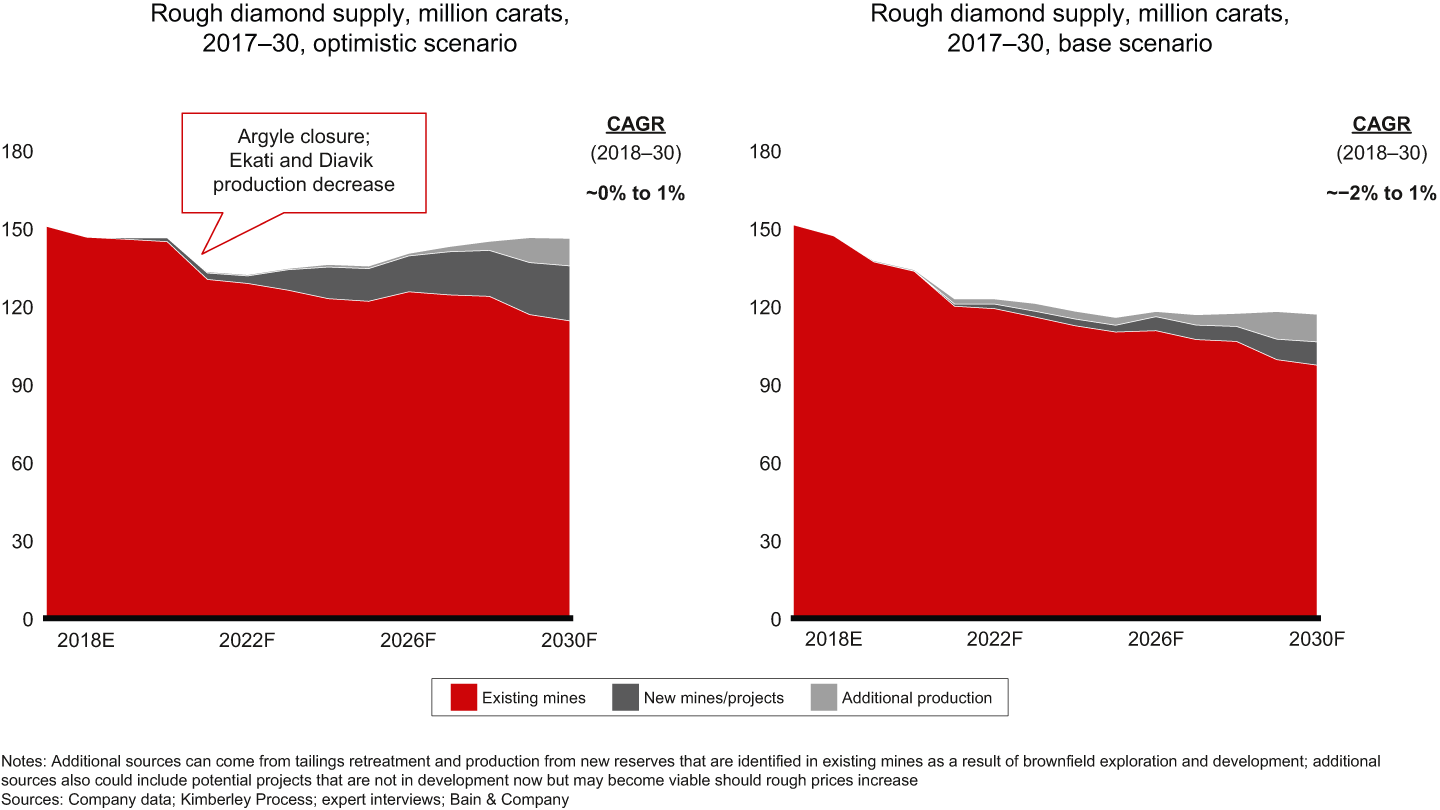

Figure 32
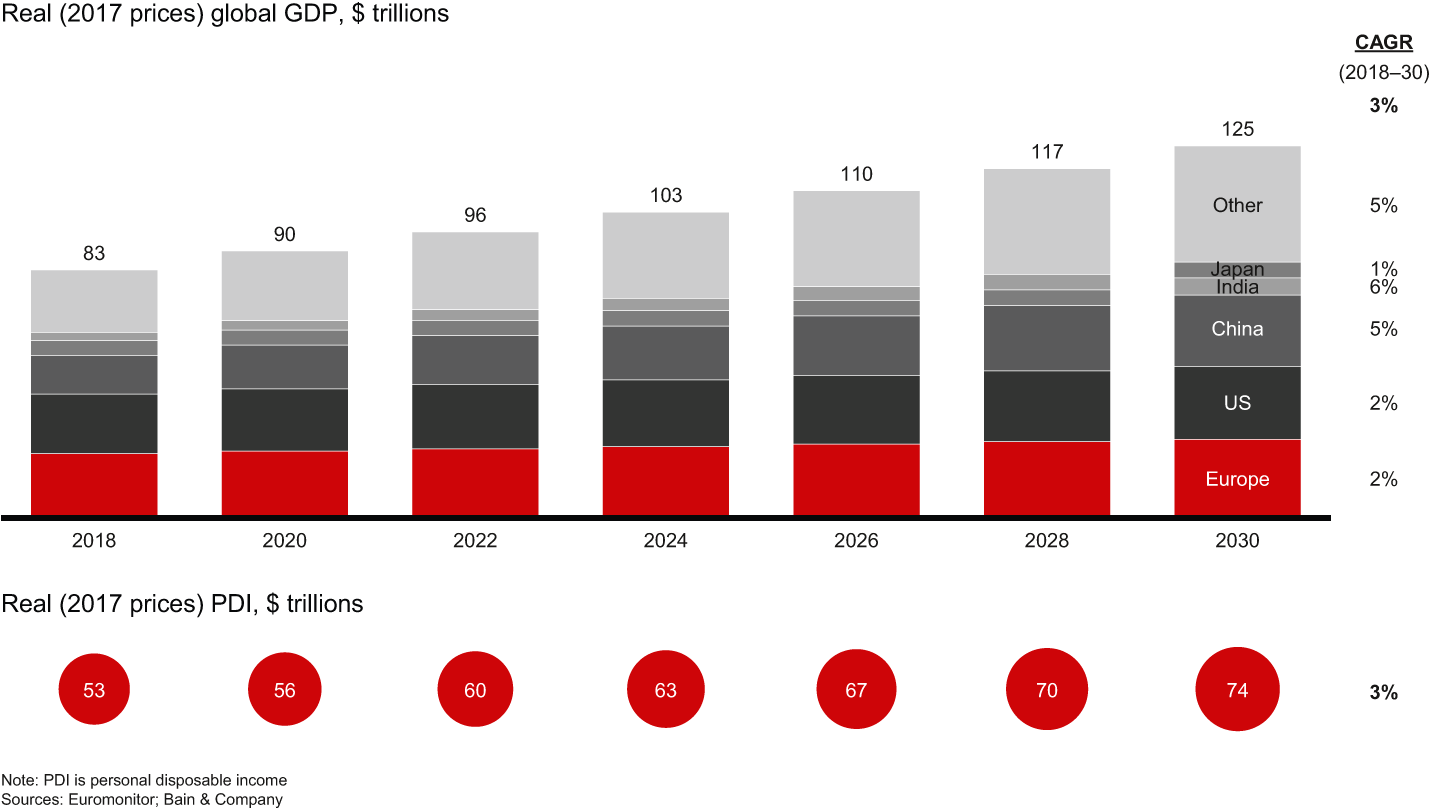

Figure 33
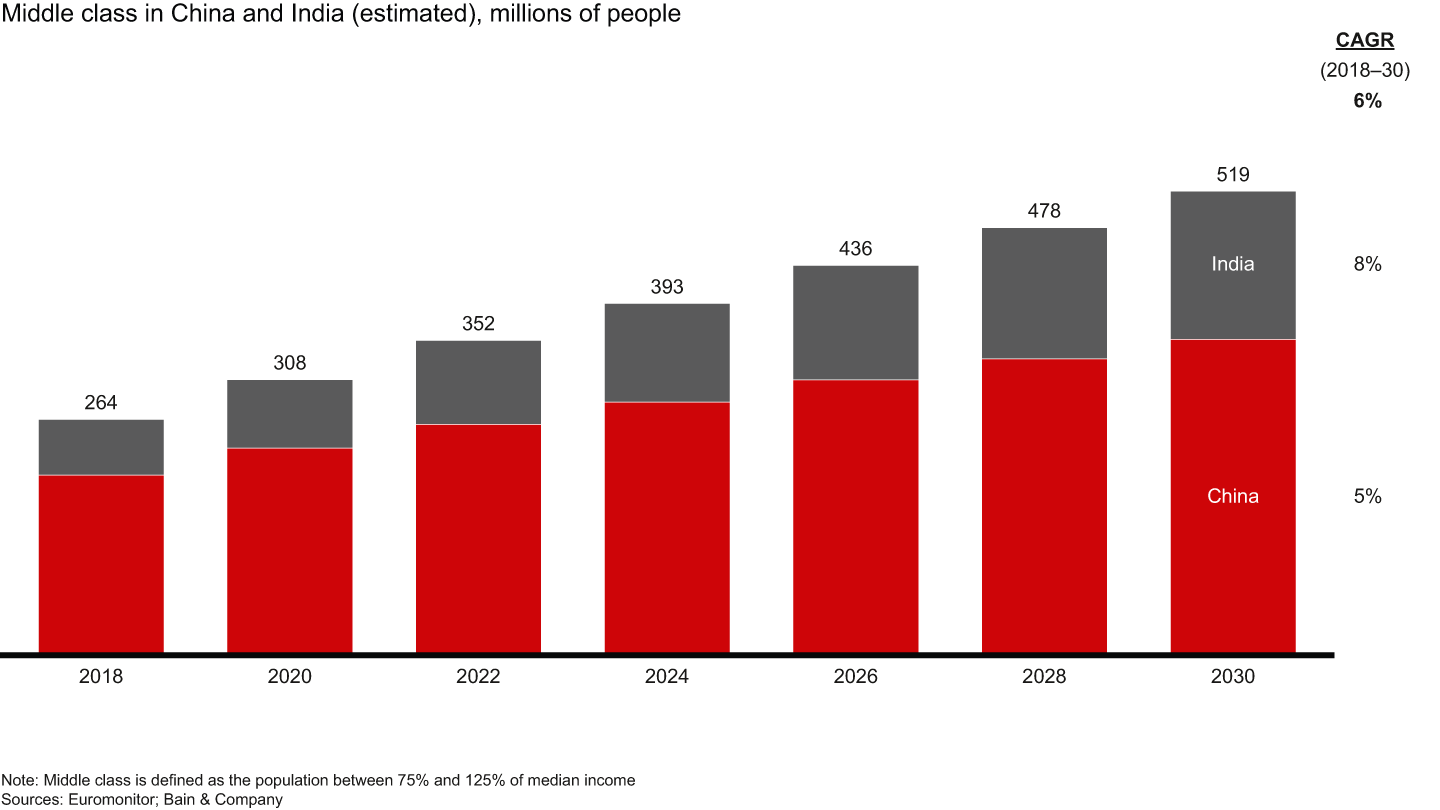

Figure 34
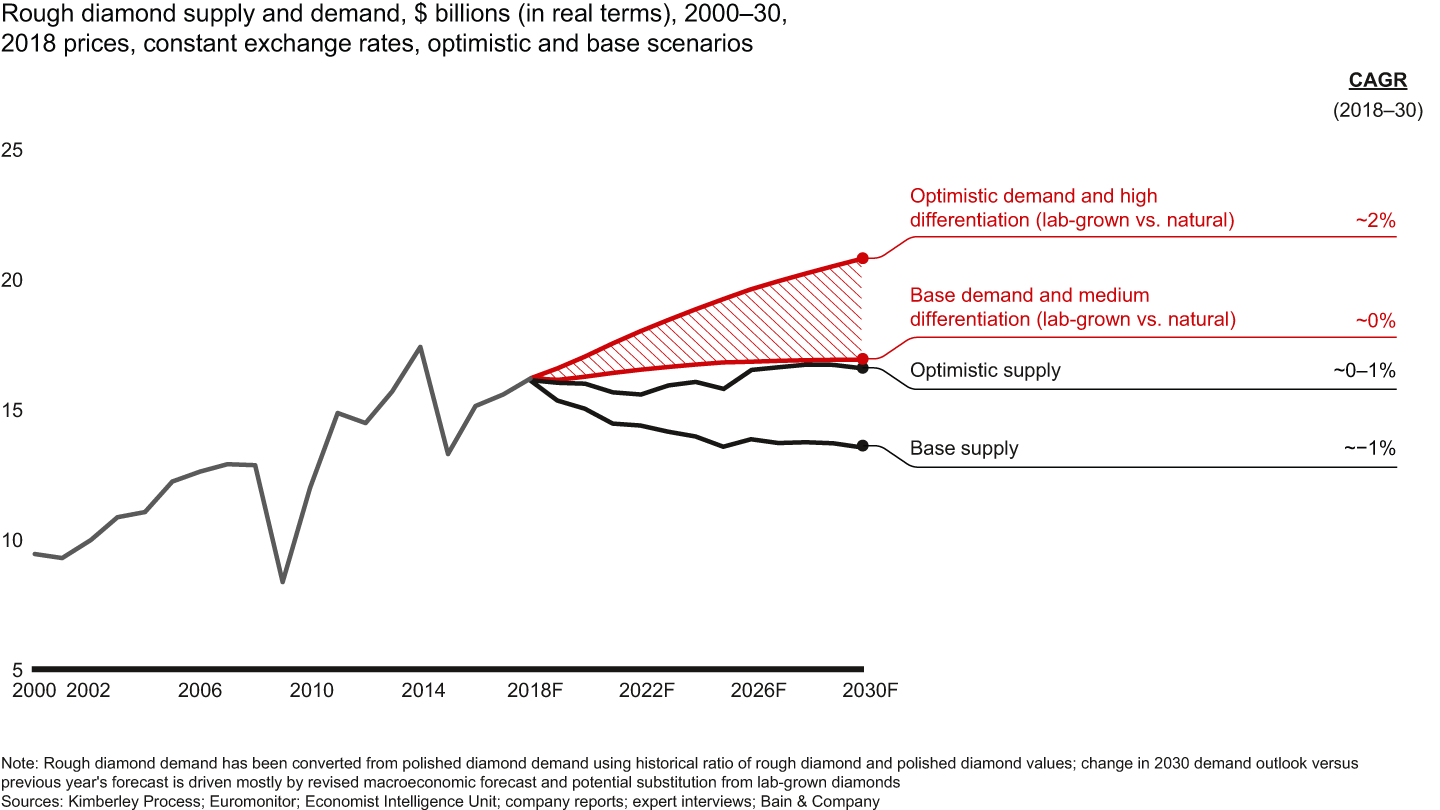

Figure 35

Glossary
- Average price per carat sold — indicator used to estimate change in value of diamond assortment realized in specific period (including sales of stock produced in previous periods); to estimate average price per carat sold, total value of diamonds sold is divided by total volume of diamonds sold.
- Beneficiation — the process by which producing governments seek to extract more value from their natural resources by developing downstream industries in their own countries; typically it involves commitments by producer companies to set up local cutting centers and hire local workers.
- CAGR — compound annual growth rate, a year-on-year growth rate over a specified period of time.
- Carat — one of the four main diamond characteristics, the others being color, cut and clarity; 1 carat=250 mg.
- CVD — chemical vapor deposition, a high-temperature but normal-pressure process to grow lab-grown diamonds.
- Gem-quality diamonds — diamonds used for jewelry manufacturing.
- HPHT — high-pressure, high-temperature; a process using large presses to grow lab-grown diamonds.
- Kimberley Process — certification commitment aimed at prevention of conflict diamond sales.
- Lab-grown diamonds — diamonds produced in laboratories using HPHT or CVD methods; also known as synthetic diamonds.
- Market price index — indicator that shows change in market price for like-for-like diamond categories weighted according to global rough and polished product mix.
- Operating profit — profit from main operations before interest and tax.
- Personal disposable income — amount of money that households have available for spending and saving after paying income taxes.
- Reserves — resources known to be economically feasible for extraction.
- Resources — valuable deposits that could potentially be economically extracted at a later point.
This report was prepared by Olya Linde, a partner with Bain & Company, and Oleg Geyler, a principal with Bain, together with Ari Epstein, chief executive officer, AWDC. The authors were supported by a global team including Ivan Grishchenko, Sophia Kravchenko, Benoit Menardo, Anton Matalygin, Julia Gavrilova, Masha Shiroyan, and Bain’s Mining and Luxury Goods practices.
This work was commissioned by AWDC and prepared by Bain & Company and AWDC. It is based on secondary market research, analysis of financial information available or provided to Bain & Company and AWDC, and a range of interviews with customers, competitors and industry experts. Bain & Company and AWDC have not independently verified this information and make no representation or warranty, expressed or implied, that such information is accurate or complete. Projected market and financial information, analyses and conclusions contained herein are based (unless sourced otherwise) on the information described above and on Bain & Company’s and AWDC’s judgment, and should not be construed as definitive forecasts or guarantees of future performance or results. Neither Bain & Company nor AWDC nor any of their subsidiaries or their respective officers, directors, shareholders, employees or agents accept any responsibility or liability with respect to this document. This document is copyright of Bain & Company, Inc., and AWDC and may not be published, copied or duplicated, in whole or in part, without the written permission of Bain & Company and AWDC.
First published in diciembre 2018