Report

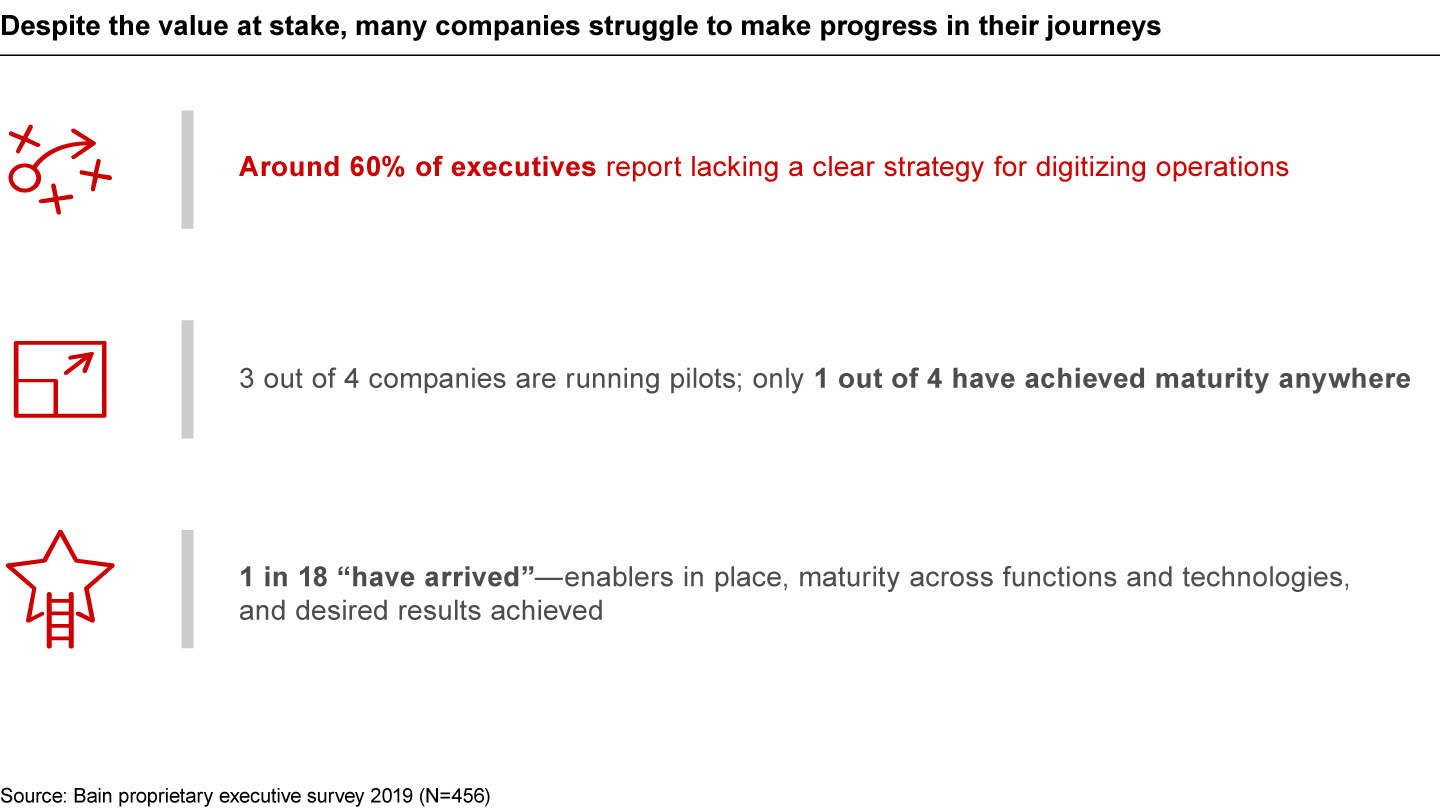
The transaction data to support consumer insights is mounting faster than anyone expected. Yet even as it does, few consumer goods companies have developed a well-defined methodology for using it. Bain surveyed more than 450 global executives and found that while 85% believe that big data is the most important tool underpinning industry change, 60% readily admit that their biggest challenge is the lack of a clear big data application strategy to spot core customer groups, identify key growth drivers and make where-to-play and how-to-win decisions (see Figure 1). Among the basic reasons why companies are behind the curve in developing strategies to help them reach their digital full potential: It has been more than challenging to keep up with rapid changes in consumer demand and the evolving industry landscape and to gain adequate access to the transaction data that could fuel their next moves.
Executives acknowledge the lack of a clear digital strategy

Quantifying and rigorously analyzing digital performance has been important since the emergence of digital sales. Now it has become far more critical (and vital to future success) as consumer goods companies struggle to regain footing for a Covid-19 world and beyond. The outbreak of the virus saw a huge consumer shift from offline to online channels, raising the need for brands quickly to implement digital growth strategies and to make the most of “new retail”—that is, the convergence of offline and online. If the coronavirus pandemic has taught us anything, it is that most consumer goods companies still are at the early stages of the digital learning curve—and quickly need to pick up the learning pace. Brands also need to address the operational weaknesses exposed by the logistical and labor disruptions caused by the pandemic.
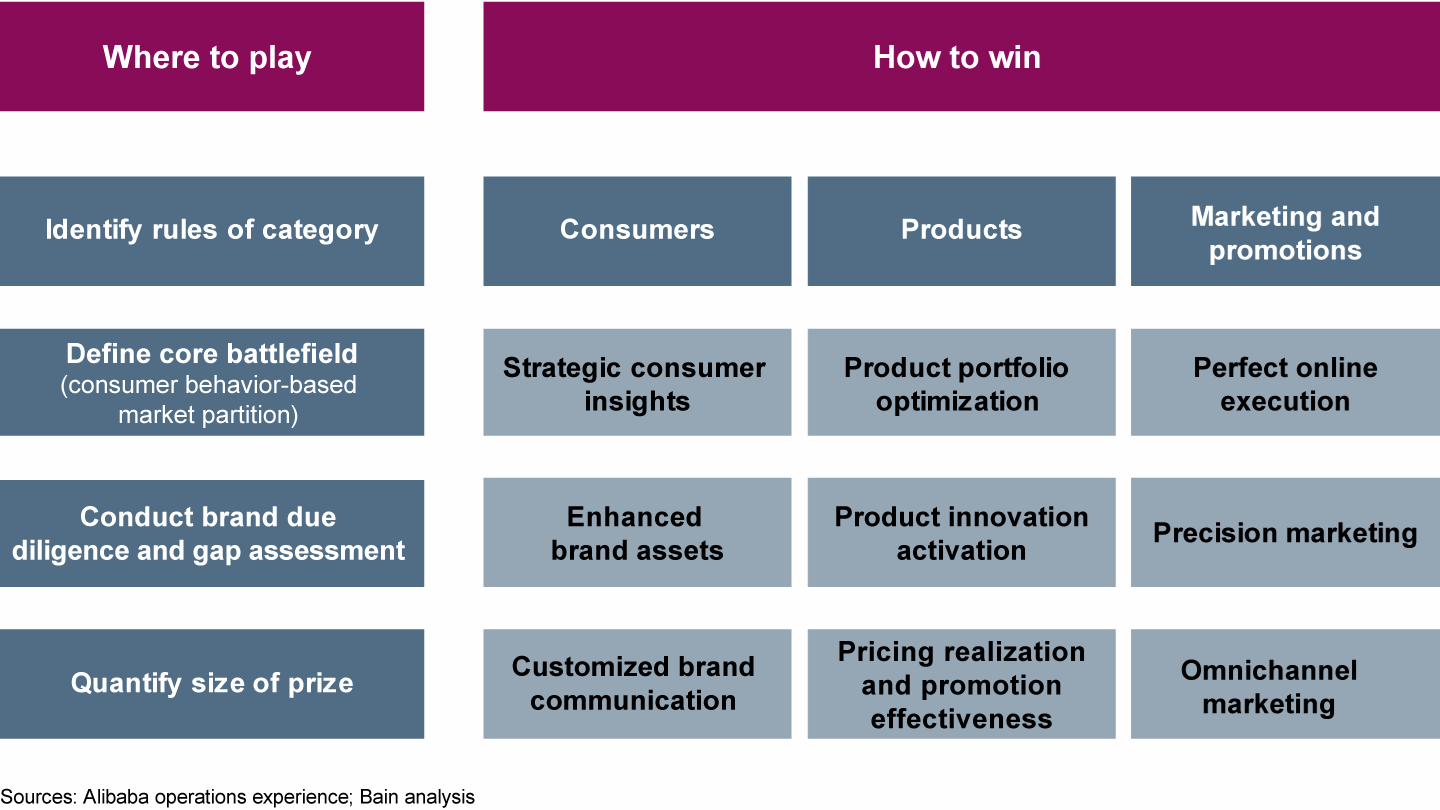
Currently, some companies use Tmall sales data to reinvent their digital growth strategy for the world changed by Covid-19. These pioneering partners work with the “brand digital growth accelerator,” a set of methodologies jointly developed by Bain and Tmall FMCG, to address the challenges and seize digital growth opportunities by determining where to play and how to win (see Figure 2). The where-to-play decisions are made following brand due diligence, gap assessment and quantifying brand full potential, while the how-to-win choices require thoughtful moves in the three vital areas of consumers, products and marketing/promotions. Brands can speed implementation and validate their opportunities using micro-battles and test-and-learn sprints.
A brand's digital growth can be accelerated by exploring two big ideas

Where to play?
The best companies follow a four-step approach.
Identifying the category rules
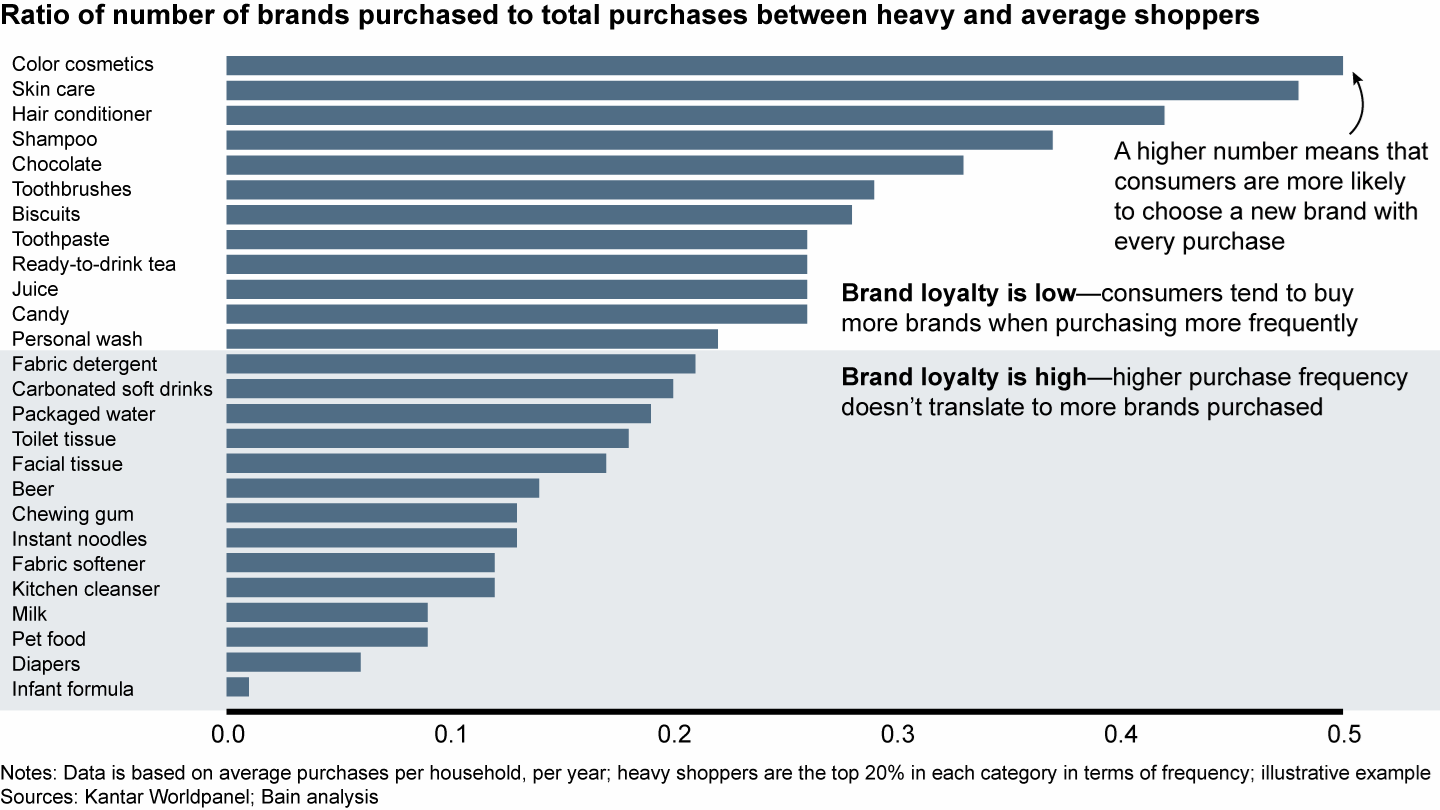
Real-time transaction data helps brands pinpoint the category rules and laws of online growth. It shows basic attributes such as whether a category tends to be loyalist or repertoire—that is, whether consumers tend to buy the same brand or choose from a variety of brands. It also shows whether more online growth in a particular category comes from penetration, repurchasing or value per transaction. For example, the infant formula category is highly loyalist, while the beauty category (which includes skin care and color cosmetics) is considered highly repertoire (see Figure 3). Because consumers with higher purchasing frequency typically choose among multiple brands, it makes more strategic sense for beauty brands to increase penetration than to nurture loyal consumers.
To redefine category rules, understand where a category stands on the loyalist–repertoire spectrum

Drawing up category boundaries
Transaction data also gives companies the clearest view possible of the online market competitive landscape. It helps companies define category core battlefields—namely, the main clusters in which they now fight and the high-potential clusters they should enter. Importantly, it enables companies to redraw category lines according to real-time consumption behavior.
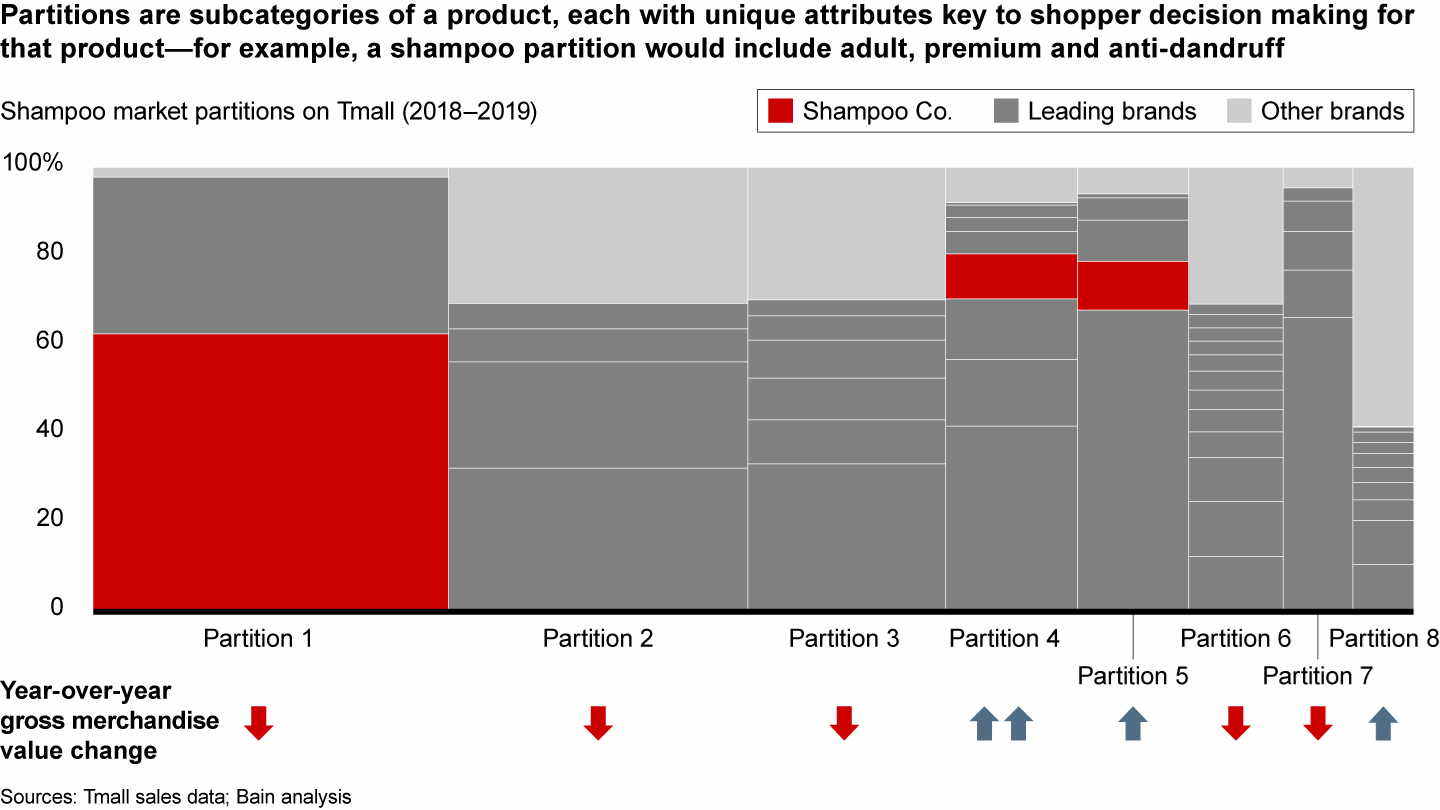
Brands determine category boundaries by conducting a partition analysis of transaction data. Among dozens of product attributes, only a handful are pivotal to consumers’ purchasing decisions. A partition analysis enables brands to identify key decision drivers, several of which combine to determine market partitions. For example, in the shampoo category, adult, premium and anti-dandruff would form a partition. With that in hand, companies define their battlefields more accurately and formulate category strategies more effectively. Consider how a partition analysis allowed a shampoo company to get a sharper view of the competitive landscape (see Figure 4). It previously regarded other incumbent brands as its sole competitors, but the partitions quantified the severity of the challenges posed by local insurgent brands. The brand swiftly reformulated its strategy based on the revised view of the competitive landscape.
Consumer behavior–based market partitions reveal a competitive landscape

Conducting brand due diligence and gap assessment
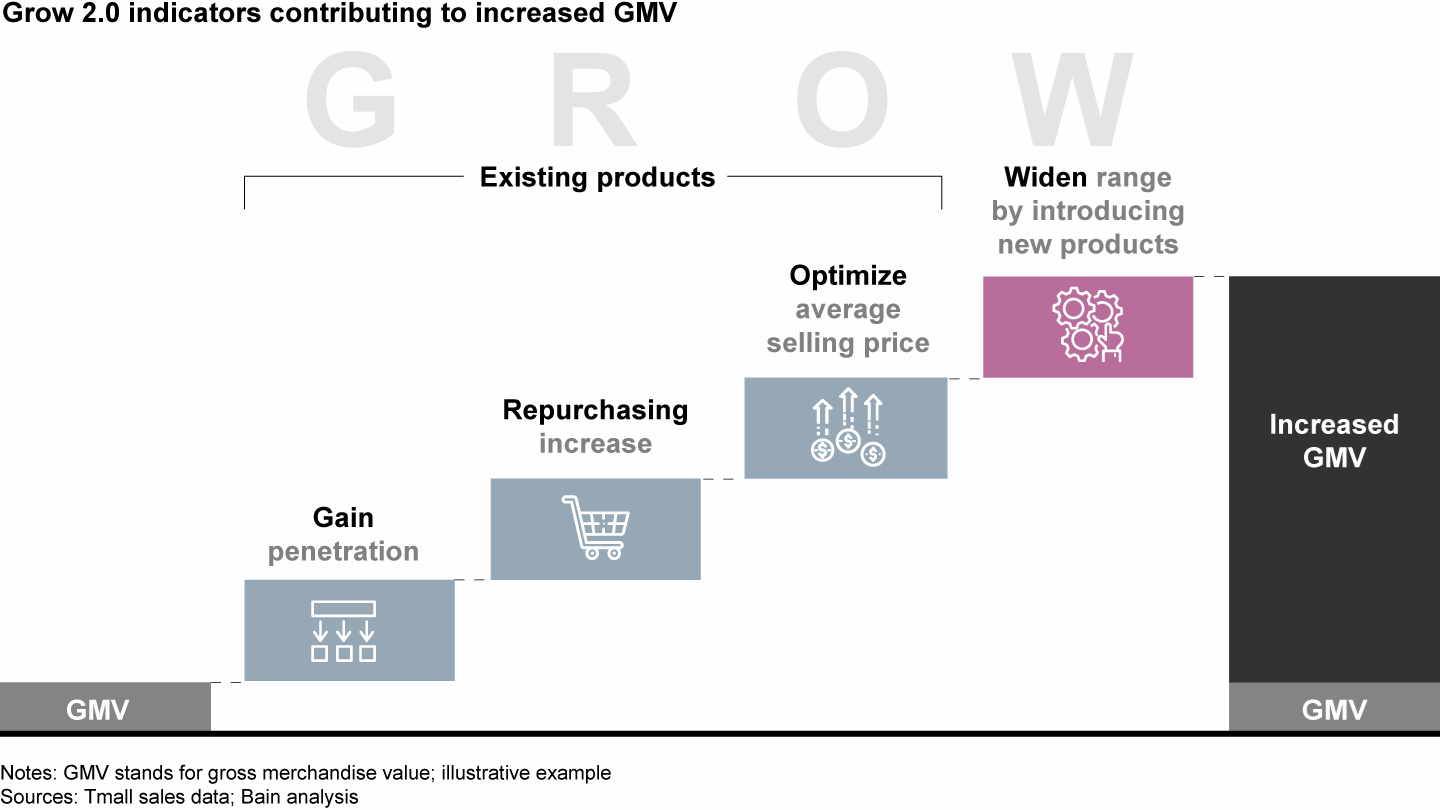
Once a brand knows the category rules and core battlefields, the next step is to examine performance across different consumer groups to find those that contribute the most to growth. Indeed, more companies would do a better job of growing their brands online if they knew in real time how much of their growth for each product came from gains in household penetration, how much came from retaining consumers, how much came from selling higher-priced goods and how much came from new products—and where they stand vis-à-vis their competitors in all of these areas at any given time.
By continually tracking how penetration, repurchasing, value per transaction and new products contribute to value growth over time, brands not only measure their own performance across different customer segments on a product category and subcategory basis but also compare themselves with competitors (see Figures 5 and 6). That helps them immediately to see the gaps they need to fill and the potential they can achieve in each of the four areas.
Grow 2.0 indicators show four ways to grow a product

Grow 2.0 ranking enables brands to evaluate current performance and identify growth potentials

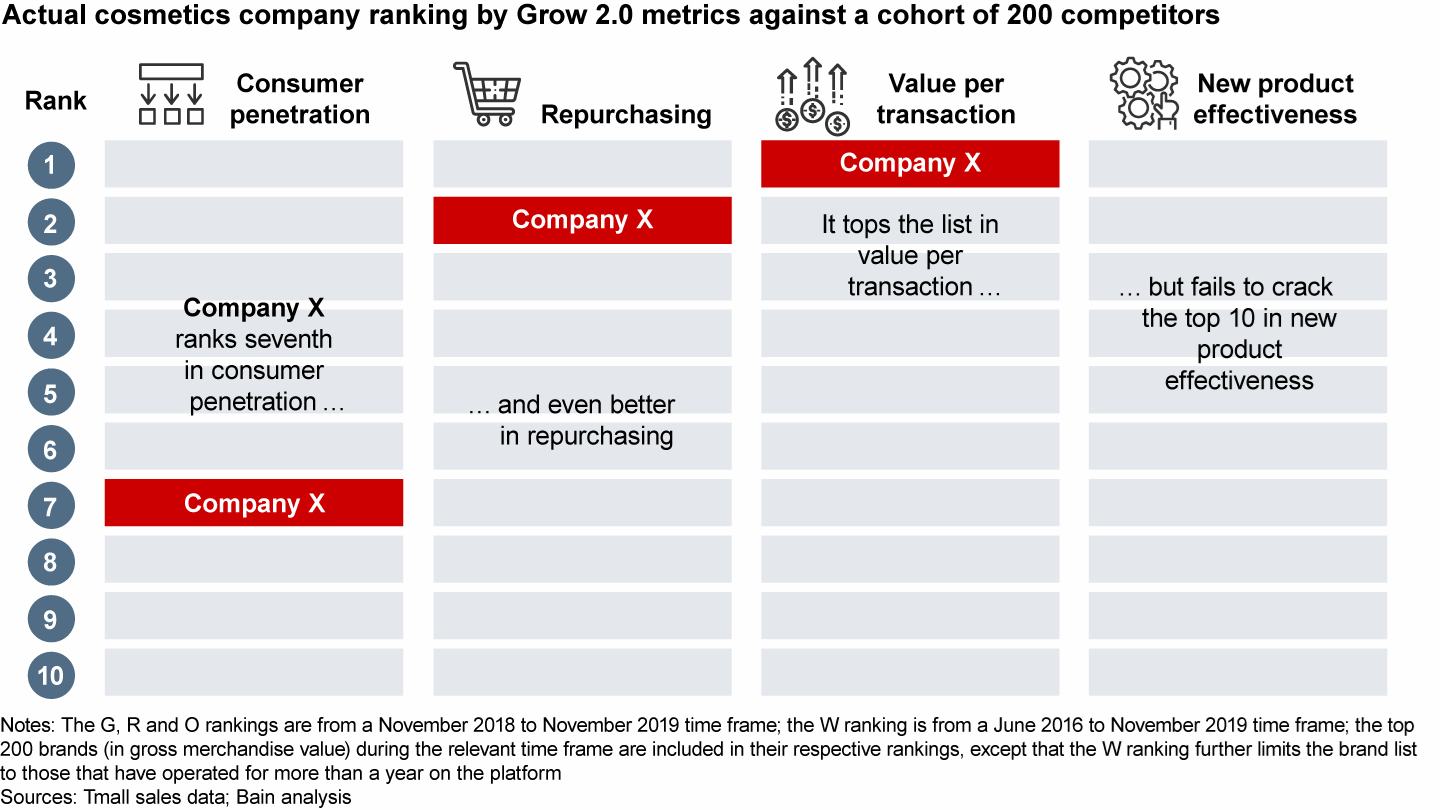
Gains. The first step is to look at gains in household penetration. Penetration is king, especially in online categories in which consumer loyalty is low. (Penetration is defined as the percentage of households in a market buying a particular brand in a given year.) Increasing penetration is the primary way to build big brands. The importance of penetration is a key insight from the research of the Ehrenberg-Bass Institute for Marketing Science, summarized by Professor Byron Sharp, director of the Institute, in his book How Brands Grow, based on decades of observations of buying behavior. When a company sees that it has a low “G” (gains), the best options often are to enhance the category and expand into new categories, for example.
Lancôme and Estée Lauder are the top two beauty companies on the “G” list of the color cosmetics product category (based on Tmall sales). They became penetration leaders by focusing on attracting new consumers to their stronghold product categories. Meanwhile, two local insurgent brands, Perfect Diary and AFU, hold the No. 3 and No. 4 positions in the same category. They made their penetration gains by strengthening their core products while also expanding into new categories that allowed for cross-selling.
Repurchasing. Next, companies look at how much value they gain from increases in repurchasing—and how much of that comes from existing customers vs. new consumers. The findings help brands determine what works (and what doesn’t work) in managing consumer relationships. Perfect Diary holds the top position on the “R” (repurchasing) list in color cosmetics. Its success comes from a strategy of using value-for-money pricing to encourage repurchasing.
Optimize. Brands also evaluate the rate at which consumers trade up to higher-priced products. By focusing on hero SKUs—that is, any company’s best sellers—with higher average selling prices, L’Oréal gained the top “O” (optimize) list position in the beauty category. It learned that new consumers, particularly moms, were a big force behind boosting value per transaction. Overall, Tmall sales data shows that for many of the companies on the top 10 list, new consumers are more important than existing consumers in spurring trading-up sales.
Widen. Finally, brands measure how effectively their new products contribute to value growth by attracting new consumers. The top three brands on the “W” (widen) list in color cosmetics achieve more than 50% of their value growth gains from new customer acquisitions generated by new products.
Quantifying the brand's full potential
Determining the headroom for growth in core battlefields helps brands foresee potential risks and take prudent actions. Brands can select the most relevant benchmarks based on their own growth ambitions and categories (and their strengths), relying on the Grow 2.0 indicators. In loyalty categories, it typically makes sense to set growth levels based on penetration and repurchase rates, while in repertoire categories, the growth potential should revolve around penetration and value per transaction. Quantifying a brand’s full potential helps companies guide resource planning as well as the design of their implementation roadmap.
How to win?
The brand digital growth accelerator also helps brands lay out a clear path for winning. With category rules and core battlefields identified, companies can improve their value propositions because they can generate precise insights into how best to convey the core brand values to different consumer groups. They enhance product portfolios by adapting to changing consumer expectations, using innovation and sound pricing and promotion strategies. They create a winning online consumer experience, relying on the optimal mix of touchpoints to reach consumers at every stage of their journey. It all comes down to consumers, products and marketing/promotions.
Consumers
Consumers are at the heart of any how-to-win decision. Now brands can effectively use newly available data to update their consumer segmentation based on how they perform in each category and subsegment.
Strategic consumer insights. In our first China Online Shopper Report, 2019 Online Strategic Consumer Groups Report: Innovate for Consumers with Insights from Big Data, we drew on proprietary Alibaba data to paint the clearest picture ever of who China’s online shoppers are, how they shop and what it all means for companies hoping to sell to them. We drew key insights from the data produced by hundreds of millions of Tmall and Taobao consumers. It was the first time that this unparalleled data mine was made available for systematic analysis. Combined with our insights gained from working with consumer goods and retail companies in China, that data enabled us to identify eight strategic consumer groups in three clusters.
Now companies can use that same consumer segmentation in increasingly sophisticated ways to improve their consumer-centric approaches to winning.
Some are broadening their consumer definitions. For example, instead of simply tracking traditional demographics such as gender, age and location, they now group consumers based on how they interact along the entire consumer “AIPL” journey: awareness (browsing activities), interest (searching), purchase, loyalty (membership and repurchasing). They create a far more advanced segmentation by clustering consumers according to similarities on multiple dimensions. Some are analyzing strategic consumer groups with finer granularity. By zooming in on different categories and subcategories, brands can develop more precise consumer insights. They conduct deep dives into those four Grow 2.0 indicators, generating insights at different consumer group levels.
Enhanced brand assets. With greater buying power and discriminating taste, more consumers expect a brand to offer value beyond simple functionality. To understand what truly underpins a consumer’s perception of value, Bain identified 30 fundamental types of value in their most essential and discrete forms. These Elements of Value® fall into four categories from the most fundamental to the most advanced: functional (for instance, product quality), emotional (for instance, badge value), life changing (for instance, heirloom) and social impact (for instance, self-transcendence).
In general, the more elements and the higher level (life changing and social impact) that a brand can deliver, the better the performance. Brands can evaluate performance and reshape their core values based on the true voice of consumers gleaned from big data tools and other analytical approaches (for instance, focus groups), and then adapt their marketing mix to the core brand values identified (see the Harvard Business Review article “The Elements of Value”).
A skin care company used the Elements of Value to confirm its high-end positioning with online consumers. The big data–enabled insights showed that the company delivered more Elements of Value and at a higher level—such as the life-changing element of self-actualization and the emotional element of design/aesthetics—than its competitors did (see Figure 7).
An Elements of Value® analysis helped a skin care company confirm its high-end positioning

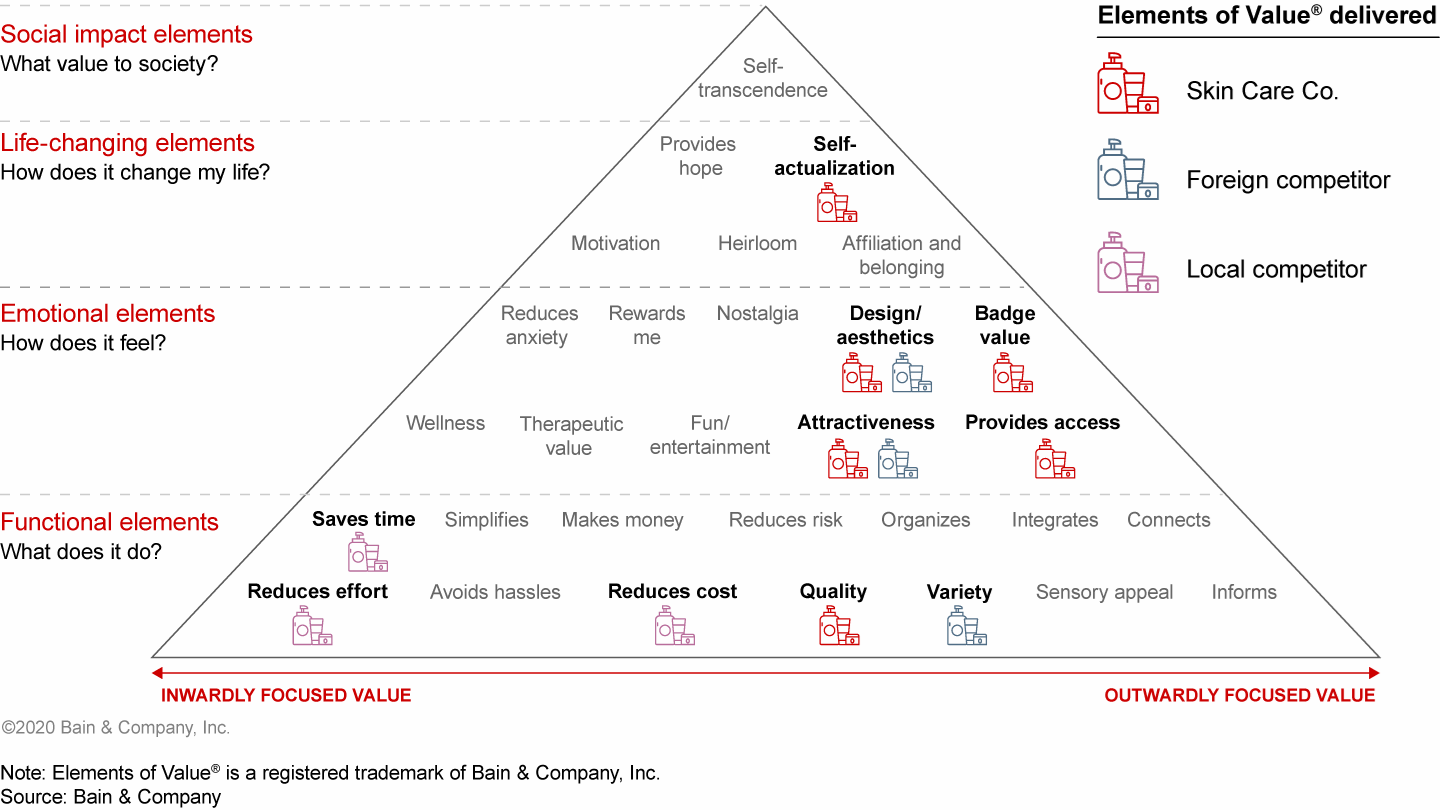
Those findings led the company to reevaluate its online brand communication, and helped it diagnose discrepancies between online and offline marketing messages. The company adjusted its online marketing messages and mix to ensure consistency with its high-end positioning.
Customized brand communication. Brands can also customize brand communications by combining their core brand values with insights into how consumers decide. They can determine the Elements of Value that are critical to specific consumer groups and communicate to those groups accordingly.
To see this process in action, consider the case of a facial mask company. An Elements of Value analysis helped the company identify core brand values (among them: attractiveness, design/aesthetics). Subsequently, a consumer market partition analysis on Gen Z and Rookie White Collars—its core groups—showed that the key decision factors for Gen Z are low prices (value for money) and satisfying basic needs. For their part, Rookie White Collars prioritize mid- to high-end products and are highly concerned about sourcing and ingredients. Based on these insights, the company developed customized communication strategies. For Gen Z consumers, it increased promotions and enlisted relevant key opinion leaders. For Rookie White Collar consumers, it made sourcing and ingredients a major feature in its communications.
Products
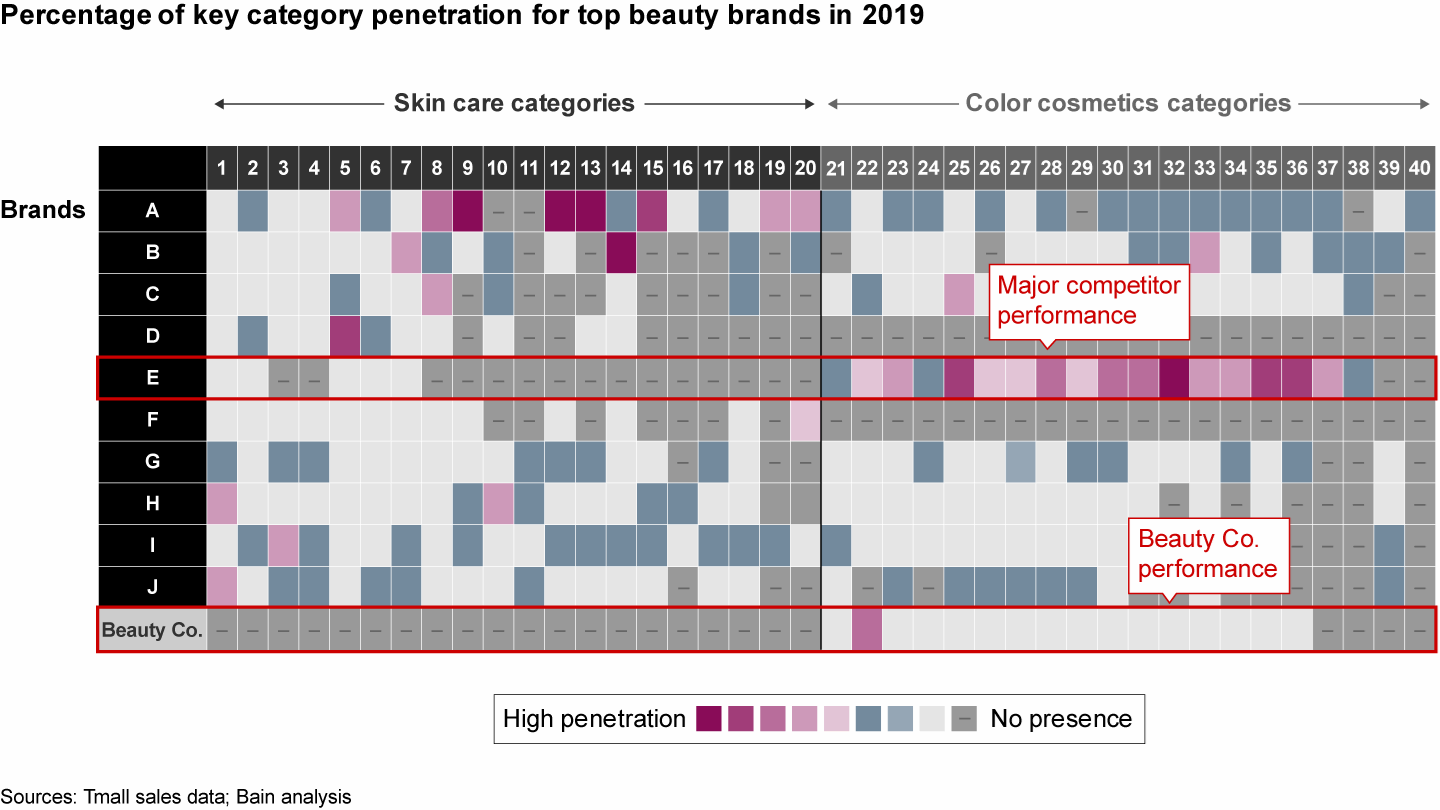
A brand conveys its value proposition and meets consumer needs through its products. To target and prioritize ways to optimize the product portfolio, brands can focus on two critical views of consumption data. An industry best practices dashboard gives brands a full picture into all brands’ penetration in each subcategory. It allows a brand to compare its performance with leading players, identify strategic priorities, chart an implementation roadmap and allocate resources accordingly (see Figure 8).
An industry best practices dashboard reveals the sharp contrasts between a company and a major industry competitor

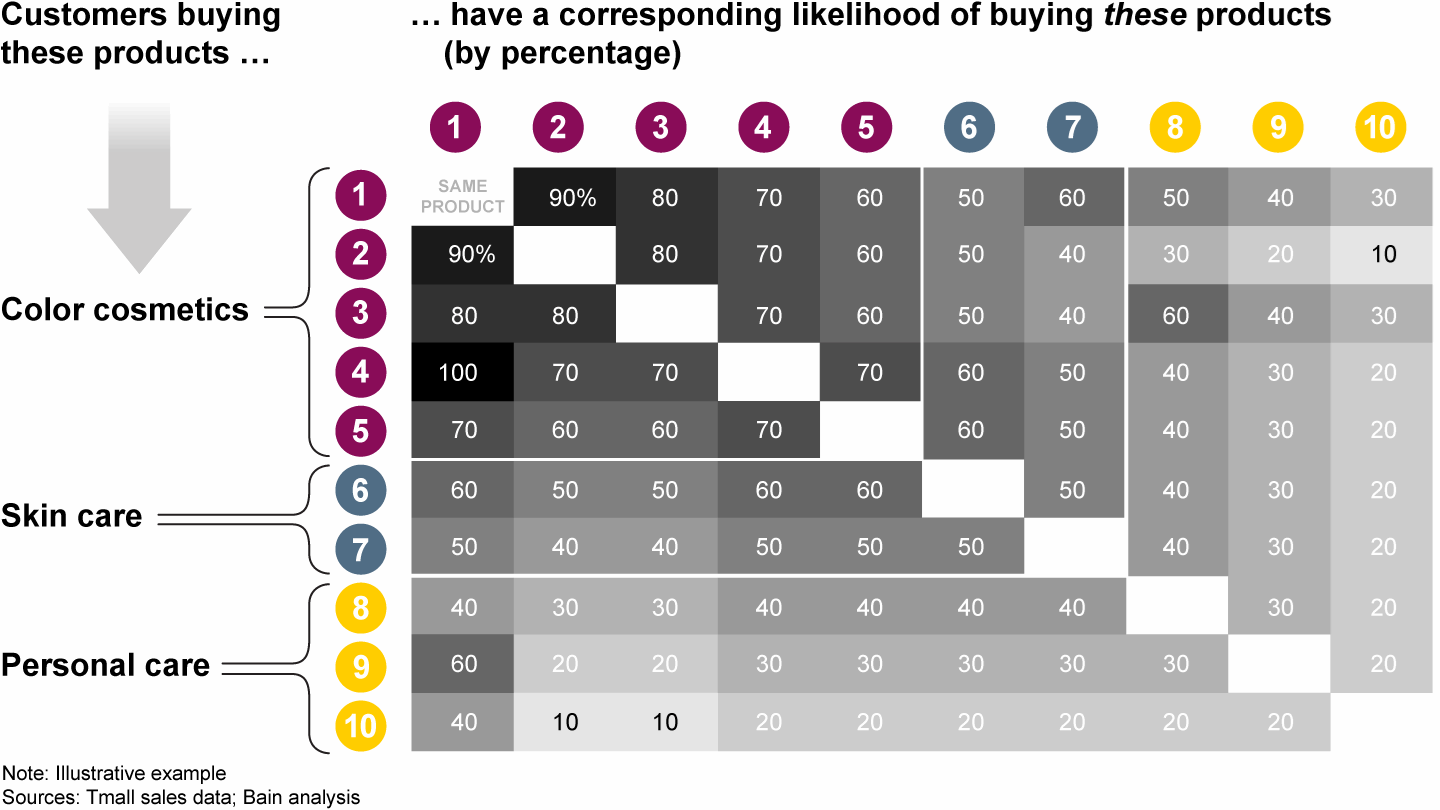
Meanwhile, a category relevancy heat map shows how consumers make cross-category purchases. This enables brands to see the best options for expanding into adjacent categories (see Figure 9). With an enhanced product portfolio in place, companies design their product innovation and pricing and promotion strategy to strike the right balance between product quality and price. Whether they go deeper into existing categories or expand into new ones, brands need to factor their overall capabilities, such as management expertise or R&D strength, into the equation.
A category relevancy heat map helps brands develop category expansion strategies

Product portfolio optimization. Companies use a three-step roadmap to help them enhance product portfolios.
- Step No. 1: Identify growth opportunities. Will a company better meet the needs of its core consumer groups by enhancing an existing category or expanding into a new category?
Brands can benchmark against leading players to identify performance improvement opportunities in existing categories. The industry best practices dashboard gives a full picture of a brand’s consumer penetration in each subcategory and consumer group to compare performance with leading players, identify strategic priorities and allocate resources accordingly.
Given the potential for revenue and cost synergies, sometimes expanding into adjacent categories is an attractive option. A category relevancy heat map defines adjacencies. Real consumer cross-category purchasing behavior allows companies to observe the relevancy of different categories with specific consumer groups. Not only can brands identify potential categories to enter but they also can borrow ideas for cross-category marketing campaigns. - Step No. 2: Prioritize growth opportunities. With a long list of growth opportunities in hand, brands must determine which ones to pursue. To help them decide, companies evaluate their overall ability to seize a particular opportunity—for example, their management expertise and R&D capability—and the growth potential the opportunity can bring to a product or category.
- Step No. 3: Implement initiatives design. Industry best practice benchmarking helps a company pinpoint the key implementation actions in everything from R&D and production planning to sales and marketing. Cross-category benchmarking is also available. Moreover, brands can look further ahead by planning resources in advance for high-potential categories.
Product innovation activation. To innovate at the rapid pace that online retailing demands, some companies use Tmall as a low-cost and efficient platform for new product development and testing while also applying micro-battles to achieve quick wins and to scale with fast iterations.
Pricing realization and promotion effectiveness. Pricing and promotion decisions are critical in the online channel, in which information is highly transparent and switching costs are relatively low. Companies use consumer transaction data to help answer key questions swiftly—namely, when, what, where and by how much. Monitoring results at the SKU level, they compare a brand’s performance with the industry average in key indicators such as SKU gross merchandise value or SKU conversion rates, and they can see automatically the best pricing and promotion path to take.
Marketing and promotions
To build a strong bridge to consumers, brands use data to match the consumers they want to reach with the best way to reach them, deploying the ideal mix of touchpoints along the consumer journey for a seamless omnichannel experience. They use data to determine how their consumers decide. They redesign online store layouts, categorizing products based on what drives consumer decisions rather than basic product attributes, for example. They customize communications, promotion and pricing strategies based on consumer preference. They identify the most efficient promotion and marketing tools along each step of the consumer journey for different consumer archetypes, prioritizing high-potential consumer groups.
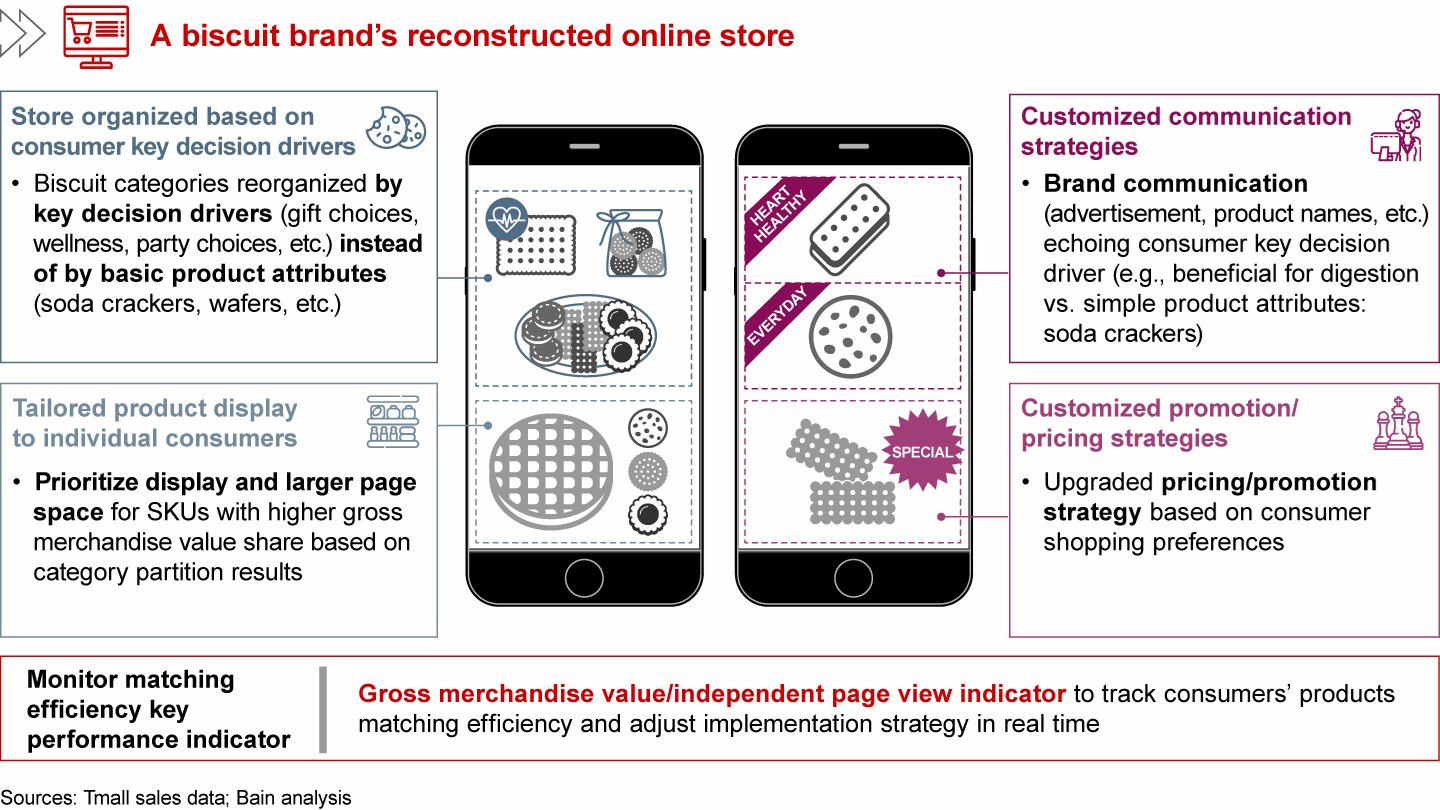
Perfect online execution. Consumer-based market partitions enable a company to construct the best possible consumer-centric online store. Companies redesign store layouts, categorizing products based on occasions rather than basic product attributes. They highlight SKUs that contribute a higher share of gross merchandise value. Companies also tailor layouts to individual consumers by further breaking down market partitions into consumer groups, channels and regions. Likewise, communications, promotions and pricing strategies are customized based on consumer preferences. Each of these elements of sales execution can be dynamically adjusted as consumer data changes.
A biscuit company relied on consumer-based market partitions to redesign its online store according to how online shoppers actually bought its products. It previously constructed digital store layouts based on basic product attributes—soda crackers and wafers, for example. After identifying key consumer decision factors as part of a partition analysis, the biscuit brand redesigned its online store around categories such as gift choices, party choices and wellness. It also customized its communications, replacing standard product attributes with identified decision factors such as “beneficial for digestion.” In addition, the biscuit brand customized online store pricing and promotions based on consumers’ shopping preferences (see Figure 10). Such companies quantify the relationship between gross merchandise value and independent page views to evaluate the efficiency of online store execution, making timely adjustments with the help of real-time big data monitoring and analysis.
A biscuit brand used key consumer decision factors to help it design a more effective online store

Precision marketing. Precision marketing enables companies to select an optimal mix of touchpoints to target individual consumers. In contrast with the inefficiency of traditional mass marketing, precision marketing identifies the most effective promotion and marketing tools along each step of the AIPL journey for each consumer archetype.
Brands navigate through precision marketing by following three steps:
- Step No. 1: Pinpoint high-potential consumer groups. These are consumers with high spending power who align with a brand’s core values and high spending power.
- Step No. 2: Identify the most effective marketing and promotion channel. That means the channels with the highest conversion rate at each stage of the AIPL journey.
- Step No. 3: Optimize marketing based on a brand’s unique situation. That involves screening key marketing channels based on importance and “manageability” (a brand’s ability to control the relevant marketing resources). For example, livestreaming can be a key channel; it is both important and manageable, with key opinion leader selections and streaming schedules that easily can be changed.
Omnichannel marketing. Brands require omnichannel marketing. Grow 2.0 relies on platforms in the Alibaba ecosystem to integrate online resources (Smart Diamond, Keyword pop-ups, Brand Zone), online touchpoints (Alipay and Ele.me) and offline options (Focus Media displays). The goal is to improve everything from new consumer recruitment to consumer value improvement along the full AIPL journey. A customer lifetime value engine, codeveloped by Bain and Alibaba, uses omnichannel big data to generate consumer insights aimed at helping companies boost consumers’ lifetime value.
Results Delivery®
Finally, with growth strategies and initiatives in place, brands need efficient implementation to deliver results and monitor progress.
A brand asset dashboard arms brands to track real-time results and make adjustments along the full consumer journey. Populated with data generated by hundreds of millions of online consumers and analyzed from granularity down to brand and SKU level, the dashboard ensures that consumer goods companies keep moving in the right direction. Consumers click and browse, search for products, inquire about products, add products to their list of favorites, add them to shopping carts, complete purchases, recommend products, join loyalty programs and become active members. Companies scrupulously track the data for each action along that journey, comparing everything with historical data and industry averages. They course correct when necessary.
In fast-changing consumer markets, the best companies use nimble micro-battles to identify and implement opportunities. Micro-battles rely on cross-functional and flat teams that are capable of delivering quick responses to market changes. Fewer resources means no disruption to daily operations. The teams focus their efforts on a few selected themes at a time, with fast tests to scale successes or learn the lessons that will help them win the next battle. They also can seamlessly integrate with (and gain support from) a wider ecosystem—including data insight service providers, content creators, customer relationship management and omnichannel marketing vendors, and operations vendors along the value chain—to maximize synergies. The end-to-end solution enabled by an ecosystem is as beneficial to insurgent brands starting from scratch as it is to large and established consumer goods companies.
As brands accelerate their journey to online and new retail, those that make the fastest and best-informed strategic decisions will be the ones that get there first and outperform. The flow of transaction data is intensifying. Some brands will take a rigorous and systematic approach to turning that data into the insights that dictate digital strategy. Other brands will be left behind.
Derek Deng and Jason Ding are Bain & Company partners based in Shanghai and Beijing, respectively, and members of the firm’s Consumer Products practice.
Elements of Value® is a registered trademark of Bain & Company, Inc.
Results Delivery® is a registered trademark of Bain & Company, Inc.