Report

This article is Section 2.5 of Bain’s 2020 Global Private Equity Report.
Staying ahead of the curve has always been critical in private equity. Understanding how markets and ecosystems are shifting, predicting how customer behavior is evolving, anticipating trends in technology—all of these factors are essential to buying well and creating value during the holding period.
What’s different today is the sheer power of technology and innovation to upend entire industries with a speed and magnitude that can be blinding. We all know the usual suspects; shooting stars like Amazon, Apple, Uber and Netflix have fundamentally changed how we live our lives. But few industries these days are sheltered from the impact of technology-fueled innovation. Railroads are coupling IoT technology with advanced analytics to dramatically drive down costs. Sensors and GPS technology are complementing genetics as disruptive forces in agriculture. Fracking technology has shifted global fortunes in oil and gas. Affordable lithium battery technology threatens to transform just about anything that moves.
The implications for private equity are clear: No portfolio company or target is immune to disruption. Change may come sooner or it may come later, but it will come eventually, shifting profit pools, altering customer preferences, bending cost curves and reshaping how companies compete.
It is also likely to come faster than you think. Consider that the average time from tipping point—the moment when sales of a new technology take off—to 80% of maximum adoption has dropped from 18 years in the mid-20th century to about 8 years since 2000. Too often, capital impairment stems from ignoring the signals or underestimating how quickly a new technology can gain traction and blow things up.
It’s obviously not easy to peer into the future and spot emerging technologies—or nontech innovations, for that matter. But it is possible to apply a structured approach to due diligence that can help you identify disruptive patterns in any industry and understand how they will affect your investment.
Innovation often feels like it comes out of the blue, but that’s rarely the case. Most sources of disruption are evident long before they reach the tipping point that accelerates wide-scale adoption. We know that electric cars and trucks are coming. It’s plain that big data and analytics are transforming the insurance business. The real question for PE funds is if, when and how these key trends may disrupt a specific industry.
Developing confidence around these issues starts with breaking the problem down into a pair of important inquiries. First, where is disruption coming from, and what sort of impact will it have? Second, when will this innovation reach its tipping point, based on both the strength of its appeal and the barriers or accelerators to broader adoption?
Together, these analyses give deal teams insight into what a target is really worth in a changing world and whether that value is already baked into its multiple. They point the way to the most future-proof value-creation plan during ownership and suggest how a company might be best positioned when it comes time to exit. Critically, they also help acquirers think through an important question: Is this company destined to be disrupted, or is there opportunity to build it into a disrupter?
A better mousetrap
Funds that stay ahead of the curve tend to view the future differently than others. They analyze potential disruption from a future-back perspective. Most analyses of future scenarios start with today’s status quo and extrapolate forward, assuming incremental change in current offerings. That perspective is certainly essential, but it’s also important to think well beyond the incremental.
Starting with an assessment of the raw customer need, a future-back analysis looks 10 to 20 years out, asking, “Where is disruption most likely to come from, and how might it fundamentally alter how winning companies deliver solutions in this industry?” Funds can look for early signals across six key aspects of the business environment (see Figure 2.21).
Six key inquiries in diligence can identify where disruption is coming from and what its impact might be
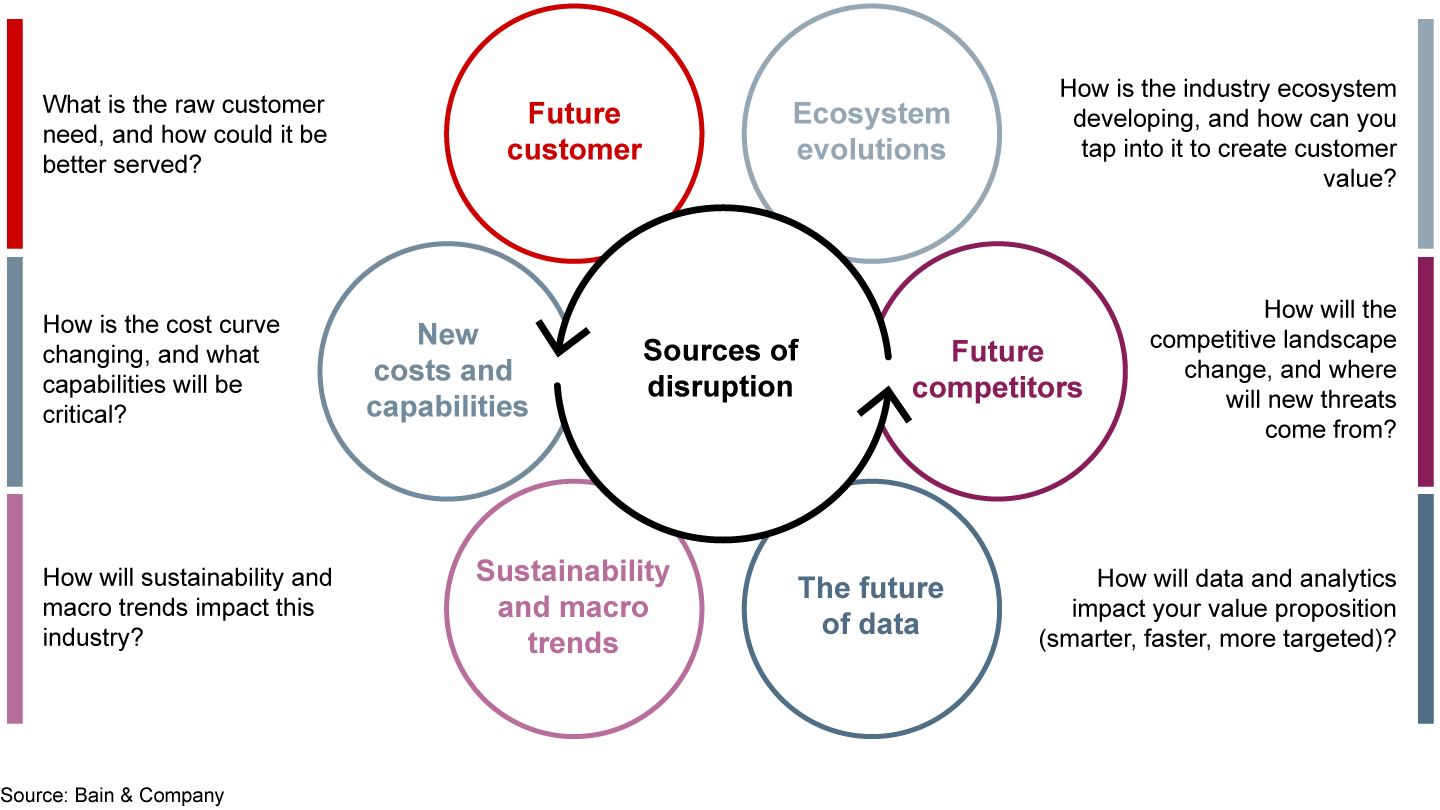
Raw customer needs are the basic requirements that drive human behavior and compel people to action. They are the essence of what a customer values, independent of how the need is addressed today. Raw needs don’t change; people’s expectations do. As the world evolves and technologies alter how we experience it, the best companies will continuously innovate to solve for shifting expectations.
That was Netflix’s critical insight. Why compete on Blockbuster’s terms (stores) or even sit still with our own disruptive vision (DVD shipping) when we can use emerging technology advances (streaming) to redefine the industry again? From its founding, Netflix plumbed the raw customer need (“I want to be entertained right now!”) and figured out how to satisfy it much more compellingly. Evolving technology loosened the constraints and Netflix evolved with it, setting new expectations and fulfilling them at every step.
The old mousetrap aphorism captures the notion of raw customer need nicely: Build a better mousetrap, and the world will beat a path to your door. Until then, mousetraps get the job done just fine, thank you very much. When EQT bought Anticimex Group in 2012, the company saw a better-mousetrap opportunity—literally. At the time, Anticimex was Northern Europe’s leading provider of pest control services for the food industry. The most obvious value-creation opportunity was a traditional one: build scale and enhance revenue growth through a global buy-and-build strategy. Under EQT, the company proceeded to buy more than 200 traditional rivals over the next seven years.
Yet EQT’s backing also enabled Anticimex to develop and accelerate a truly disruptive strategy. Like Netflix and streaming, it met the raw customer need—eliminating vermin—in a much better way. The company’s traditional business involved placing traps with poison around a food manufacturing facility and monitoring them regularly for activity. That worked fine but had obvious drawbacks, most notably putting poison close to food. The advent of IoT sensors and other communications technologies opened the door to an electronic solution, where rodents enter a trap and set off a signal to a central system.
This innovation eliminates the need for monthly physical inspections. Instead, the devices monitor the environment continuously, and there’s no poison involved. The data collected also allows companies to diagnose problems and act against infestations much earlier. The solution does require a larger up-front investment from customers, but automated surveillance identifies problems before they get out of control, reducing the cost to fix them. The system also cuts labor costs by up to 75%.
Fully understanding this opportunity in the context of industry dynamics was critical to EQT’s risk assessment. It gave the firm confidence in the disruptive potential of the new solution and the investment it would take to get there.
Following the money
One powerful way to anticipate disruption in a given industry is to know what the competition is doing—both incumbents and start-ups. Taking a measure of investment tells you how much venture capitalists and smart CEOs are betting against the status quo, while providing valuable clues about specific innovations. Talking with customers and competitors, along with reviewing press releases and other reports, can reveal if existing competitors are doing anything disruptive. Several powerful databases can identify important patterns in venture capital spending. Often, the persistence of VC investment highlights a technology or business model that the broader market simply can’t get its head around—at first anyway.
A good example is Peloton. It’s easy to look at this high-flying company today and appreciate its impact on the exercise industry. But founder John Foley had a hard time finding believers when the company launched in 2012. Peloton made $2,000 exercise bikes linked via the Internet to a stream of live and recorded classes with top instructors, available via monthly subscription. The slick machine and its high-quality interface allowed riders to exercise at home and track meaningful data, while tapping into the motivational energy of professional trainers.
Although white-glove home delivery and the product’s hip vibe generated strong loyalty among customers, many investors worried that Peloton was essentially a niche product. How many people, after all, could afford to lay out $2,000, plus a monthly fee?
Foley’s vision was different. He argued that busy working couples craved exercise but didn’t have time to go to the gym. If you could recreate a motivational experience at home, they could drop their gym memberships and actually save money over the long run. As the idea gained traction, more venture capital flowed in at ever-increasing multiples, suggesting that something disruptive was going on.
For a team of PE investors looking to provide a capital infusion, the investment thesis got flipped on its head. This wasn’t a cooler (but pricey) version of what had come before. It was a powerful, technology-enabled business model with the potential to transform an industry never known for its innovation.
Determining the tipping point
For PE investors with tight three- to five-year deal cycles, determining when a trend or technology may cross the all-important tipping point is critical. Insight comes from understanding cost trends and measuring what customers really value. Will an emerging source of disruption become relevant within a deal’s holding period? Will it be on the horizon at exit, raising questions about the company’s staying power?
Companies and industry experts have used a variety of forecasting tools and economic models over the years to develop rough answers to these questions. But what makes the difference in due diligence is combining the insights from a set of four important tools. Together, they paint the clearest picture of how much impact an innovation may have and when it is likely to gain traction (see Figure 2.22).
A tipping-point analysis blends insights from four key forecasting tools
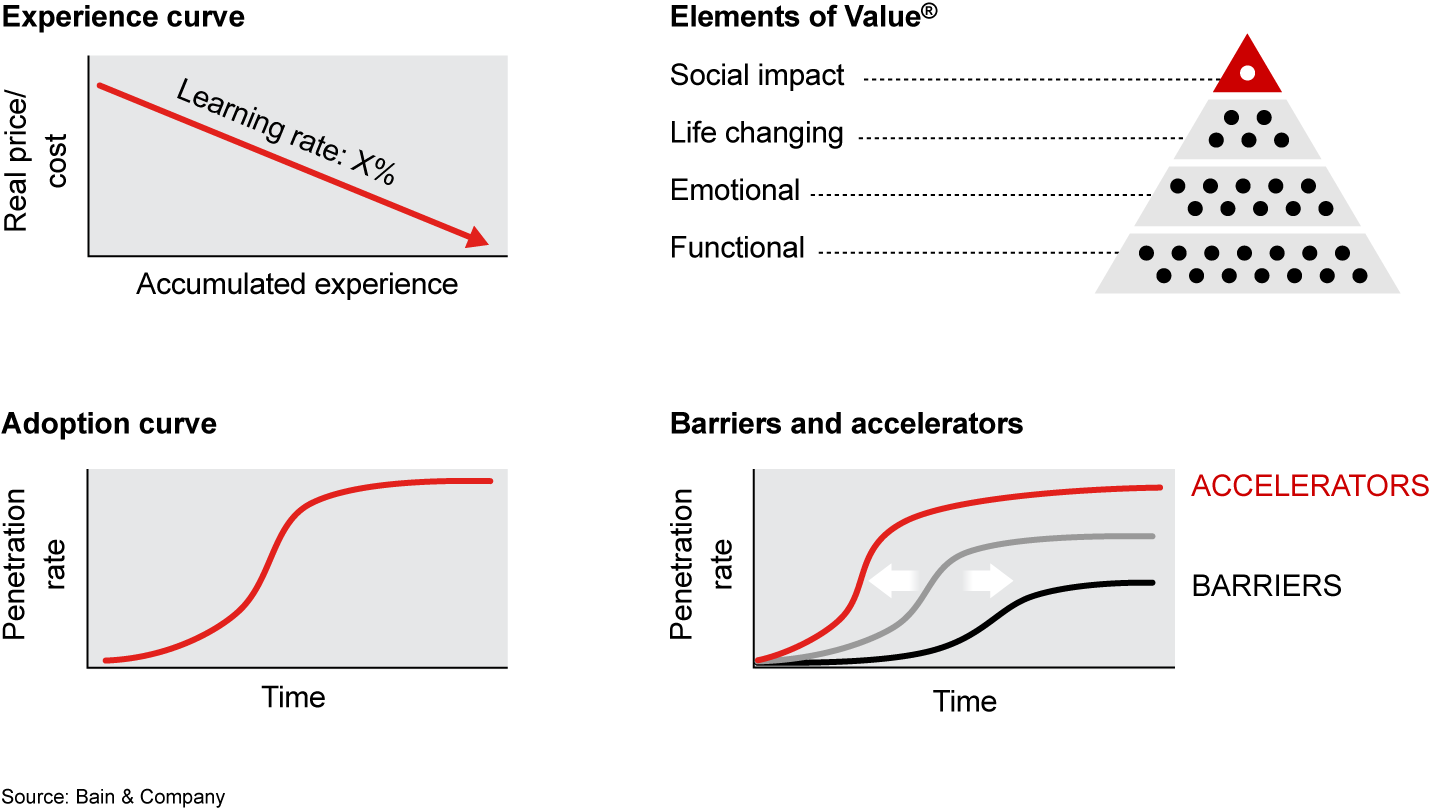
Each of the four tools provides a key part of the puzzle.
- Experience curves (e-curves) show how unit costs decline relative to increased production volume. The more experience companies get producing the innovation, the better they get at doing it cheaply.
- An Elements of Value® analysis defines the attributes customers value most in a product (reduced cost, time savings, sustainability and so on, which determines whether the new innovation delivers better than the status quo).
- Adoption curves (s-curves) use the output from these analyses to help forecast the likely pace of adoption and to estimate saturation points.
- A barriers and accelerators analysis asks what’s getting in the way of this innovation taking over the market and when that might be eliminated so adoption can accelerate. Conversely, is anything imminent—regulation, incentives, political developments—that could become a catalyst for faster adoption?
By artfully blending these insights into an overarching conclusion about what’s coming and when, investors can quantify disruption risk in their deal models and run the most-likely future scenarios.
For The Cranemere Group, a global long-term holding company, this sort of tipping-point analysis was critical in the spring of 2019 as it considered a major investment in Velocity Vehicle Group. Velocity is a commercial vehicle dealership and service organization based in Southern California. Its fundamentals were strong, but it faced a source of uncertainty that was important to thoughtful risk assessment: the rise of electric vehicles (EVs). The question wasn’t if electric technology was coming, but when. What would the implications be for Velocity’s business as the tipping point arrived, and how could Velocity best exploit opportunities created by the transition?
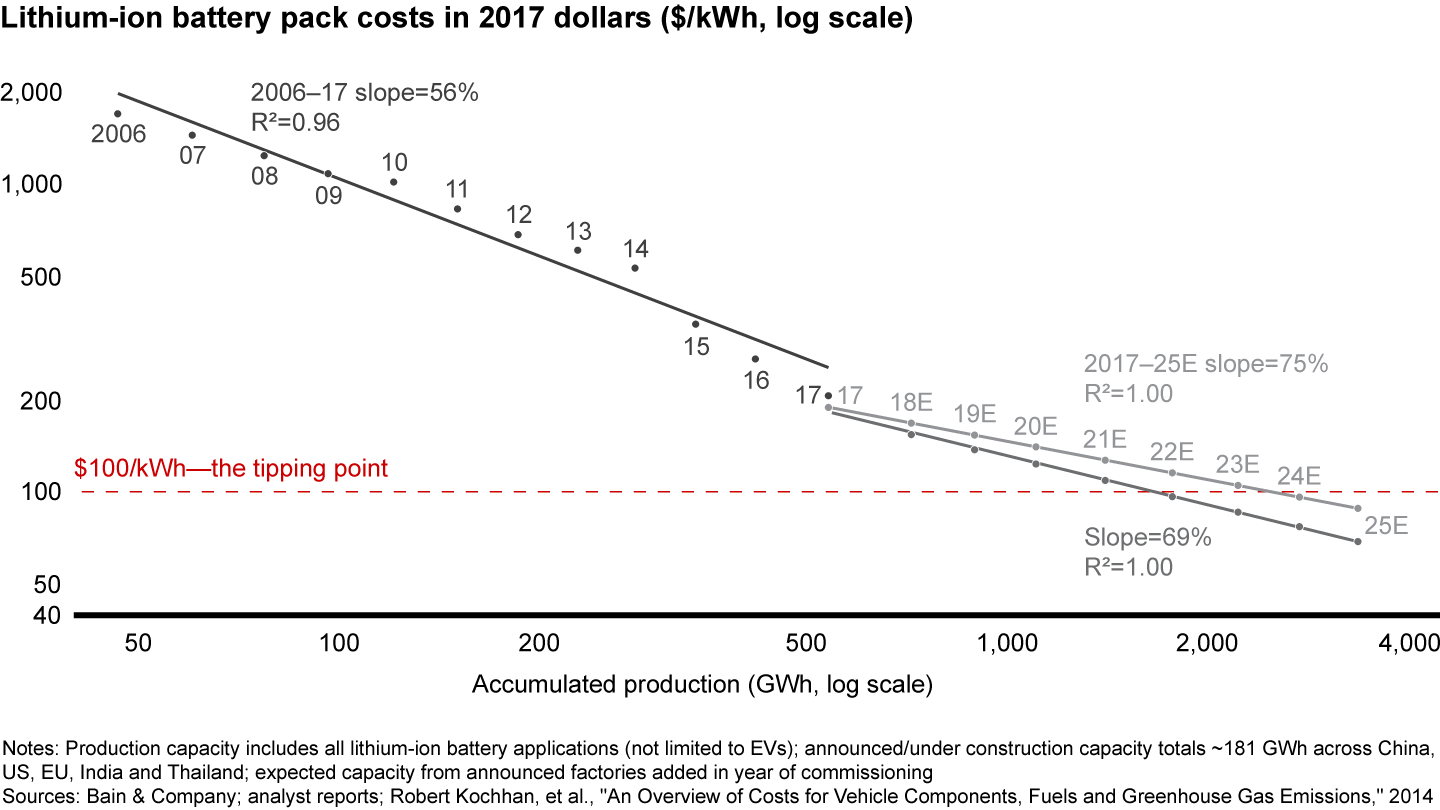
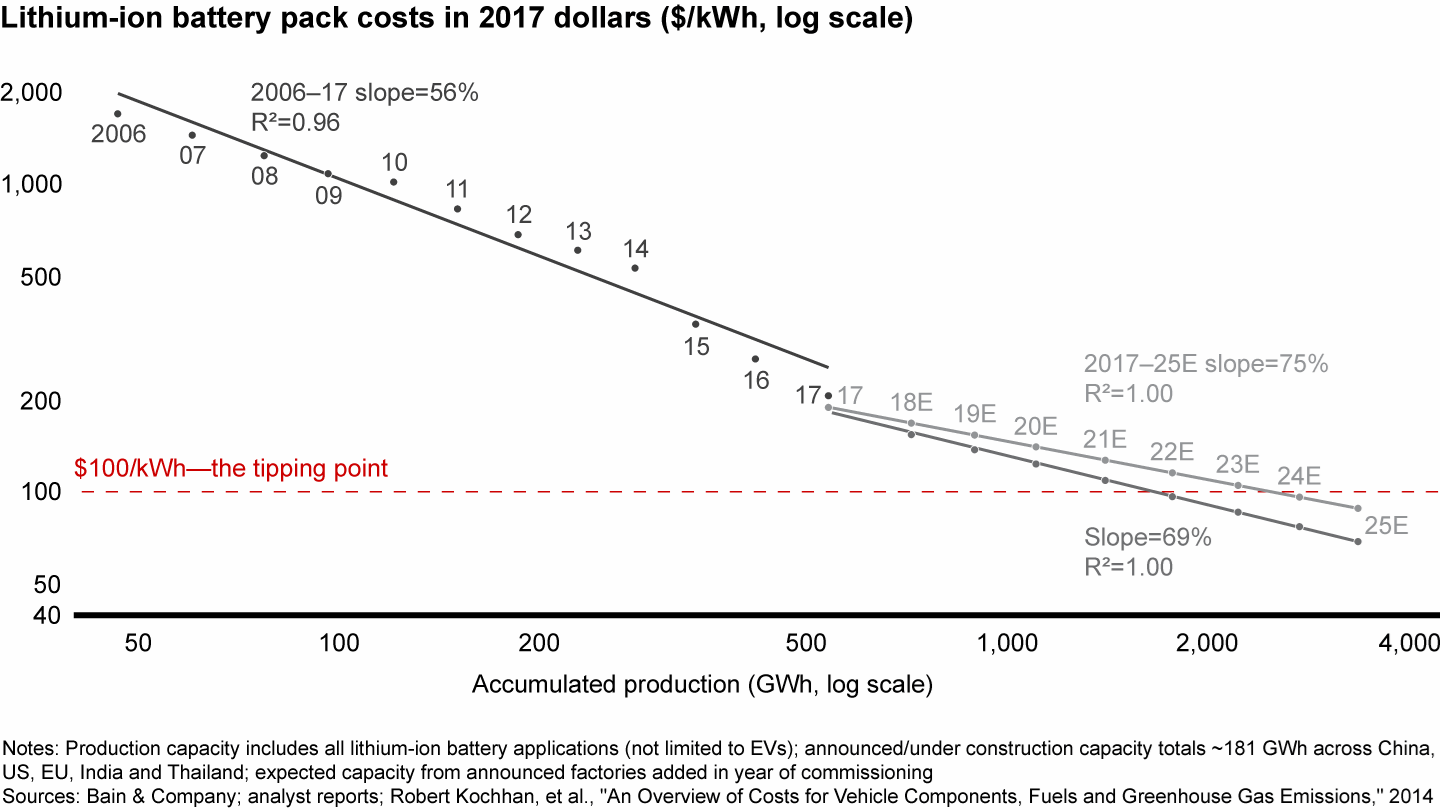
The experience curve played a major role in Cranemere’s analysis. The main reason electric motor technology is more expensive than internal combustion technology is the cost of batteries, which make up between 30% and 50% of an electric vehicle’s retail price. A battery cost of $100 per kilowatt-hour would begin to make electric motor technology competitive with internal combustion engines. The e-curve, which tracks the decline in cost relative to increases in production over time, helped the team determine when the industry might cross that critical threshold. Producers like Tesla and GM had been moving down the curve faster than anyone expected, producing batteries for as little as $125 per kilowatt-hour. The diligence team assumed someone would breach the $100 level in a relevant time frame and developed various scenarios to reflect the most likely range of cost outcomes by 2025 (see Figure 2.23).
Battery costs are falling faster than expected, leading Cranemere to develop different diligence scenarios
Next came an Elements of Value analysis. Electric trucks have some cachet among customers concerned about sustainability. But in the hard-bitten trucking industry, relative feasibility is the critical issue. Because they have fewer moving parts, electric trucks are projected to cost significantly less to maintain than diesel trucks and are more efficient to operate overall. In the local market, where short hauls in stop-and-go traffic are the norm, electric trucks excel—especially given that drivers can take them back to the depot at night for recharging.
For long-haul trips, however, viability falls off the table. Most over-the-road operators keep the truck in motion for the majority of the day, making relatively quick stops to fuel up. Electric trucks must stop every eight hours, and it takes hours to recharge their batteries. Those factors make them unworkable for highway routes, at least in the medium term.
In terms of barriers and accelerators, California’s complex regulatory environment offered both risks and benefits for Velocity. On one hand, the state already has the most stringent emissions requirements in the US, which would tend to serve as an accelerator for electric truck adoption. But in the short run, tougher standards would play to Velocity’s advantage, rendering many trucks on the road obsolete over the next several years and boosting Velocity’s new-truck sales.
Based on these insights, Cranemere’s most likely scenario showed that EVs would make up 20% of Velocity’s new sales by 2030 but only around 5% of the total “truck parc” (vehicles in operation) in the company’s markets. That’s because diesel trucks have 12- to 15-year replacement cycles, meaning that a large number of older models will remain on the road even as sales of EVs ramp up. Given that the majority of Velocity’s profits came from parts and service sales (which depend on the size of the truck parc), this slow shift would provide stability and time for Velocity to make investments to support EVs, while experiencing only modest erosion of its existing diesel and natural gas business.
Other key factors would temper the overall effect on Velocity’s gross profit while creating potential opportunities. Since Velocity’s major OEM partner is a truck maker with a relatively strong electric truck program, Velocity might benefit more than competitors from the EV switchover. The value of servicing those vehicles, however, required a careful analysis. The challenge is that EV servicing conservatively generates about half the revenue diesel servicing provides on a per-unit basis. But because it requires more training and is significantly more complex, there is an opportunity for dealers like Velocity to take share from the largest current providers of truck service—in-house shops run by fleet owners and independent repair shops.
While that would require investment, analysis during due diligence suggested that growth in gross profit margin might be 20 basis points lower as a result of EV adoption. Overall, Cranemere became comfortable that Velocity could successfully navigate the transition with minimal disruption to its historic revenues and profitability.
As much as we would like to have a crystal ball in times as turbulent as these, investors aren’t so lucky. But there are structured, practical ways to gain real confidence about what’s ahead, enabling PE firms to model and rationally evaluate the risks and opportunities born of disruption. For any deal, it pays to use due diligence to assess where innovation is coming from. It is equally important to use tipping-point analysis to gauge when and how disruption might affect your investment.
The relevant information is out there; marshalling it is the challenge. In a highly competitive market, the insights you gain can make all the difference.
Explore the report
More from our 2020 Private Equity Report
Private Equity Report
This article is part of our 2020 Global Private Equity Report.