Private Equity Decarbonization Roadmap
Explore how PMDR can be applied in practice
Explore how PMDR can be applied in practice
Since the Roadmap’s initial release, numerous industry leaders have leveraged the PMDR to facilitate classification and disclosure of their portfolio companies’ decarbonization status quo and progress. See below a selection of public PMDR disclosures across the industry:

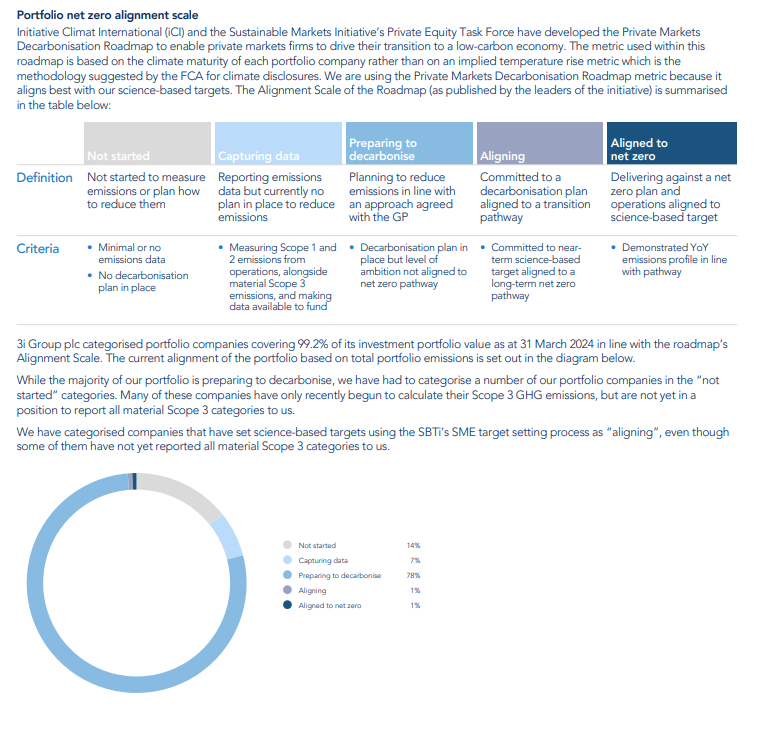
Annual Report and Accounts 2024 (p. 66)
Donut chart showing status quo classification of 3i group’s portfolio along the Alignment Scale
2024 Sustainability Report (p. 41 & 85)
Status quo classification through a bubble chart of Astorg’s portfolio companies along the Alignment Scale based on vintage and carbon footprint, as well as bar chart showing portfolio progress from 2020 to 2023 based on number of portfolio companies

2024 Sustainability Report (p. 12)
Chart below showing portfolio’s alignment to net zero, where each square represents the proportion of financial emissions


2025 Climate Action Report (p. 15-16)
Chart below showing portfolio’s alignment to net zero from 2020 to 2025

Annual Report and Accounts 2024 (p. 66)
Donut chart showing status quo classification of 3i group’s portfolio along the Alignment Scale
2024 Sustainability Report (p. 41 & 85)
Status quo classification through a bubble chart of Astorg’s portfolio companies along the Alignment Scale based on vintage and carbon footprint, as well as bar chart showing portfolio progress from 2020 to 2023 based on number of portfolio companies
2024 Sustainability Report (p. 12)
Chart below showing portfolio’s alignment to net zero, where each square represents the proportion of financial emissions
2025 Climate Action Report (p. 15-16)
Chart below showing portfolio’s alignment to net zero from 2020 to 2025

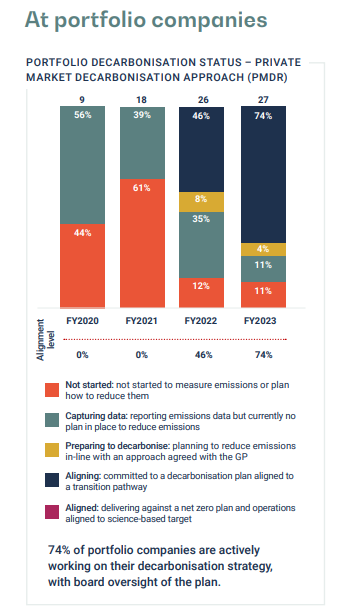
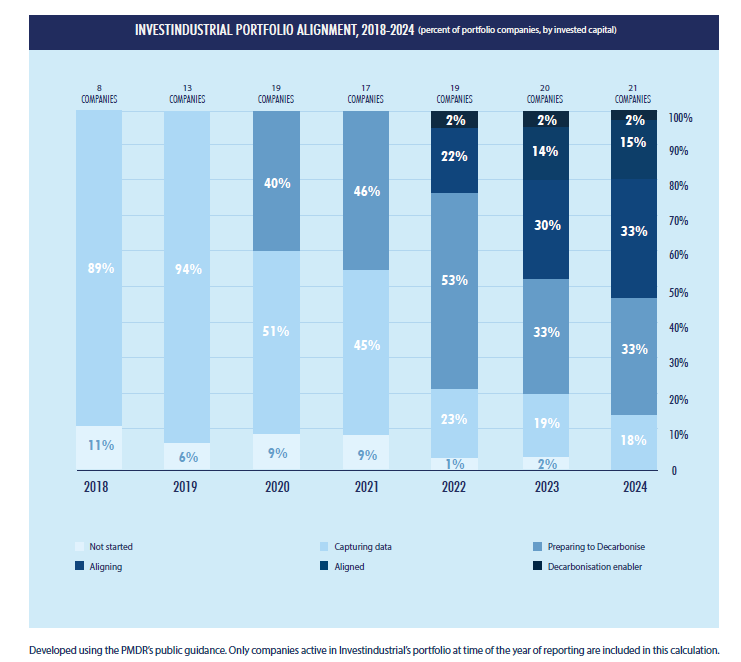
2024 Annual Review & Sustainability Review (p. 109)
Bar chart showing portfolio alignment progress from 2018 to 2024 based on share of invested capital

Company website/LinkedIn post by Sustainability Head
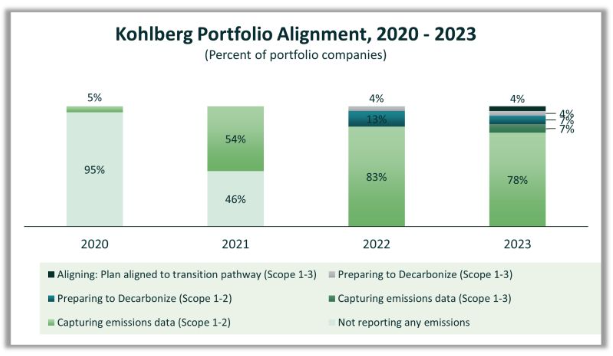
Bar chart showing portfolio alignment progress from 2020 to 2023 based on number of portfolio companies