

Report


|
Резюме
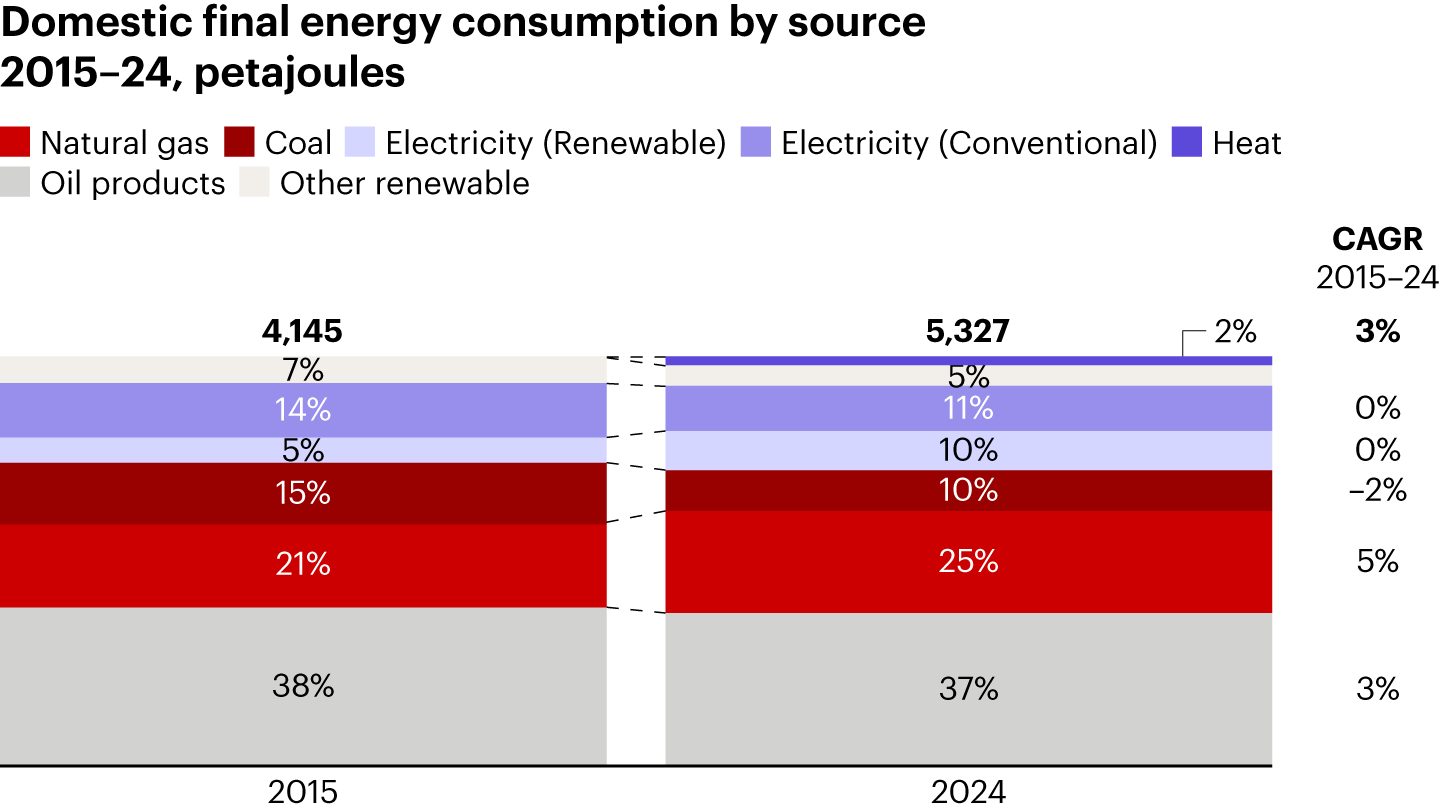
Türkiye met approximately 69% of its energy needs through net imports in 2025. Energy imports totaled roughly $63 billion, leaving a net energy trade deficit of approximately $47 billion after accounting for energy exports. That deficit is one of the largest single pressures on the external balance—and why Türkiye’s net-zero transition is both an economic and an environmental argument. Every unit of imported fossil energy displaced by domestic generation or by efficiency permanently improves that balance. Oil products make up about 37% of domestic energy consumption. Consumption of natural gas as a transition fuel has increased since 2015 (see Figure 1). This reliance exposes Türkiye to commodity price volatility, geopolitical instability, and exchange rate fluctuations simultaneously.
Figure 1

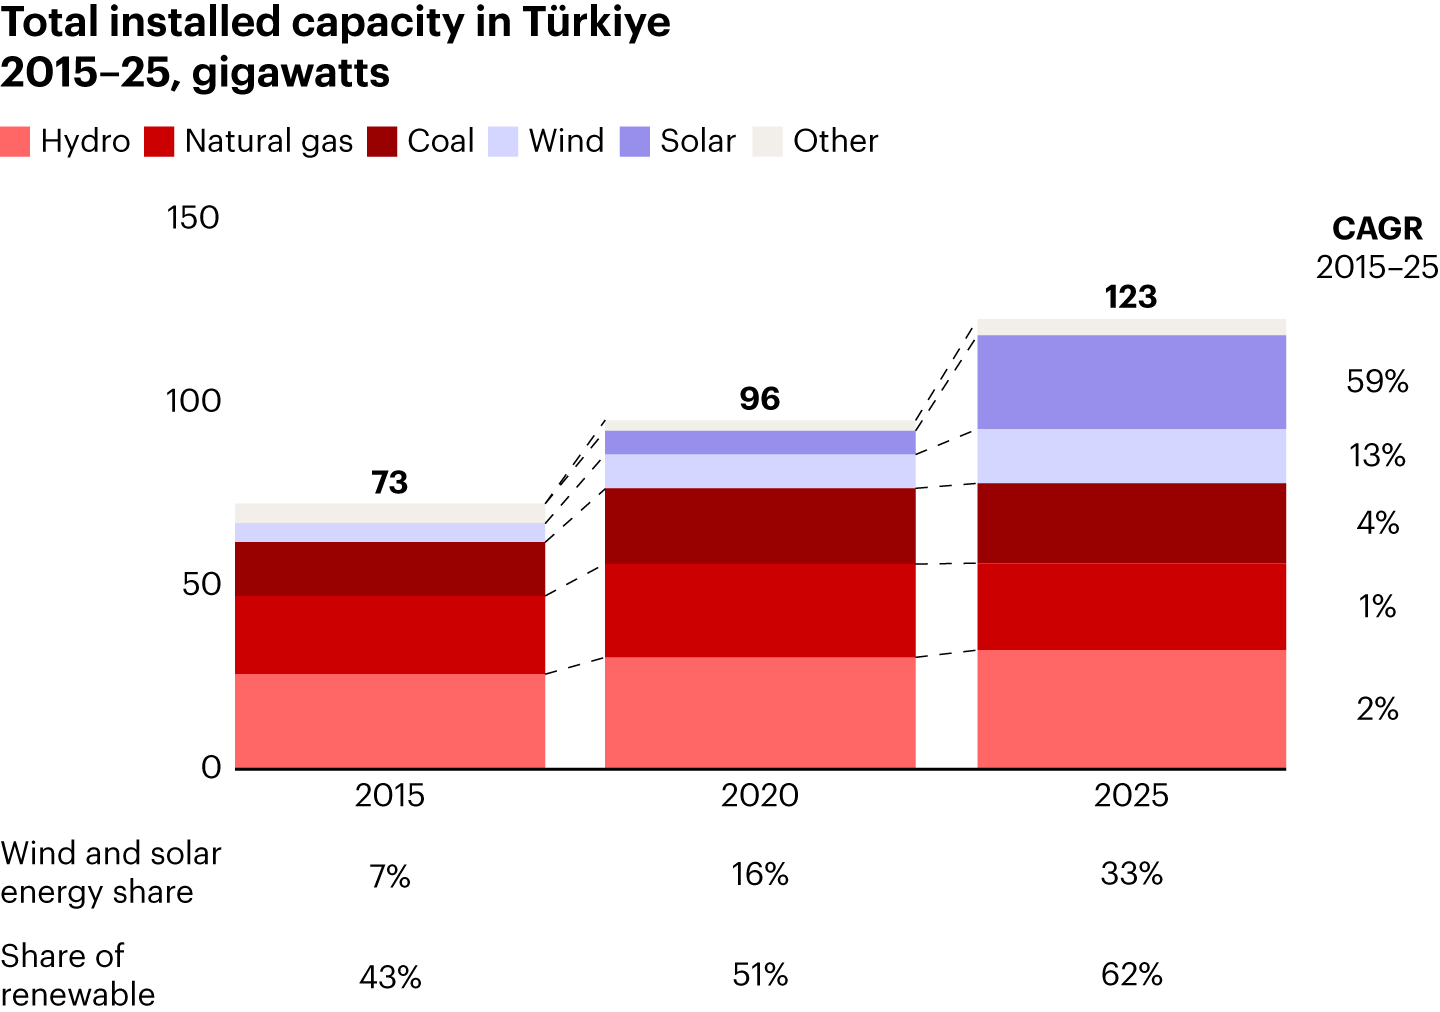
Capacity is an insufficient metricTürkiye’s capacity build-out has been real. Renewables rose from 43% to 62% of total installed capacity between 2015 and 2025, with solar and wind compounding at 59% and 13%, respectively (see Figure 2).
Figure 2

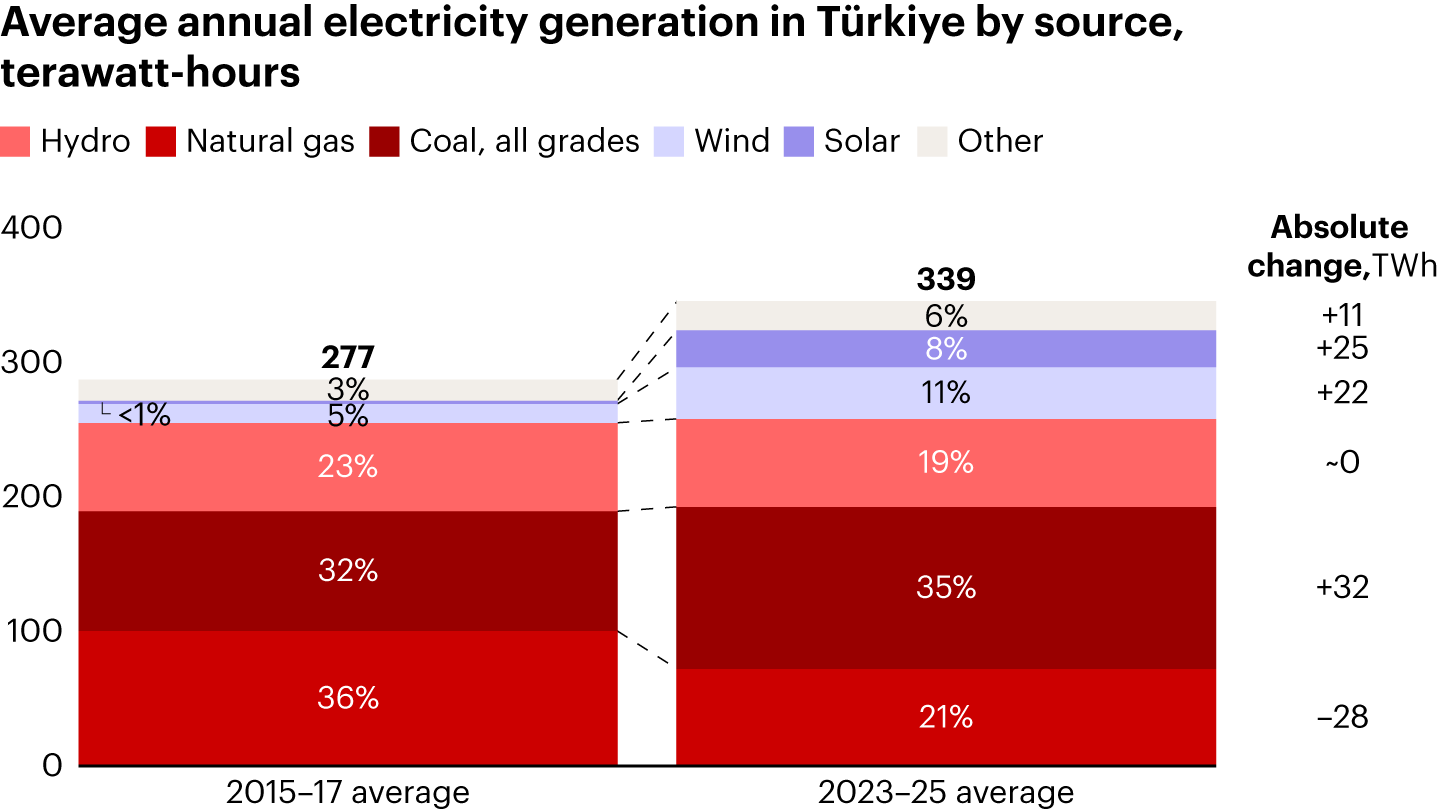
However, capacity, generation, and demand are three distinct dimensions of the power system. Conflating them is a major source of overoptimism surrounding Türkiye’s energy transition. Renewables represent 62% of capacity but only about 43% of generation. Part of that gap is arithmetic (and permanent): A gigawatt of solar does not generate what a gigawatt of gas produces. Part of it is weather: A drought in 2025 pushed hydro down to 16% of generation compared to a three-year average of 19%; in a normal hydrological year, the renewable share is two to three percentage points higher. In this equation, the demand is the most critical variable. Energy demand is expected to reach approximately 510 terawatt-hours (TWh) by 2035—a CAGR of 3.5% a year. Against that trajectory, national plans to increase capacity from roughly 123 gigawatts (GW) to 227 GW are not an overshoot. Capacity must grow faster than demand precisely because of the generation gap: As wind and solar increase from one-third of installed capacity to over half, the average gigawatt produced will yield less energy. The past decade illustrates this dynamic (see Figure 3). Measuring three-year averages (to filter out annual rainfall fluctuations that skew single-year hydrological comparisons), total generation rose by about 62 TWh between 2015 and 2017 and between 2023 and 2025. Wind and solar supplied 47 TWh of that growth, successfully displacing gas. Gas-fired generation fell by roughly 28 TWh, or 29%. Hydro output was flat across those two periods, while wind and solar supplied about 47 TWh of the roughly 60 TWh increase in renewable generation. However, coal generation also rose by about 32 TWh, backed by 6.5 GW of added capacity. Coal expanded because it could be added at scale, dispatched reliably to meet rapid demand growth, and more than offset the drop in gas. As a result, total fossil generation, including liquid fuels and liquefied natural gas, remained broadly flat in absolute terms (189 TWh vs. 191 TWh) even though its share of the energy mix fell from 68% to 56%.
Figure 3

As renewable capacity continues to grow, system flexibility becomes increasingly important. Storage and demand-side responses are often framed as tools to manage curtailment. They determine how much of a growing demand base renewables can realistically serve. Allocated battery capacity for wind and solar projects has reached approximately 33 GW—a project pipeline larger than that of any single European Union (EU) country. This is a direct result of the 2022 storage-linked capacity allocation regime, which pairs new wind and solar permits with battery storage. Here, the primary constraint is duration rather than ambition. Installed battery capacity is estimated at only 50 MW as of 2025, and most of the demand pipeline targets roughly one hour of storage duration. One-hour batteries manage short-term grid ramping rather than shifting bulk energy across the day. Behind both issues is the physical grid. Connection capacity, permitting, and capital are all needed to expand transmission networks. These are binding constraints on how fast new capacity can be absorbed—a challenge shared across Europe. Upstream, the 6.8 GW of wind and solar added in 2025 fell short of the 8–9 GW annual pace required to meet 2035 targets. One key sequencing question is worth settling now. Because electricity is a pooled commodity, there is no trade-off between decarbonizing existing demand and electrifying new demand. A clean megawatt-hour displaces whatever fuel is on the margin, regardless of which load it is nominally attached to. Decarbonization and electrification run in parallel. What matters is the ratio between them: If electrified demand grows faster than clean supply, the incremental load will be met by coal and gas, eroding the abatement value of electrification. Where the transition will be decidedThree demand centers—industry, transportation, and residential—account for 80% of Türkiye’s total energy consumption (see Figure 4). Each has a different transition constraint.
Figure 4
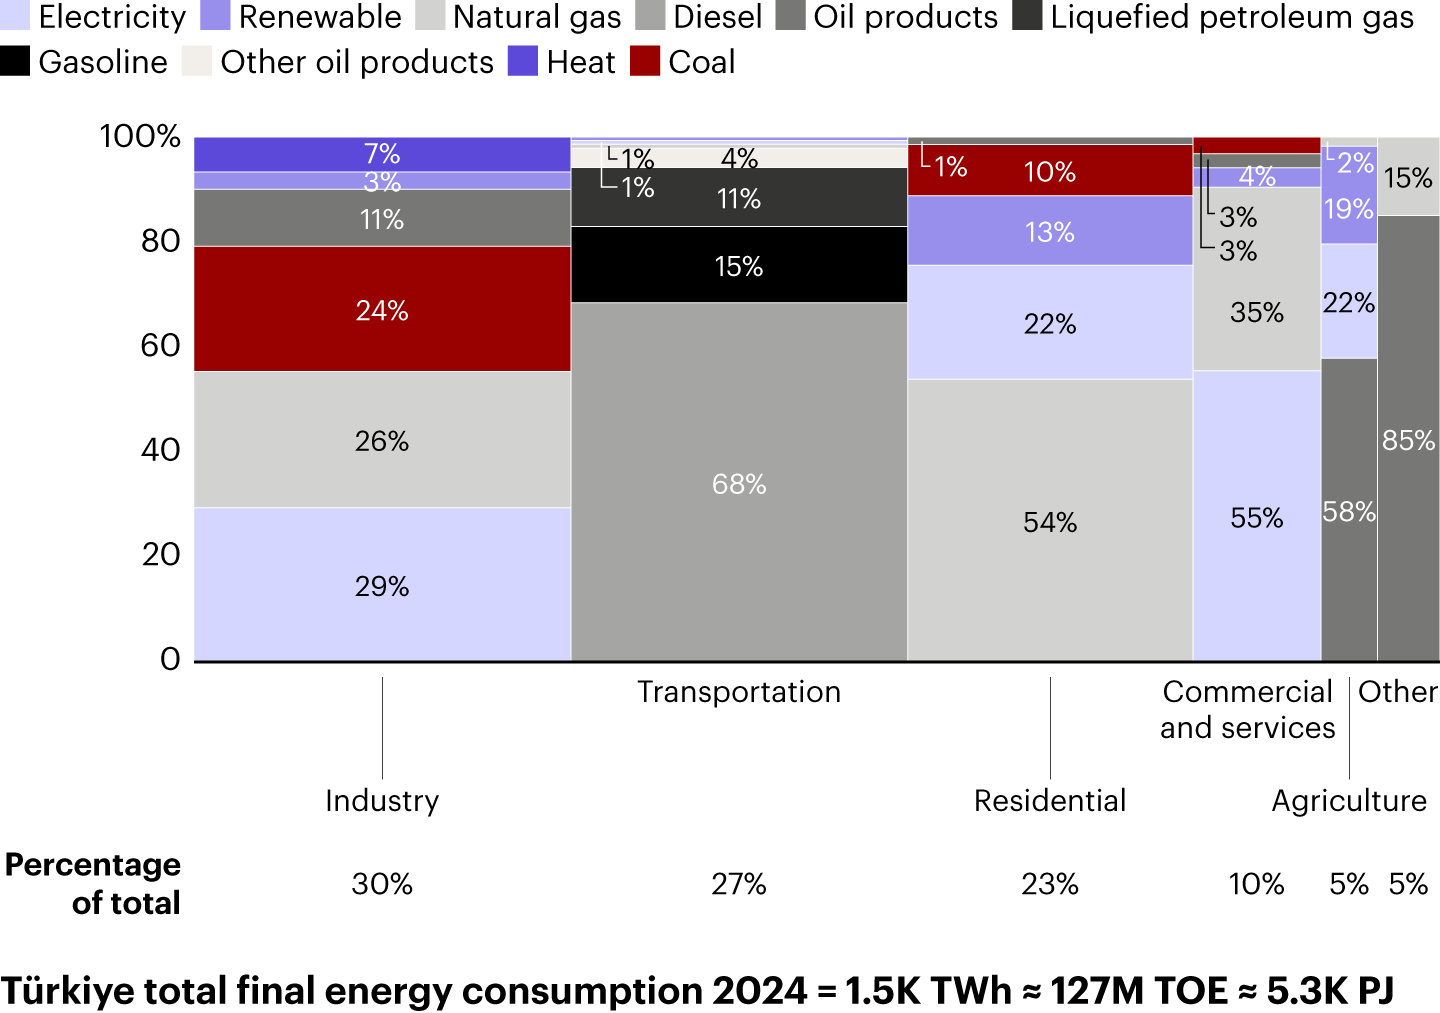

Notes: TWh is terawatt hours; TOE is tonne of oil equivalent; PJ is petajoule Sources: Türkiye Ministry of Energy and Natural Resources; Bain analysisIndustry: Process emissions and CBAM exposure are the largest issuesIndustry is the largest demand segment, accounting for 30% of total final energy consumption. Reaching 2053 transition goals will require an estimated $70 billion to $80 billion in sector investment. Combined, coal and natural gas still account for roughly half of all industrial energy use. For these sectors, decarbonization is a matter of competitiveness rather than regulatory compliance—particularly for producers selling into the EU, which absorbs approximately 43% of Türkiye’s exports. However, trade pressure is not uniform. Rather than applying a flat tariff, the EU’s Carbon Border Adjustment Mechanism (CBAM) prices the embedded emissions of selected imports, concentrating on specific production routes and assets. Türkiye’s steel sector offers an example. Electric arc furnaces (EAFs) account for about 70% of Turkish steel production, which is broadly in line with the US and well above the EU average of 44%. The remaining coal-based production comes from a small number of integrated plants. While those account for a small share of the sector’s output, they produce a disproportionate share of its energy use. Those assets face a genuine convert-or-close decision. By contrast, the EAF base avoids that decision and enters the CBAM regime with a structural advantage. Other sectors, such as cement, cannot respond through fuel conversion alone because most of their emissions are process-related rather than combustion-related. This is not a uniquely Turkish disadvantage; it is equally structural for European producers. CBAM adjusts for the free allocation so relative competitiveness stays roughly aligned. However, two issues remain: Carbon fees paid domestically in Türkiye are deductible against CBAM liability. When no domestic carbon fees are levied, money leaves the country to pay EU taxes rather than staying in Türkiye to fund the transition at home. Second, under CBAM rules, producers lacking verified emissions data face punitive default carbon price values. Carbon capture is the only technology capable of addressing cement process emissions at scale, yet it is not currently economically viable. Carbon capture storage projects cannot be financed at any plausible near-term Turkish carbon price, and no carbon dioxide transport or storage infrastructure exists to connect with. Cement is therefore in a “monitor” position, requiring two explicit triggers for capital to be deployed: a sufficient carbon price and a viable storage route. Both are required, as neither is sufficient alone. Inside the current planning cycle, the key levers are measuring emissions, reducing clinker, and establishing domestic carbon price credits. Asset-level sorting is only half the problem, as CBAM exposure also runs through the supply chain. Exporters depend on emissions data from suppliers that often lack the balance sheets or analytical capacity to measure and abate emissions. While large producers face discrete, well-understood capital decisions, their suppliers face fragmented investments that are harder to finance and coordinate. Beyond heavy industry, many midsize producers in food, beverage, textiles, and chemicals rely on gas for low-temperature process heat. High-temperature heat pumps are commercially available for much of that load today. The economics depend on the same delivered electricity-to-gas price relationship that governs buildings, making the industrial segment far more sensitive to tariff design than technological readiness. Residential: Capital is flowing, but toward gasBuildings represent the second-largest demand for transition capital (after energy), requiring an estimated $80 billion to $200 billion by 2053. Roughly $120 billion is targeted at strengthening existing building stock. Natural gas supplies approximately 54% of residential energy demand, with space heating accounting for roughly 63% of household final energy consumption. The conventional diagnosis is that household energy efficiency stalls because the payback periods are too long and financing products are lacking. In Türkiye, that is only half true. A large urban-transformation ecosystem is actively renewing the building stock: Urban transformation programs have covered approximately 2.76 million independent units since 2012, of which roughly 2.38 million have been completed, and the remaining are still in progress. With a substantial share of the building stock still requiring renewal, this investment cycle is expected to continue, creating an existing channel through which energy-efficiency upgrades can be embedded into building renewal. The binding constraint is specification. The majority of renovated buildings are retrofitted with gas heating because it matches the existing distribution networks, installers are familiar with it, and it’s favored by current price incentives. This is a behavioral constraint as much as a financial one. Every building that completes renovation with gas infrastructure commits to maintaining its heating system for another asset cycle, meaning the addressable stock for clean heating retrofits shrinks as the renewal program advances. Transportation: Affordability is determined by tax policyRoad transport requires an estimated $35 billion to $50 billion in investment by 2053. Fully electric cars reached 17.8% of new registrations in H1 2026 but still account for only 2.5% of the total registered fleet. This replacement lag should close naturally as the fleet turns over. The speed of this transition will be determined by relative economics rather than technology availability—and economic forces are pulling in opposite directions. Running costs already favor electric vehicles (EVs) by a wide margin, though that advantage narrows materially when relying on public charging. Up-front costs heavily favor internal combustion vehicles. In Türkiye, the tax schedule dictates the price gap between electric and combustion vehicles more than manufacturing cost. Near-term EV adoption is therefore more sensitive to tax policy and relative vehicle economics than to further technological advancements. Three variables set the pace of transitionThree variables—carbon pricing, electric costs, and financing—will determine how quickly the demand side converts, and none of them are technological. The technologies required this decade are already commercially mature: solar, wind, storage, heat pumps, EVs, and EAFs. Less mature technologies, principally green hydrogen and advanced carbon capture, are more relevant post-2035. None of these variables are unique to Türkiye; most decarbonizing economies face them. What is distinctive in Türkiye is that all three are administered by the state rather than set by the market. None are fully controlled by the companies whose investment cases depend on them. Financing is the most significant constraint of the three. Most conversion technologies require high up-front capital costs that are offset by low operating costs over their lifespan. This makes the availability and tenor of financing more influential than the underlying economics. 1. The cost of carbon and related tax policyIndustrial conversion economics typically rely on avoided costs. When avoided costs are measured in energy savings alone, most business cases in Türkiye aren’t strong enough. A domestic carbon price would change the calculation in two ways:
With the Emissions Trading System regulation, Türkiye has a regulatory instrument to manage this. Now that a carbon pricing framework exists, the near-term question is what economic signal it delivers. Under current plans, allowances would be allocated to product benchmarks and price limits would be set administratively. Additional elements of the pilot phase are still being finalized. Free allocation also limits the price producers actually pay, thereby reducing the amount deductible at the EU border. As a result, the headline carbon price overstates what a producer recovers when it sells to the EU. Companies should view domestic carbon pricing as an emerging source of value in their conversion cases, though not yet a sufficiently predictable cash flow for long-term investments. The same logic governs transportation. The price gap between electric and internal combustion vehicles in Türkiye is dictated by the national tax schedule rather than manufacturing cost differences. In both industry and transportation, the economic signals driving conversion are state-administered, which is why carbon policy and vehicle taxes belong under one variable. 2. The price of electricity vs. the fuel it replacesEvery electrification decision considers relative pricing, though the comparators differ by sector: natural gas in industry and buildings, and diesel and petrol in transport. On the power supply side, combined-cycle gas turbines and reservoir hydro are the two primary price-setting technologies. Gas sets the marginal price during a significant share of operational hours, while reservoir hydro tends to concentrate its output during higher-priced periods rather than consistently suppressing prices. Consequently, wholesale electricity and gas prices remain closely linked. With domestic production covering only 5% of Türkiye’s gas consumption in 2025, uncoupling these prices is a matter of energy security as much as an environmental one. Türkiye’s response centers on optimizing the system across domestic resources, storage, interconnections, and nuclear energy. As renewables, storage, and nuclear power increasingly displace natural gas from the margin, wholesale electricity prices should become less exposed to volatile gas prices. However, wholesale rates are only part of the electrification equation. Household and commercial end users respond to delivered electricity prices relative to the fuel being replaced—after factoring in tariffs, taxes, network charges, and other regulated fees. While system-wide decarbonization improves the underlying economics of electrification, the speed at which those savings reach end users will depend on tariff structure and fiscal policy design. The desired direction is clear, even if the timing is not. 3. Financeability: Bankability is as important as availabilityThe first two variables determine whether a conversion case clears on paper. This variable decides whether it gets funded. Under current market conditions, most projects fail to clear this hurdle. Türkiye needs more than $500 billion in total transition investment capital through 2053. Energy represents the largest share at $210 billion to $270 billion, with the majority of investment needed for electricity generation. Power generation is also the most financeable segment of the transition: It features large ticket sizes, contracted or merchant revenue, established precedent, and access to multilateral banks and export credit agencies. The remaining half represents a much more challenging financing proposition:
These segments are either small-ticket, high-volume transactions or large, complex projects lacking local precedent. In most cases, financial return takes the form of avoided costs rather than contracted revenue. Why the capital fails to move is often framed as a macroeconomic problem, and macro factors are the largest barriers: tight credit conditions over the past three years, difficult recovery on existing loans, and both lenders and borrowers prioritizing short-term needs over a 2053 investment case. However, macroeconomic pressure is an amplifier rather than a root cause. Beneath it, financeability breaks down into four specific constraints:
Each constraint worsens in a tight macro environment, and all four will persist even when conditions ease. The first two are capability bottlenecks that banks can address in the short term at relatively low cost; the latter two require restructuring and new funding solutions that take longer to build. This is where the challenge shifts from a strategic question to a financing one. Large, CBAM-exposed producers can fund conversion from their own balance sheets or raise debt against it—and they will. Their suppliers cannot, nor will they commission the studies required to build a bankable case. Buildings illustrate this dynamic from the opposite side: Lending for urban renewal programs is already occurring, making the immediate opportunity attaching green standards to existing credit flows rather than launching new products. Finally, there is a defensive business case that is becoming increasingly urgent: Worsening climate events and tightening policy are raising the risk profile among certain customers. That means a bank’s transition exposure is already embedded in its balance sheet—whether or not it actively writes transition loans. Shape, monitor, or avoidTürkiye has proven it can build clean-energy capacity. The next phase of its net-zero transition is more difficult: converting the assets and operational decisions that consume energy and structuring them to be economically financeable. For most of the past decade, investment breadth signaled climate commitment. Today, divergence is the wrong strategy. When some transitions outpace forecasts and others stall, advantage comes from concentrating capital where change transition momentum is arriving faster than markets expect and deliberately stepping back elsewhere. Rather than deciding what to support, investors and corporate leaders should consider which posture to take:
None of these variables that influence this decision are within a company’s control. They also affect sectors and market participants differently. Consequently, signals that make an investment position obvious for one institution may be riskier in another. Implications for energy companies
|