Global Private Equity Report

At a Glance
- Private equity blew the doors off in 2021 as trillions in pandemic-related stimulus produced a historic surge in dealmaking and exits.
- Non-buyout private investing categories like growth equity and venture also saw huge increases in activity.
- Global expansion continued to drive impressive returns, but the rising specter of inflation hinted that results may be harder to come by in 2022 and beyond.
This article is part of Bain’s 2022 Global Private Equity Report
By just about any measure, private equity set a remarkable new standard for itself in 2021.
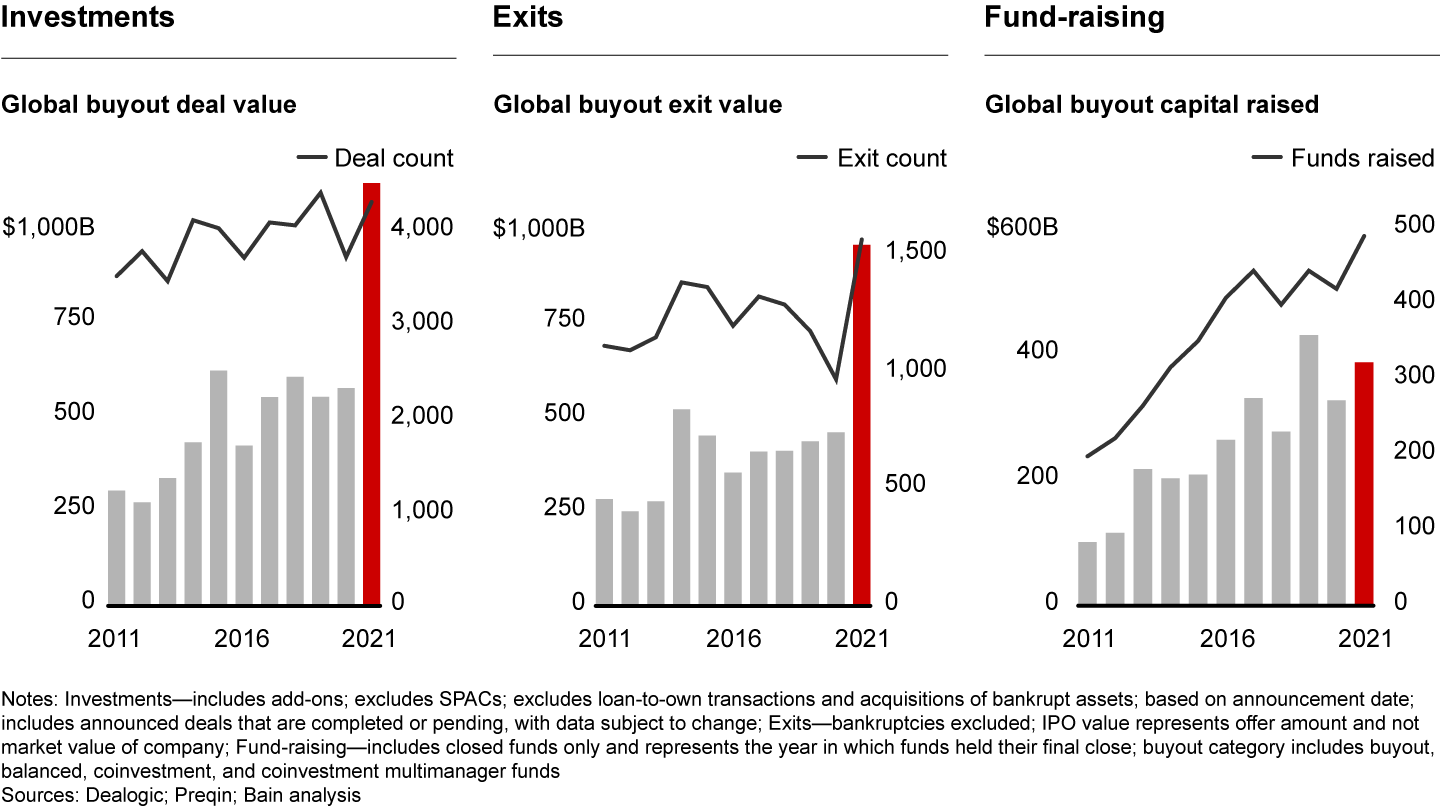
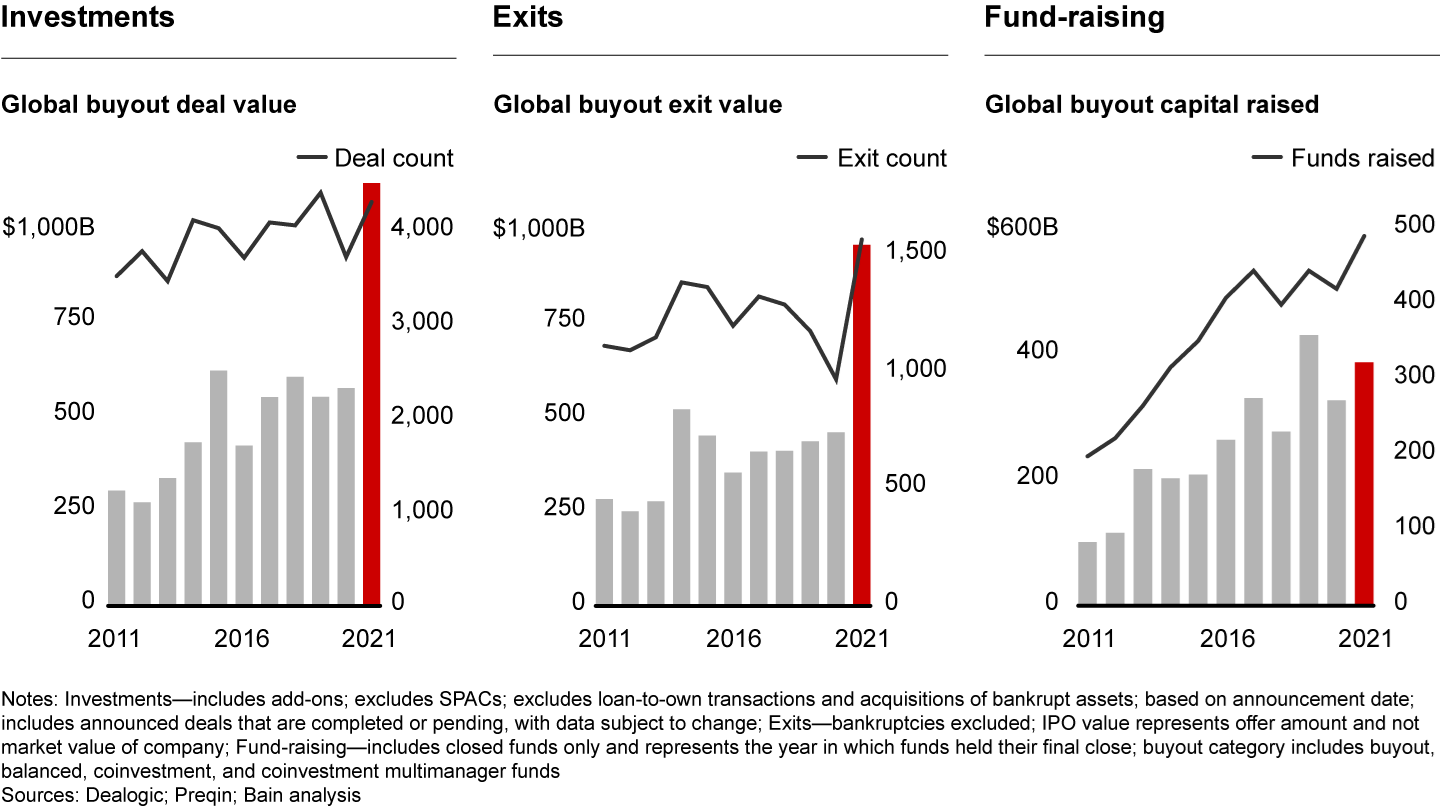
Buyout deal value and exits shot to stunning new records. General partners (GPs) had the second-best fund-raising year in the industry’s history, capping a five-year run that has netted $1.8 trillion in new buyout capital (see Figure 1). Funds boosted distributions to limited partners (LPs) and continued to deliver returns outpacing any other asset class. All in all—and despite the continued economic uncertainty brought on by the Covid-19 pandemic—private equity put a bold exclamation point on what has turned out to be a decade of outstanding performance.
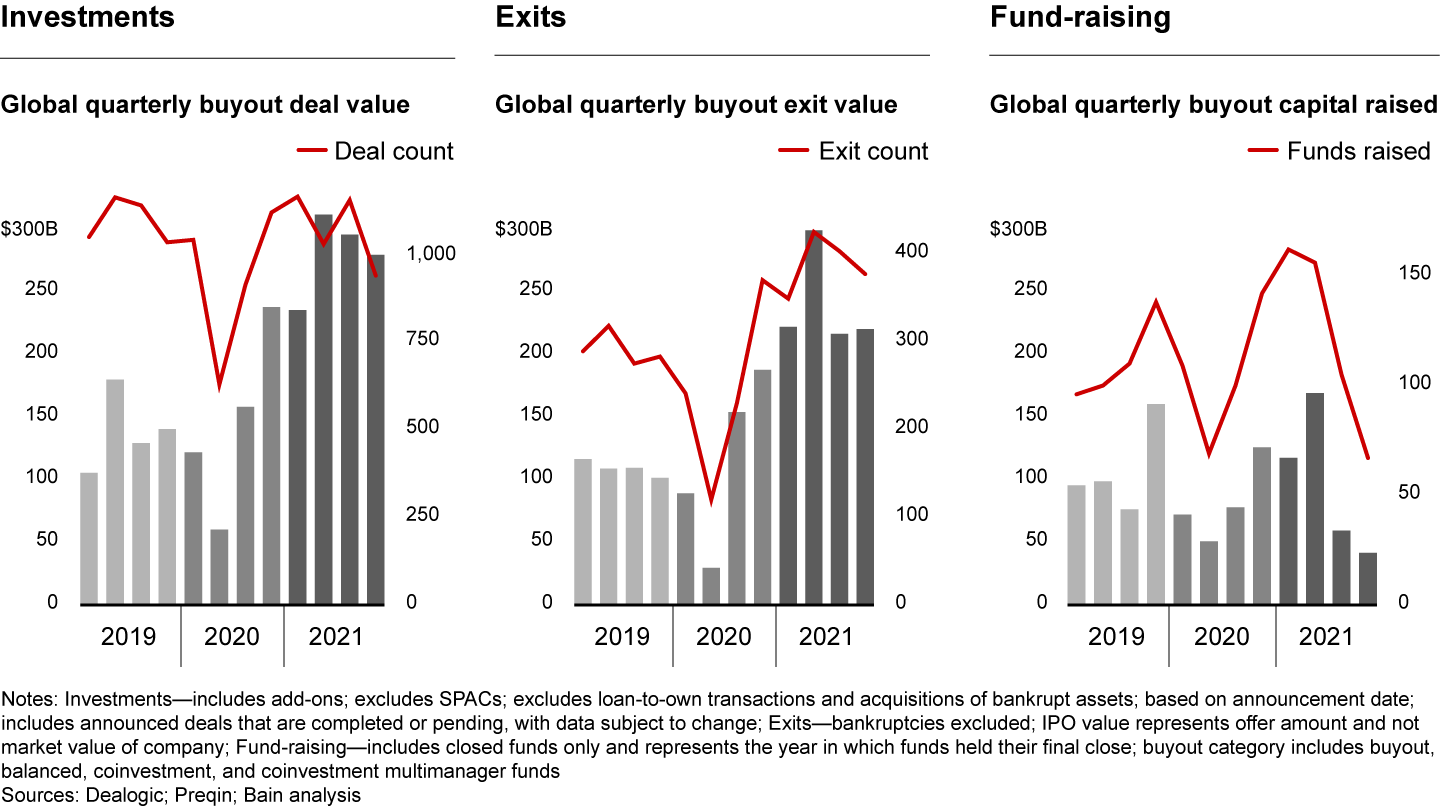
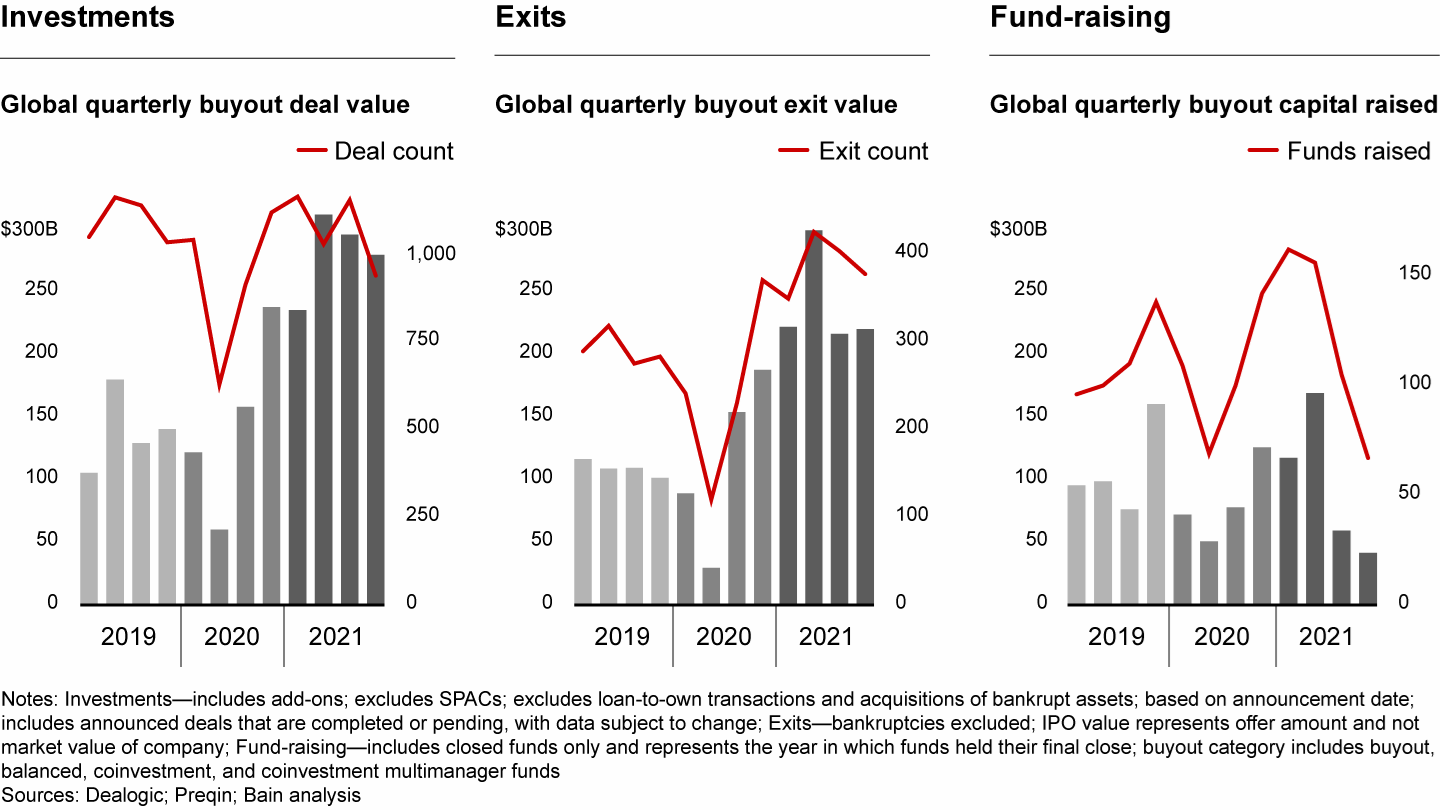
With the exception of three months in early 2020 when dealmaking virtually ground to a halt, the pandemic itself has done little to slow the industry’s momentum (see Figure 2). If anything, Covid sped things up. At the fund level, traveling less has made teams more efficient. (Almost half of LPs in a recent Coller Capital survey say they’ve made recent fund commitments with GPs they’ve never met in person.) And at a macro level, public and private investors have benefited mightily from the trillions in monetary stimulus that central banks have pumped into the global economy since March 2020 to combat the effects of Covid-related shutdowns.
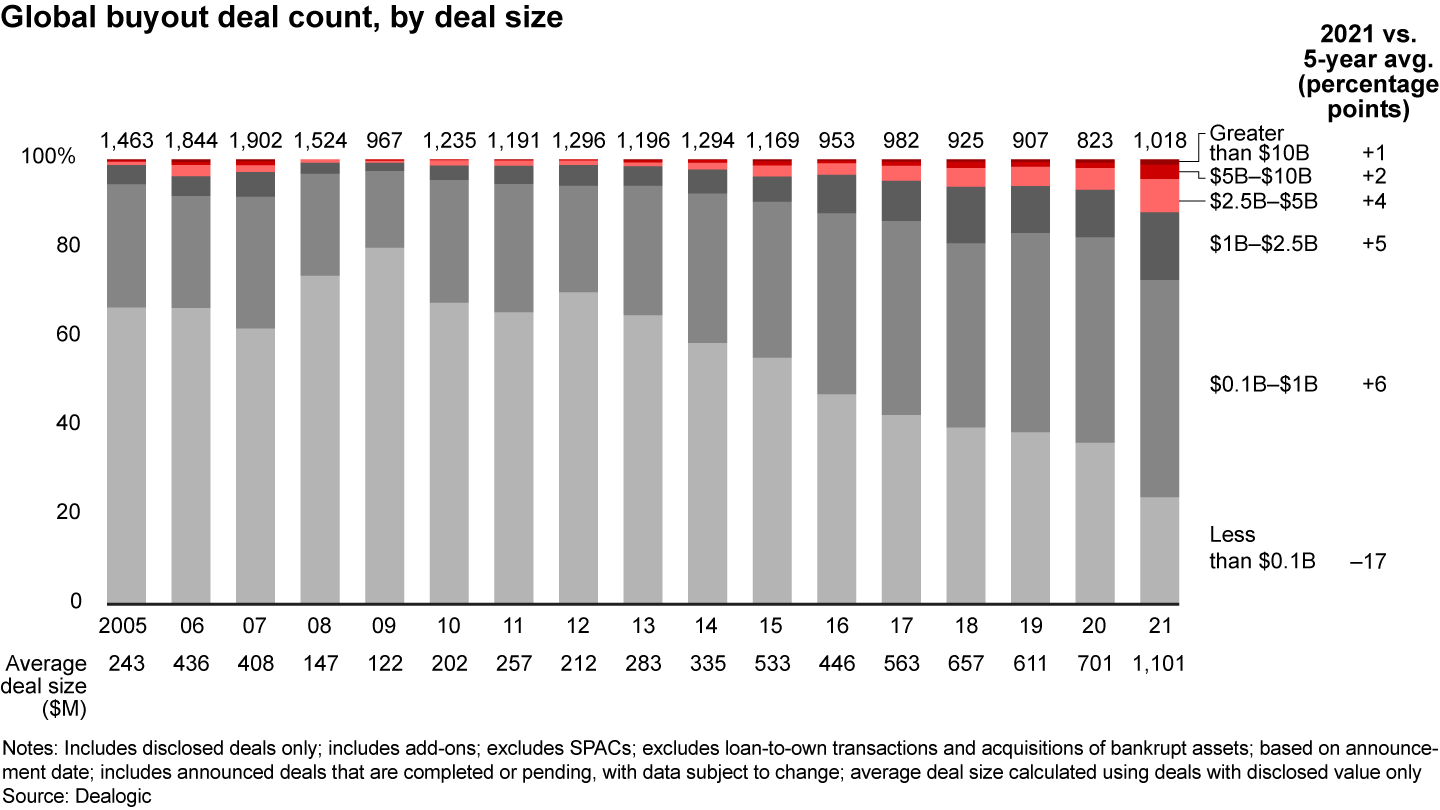
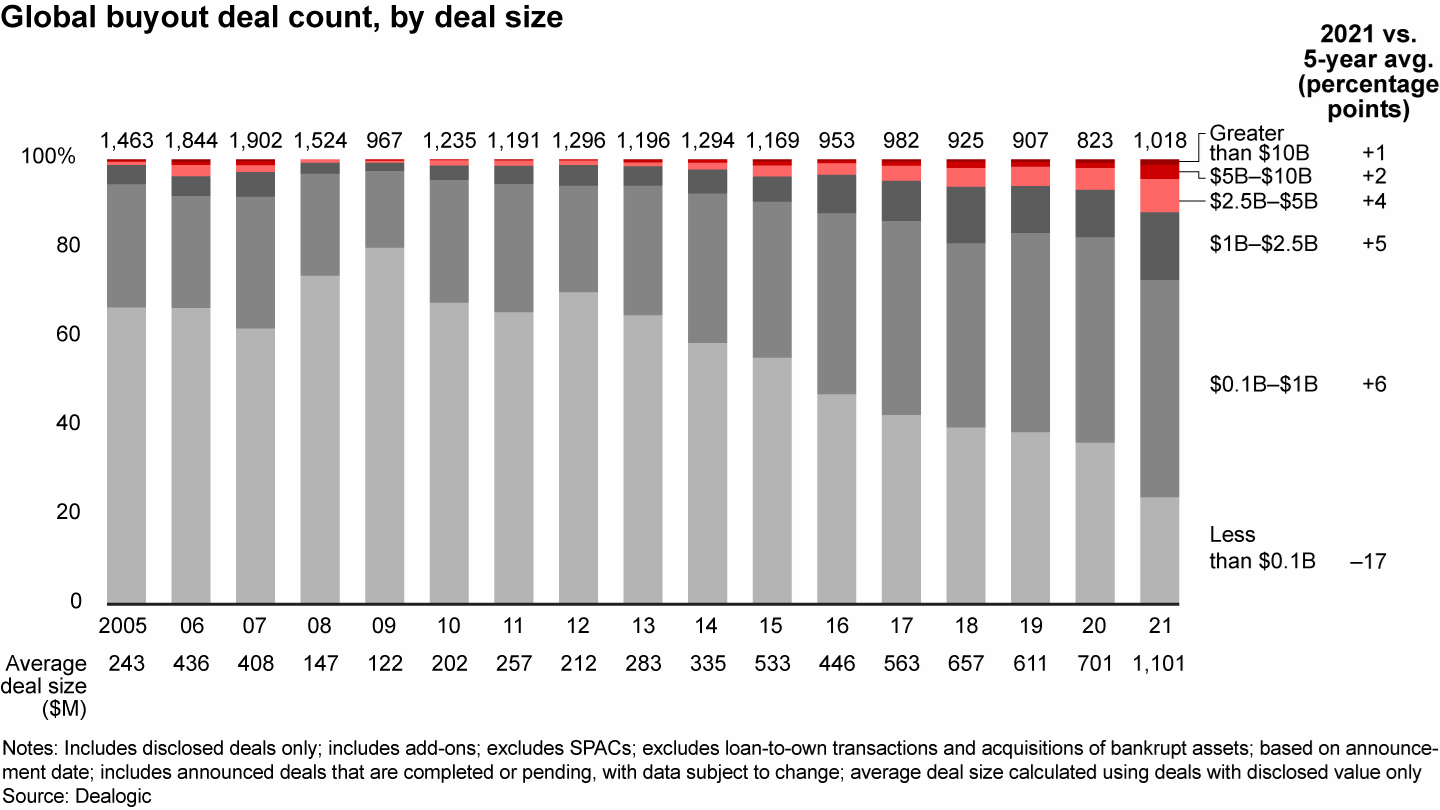
The burst of liquidity has not only shored up portfolio companies wrestling with erratic demand and supply chain issues, but it has also ensured that debt to fund buyouts remains abundant and cheap. With record amounts of unspent capital waiting to be put into play, private equity investors were presented with ideal conditions to buy and sell companies. That fed a trend that has been building for years: The biggest, most experienced funds are raising the most money and doing ever bigger deals. Average deal size pierced through the $1 billion mark in 2021 for the first time ever.
Supersizing helps explain why deal count was the one buyout metric that lagged all others. Although investment value doubled during the year, the raw number of buyouts transacted in 2021 hovered around the five-year average of 4,000. That was a clear pickup from Covid-capped 2020 levels, but it still lagged 2019.
Hugh MacArthur discusses private equity's record year and the future outlook amid rising inflation.
For those close to the private equity industry, however, this data point will run counter to what they feel in their bones—that the frenzied number of deals done over the past year was anything but average. That’s because the buyout deal count doesn’t tell the full story of how the industry was spending its time. What began to crystallize in the data this year is that investors are shifting their focus in new directions. As the industry matures and private equity investors become more sophisticated, they are increasingly looking for types of specialization that may or may not be offered by a typical buyout fund.
Specialization’s pull is reflected in the fact that technology funds and those that invest in tech-enabled sectors like fintech or health tech have become by far the dominant theme in the buyout world. But the shift is also showing up in the stunning growth of subasset classes like growth equity, infrastructure, and secondaries, which isn’t reflected in the buyout numbers. The appetite for diversification has led investors to pump capital into areas they never would have considered in the past. New funds have sprung up to serve them, and older ones—particularly the large, diversified buyout funds—have pivoted accordingly (see Figure 3).
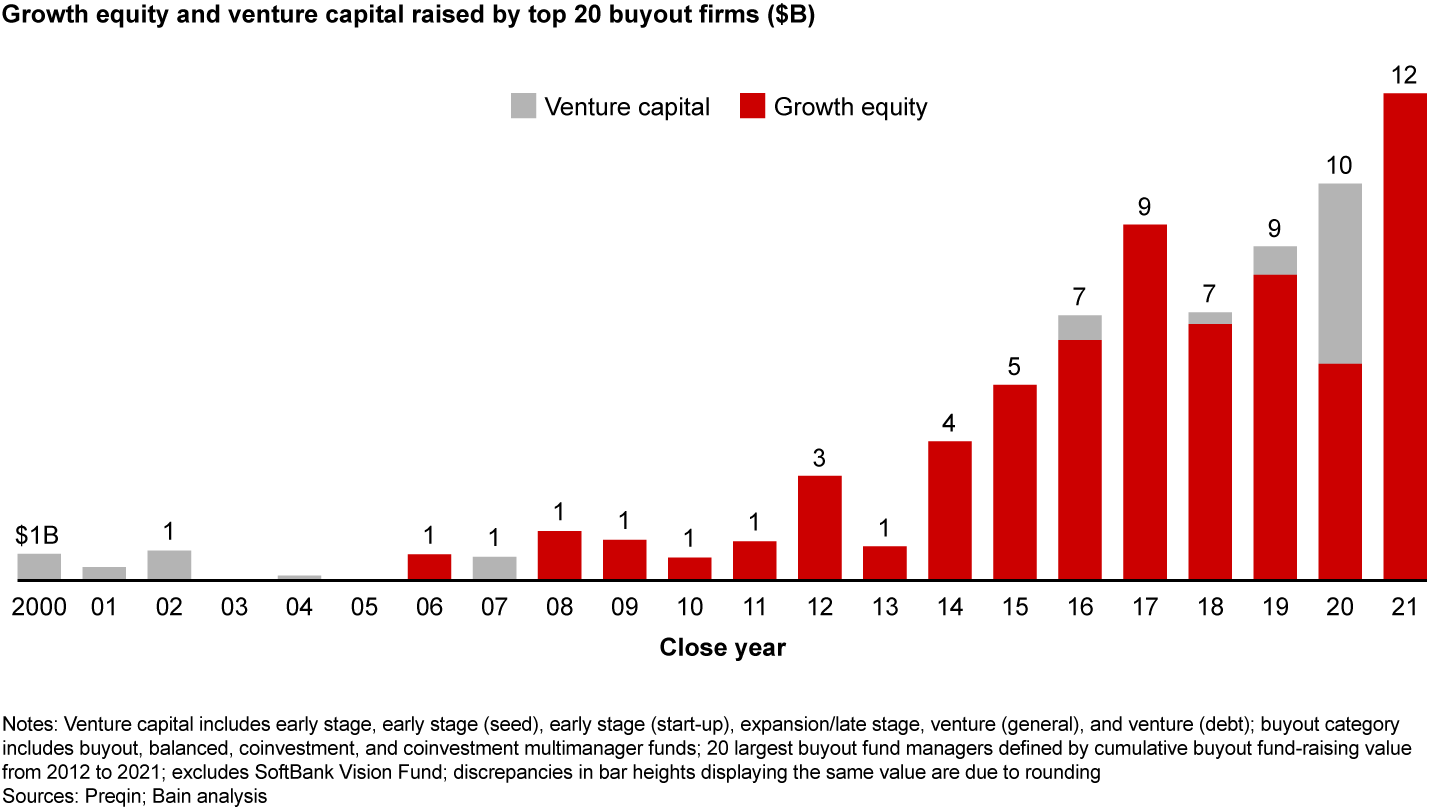
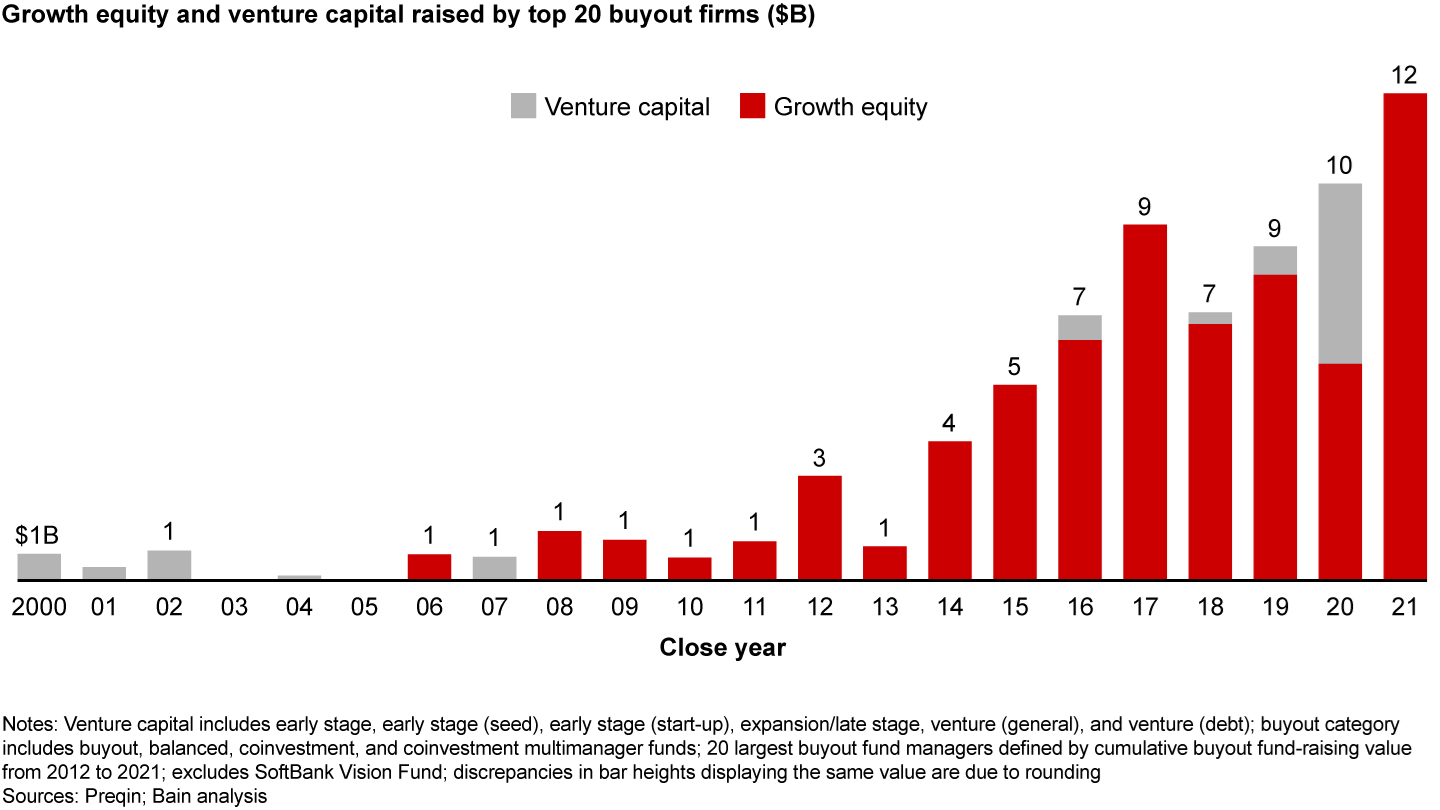
Consider the rapid rise of growth equity and late-stage venture capital—the gray area between buyout and start-up venture. These growth classes have been adding assets under management (AUM) at around twice the rate of buyout over the past decade and have been producing deals at an unprecedented clip. By 2021, growth equity and venture AUM had reached 82% of the buyout total.
The message for GPs is clear: While the private equity industry has been extraordinarily busy over the past year, it’s not just about buyout anymore. Increasingly, investors are tracking down growth and diversification wherever they can find it across the broad private equity spectrum.
It’s also evident that the industry’s traditional focus on cost and efficiency is giving way to a widespread belief that technology-enabled growth and disruption are more potent drivers of value. As digital innovation transforms industry after industry across the global economy—a trend the Covid pandemic accelerated dramatically—investors are responding with trillions in new capital to fund the insurgents and help the incumbents bolster their competitiveness. They are also getting much more sophisticated in how they build growth into their allocations and whom they are willing to bet on. All of this favors deep expertise, focus, and the ability to move quickly and decisively in a hypercompetitive market.
As we look into 2022 and beyond, there are some nagging questions worth pondering. For one, 2021’s massive run-up in dealmaking shares some of the characteristics we saw at the market’s last peak in 2006–07, including a spike in large public-to-private deals. It’s also possible that the pandemic’s most lasting impact on the economy has yet to fully play out. Inflation touched off by global supply chain chaos and labor shortages could potentially turn an idyllic investing climate into something much more challenging. Rising rates threaten to temper the multiple expansion that has buoyed private equity returns for a generation (see Figure 4).
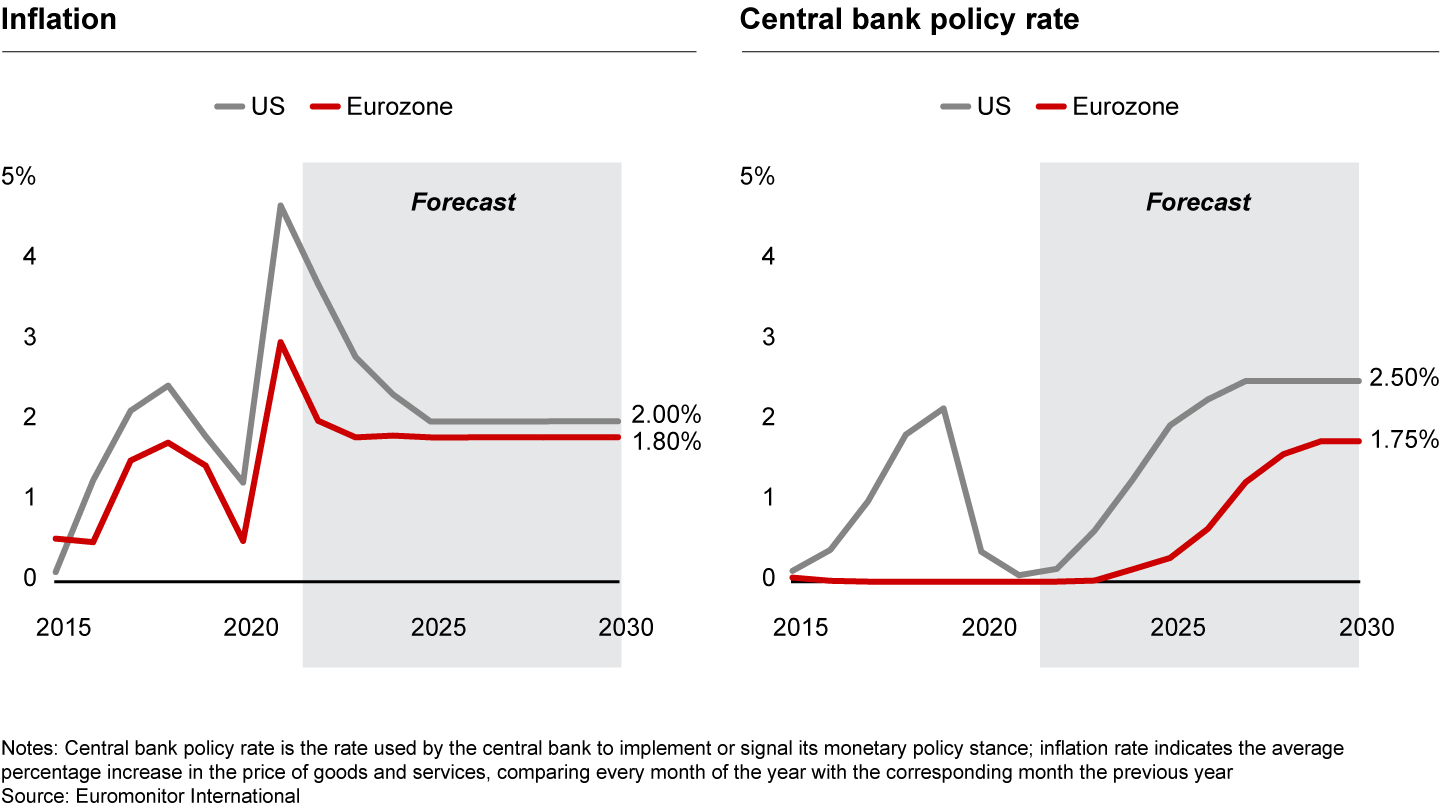
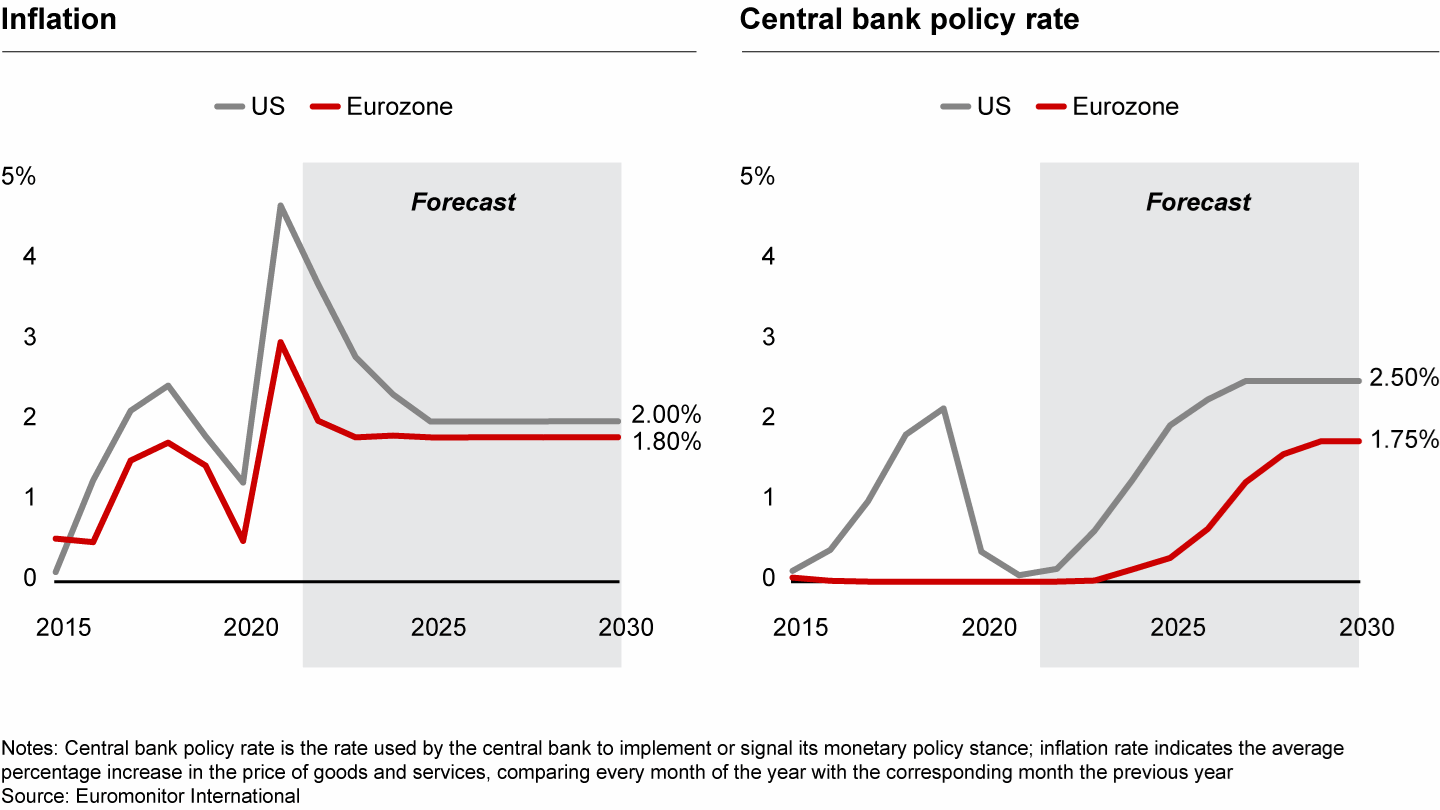
For GPs who have never lived through a period of inflation and rising rates, maintaining the kinds of returns LPs have come to expect will require developing new management muscles and value-creation capabilities. If 2021 taught us anything, differentiation and specialized expertise have never been more important.
Here’s a deeper dive into how 2021 unfolded in private equity and some thoughts on what’s to come.
Investments
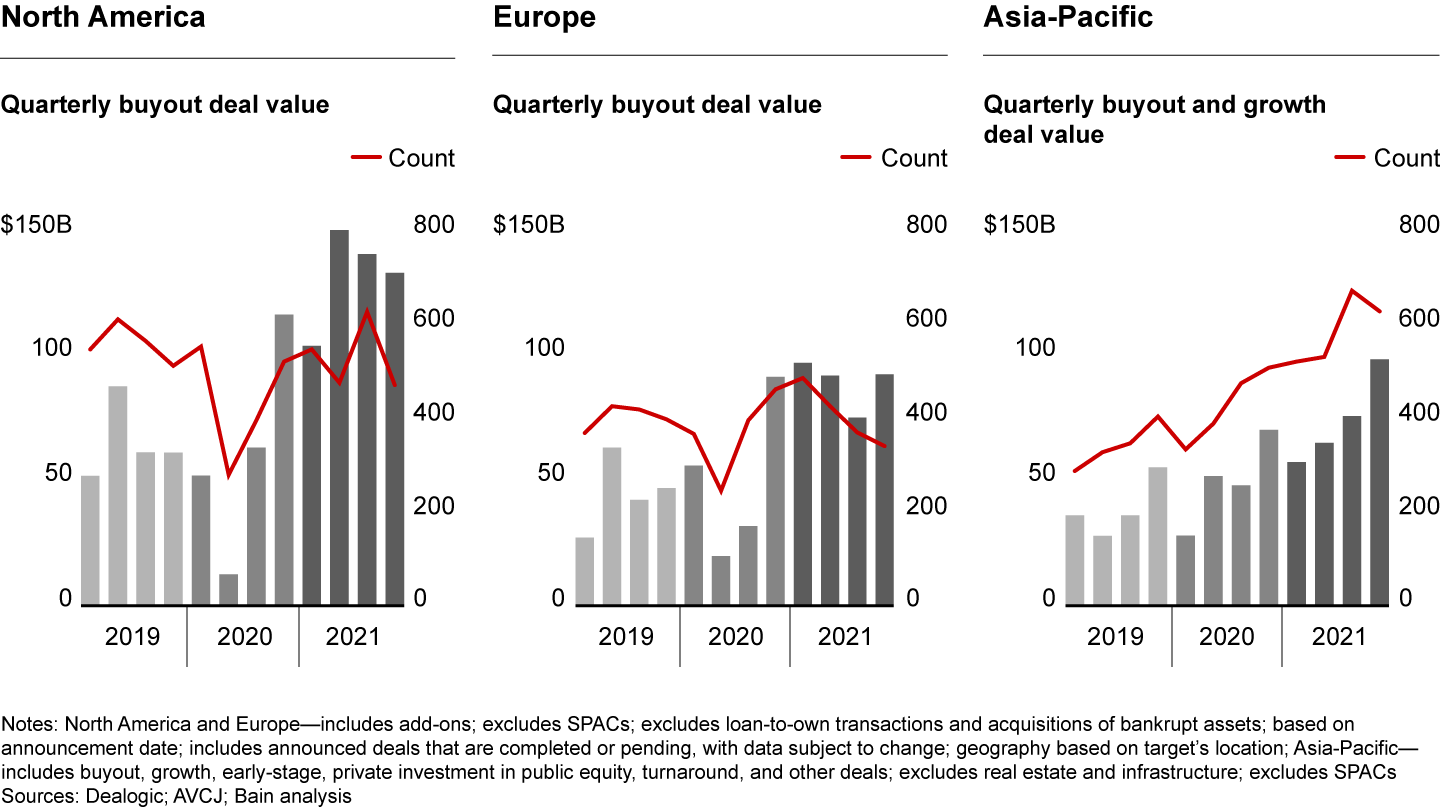
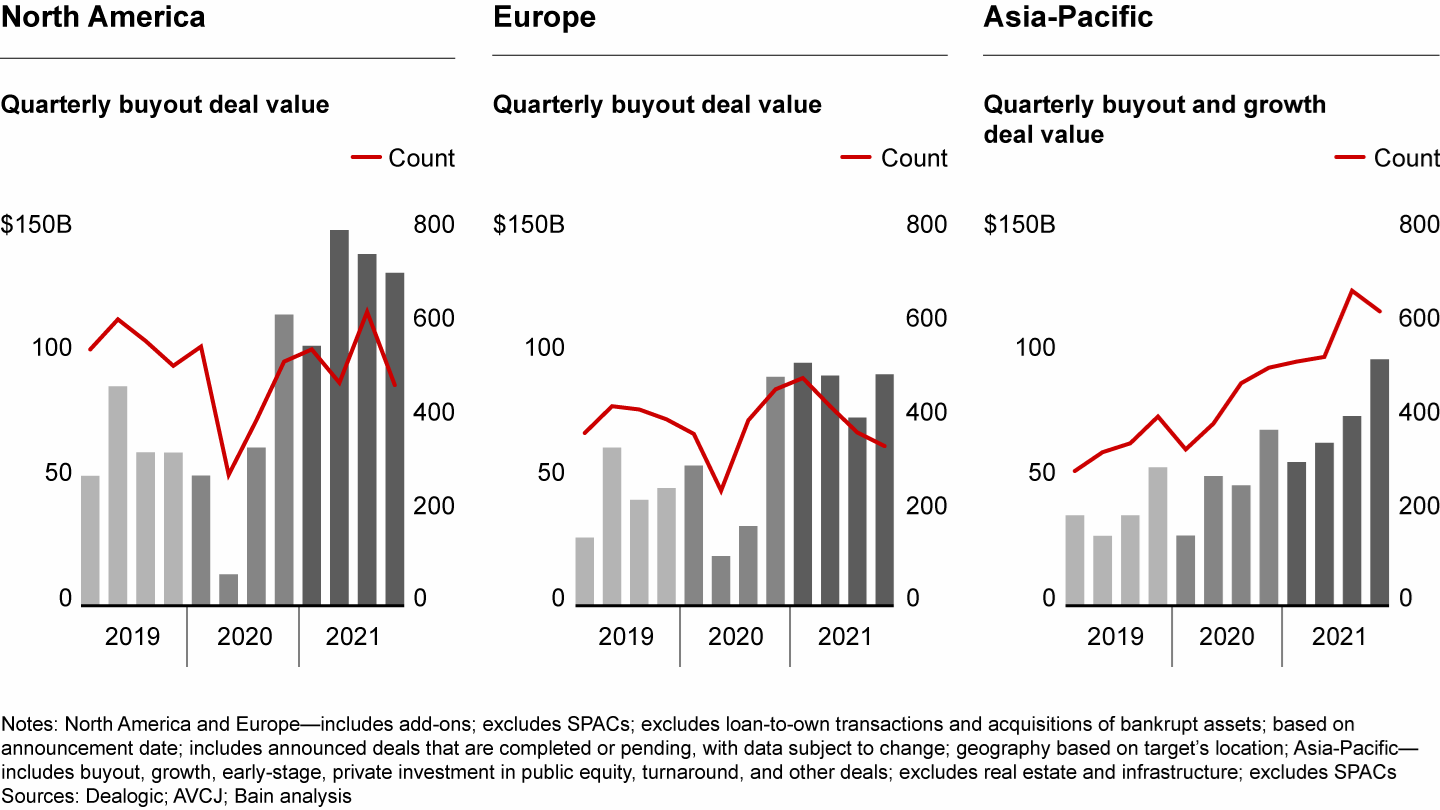
Merely saying that private equity deal value set a new record in 2021 hardly does the industry justice. The $1.1 trillion in buyouts doubled 2020’s total of $577 billion and shattered the old record of $804 billion set back in 2006 during the exuberant run-up to the global financial crisis (see Figure 5). North America led the surge with $537 billion in deals transacted and on its own matched the global total of a year ago. That said, every region has seen impressive growth in deal value since the Covid-related trough in early 2020 (see Figure 6).
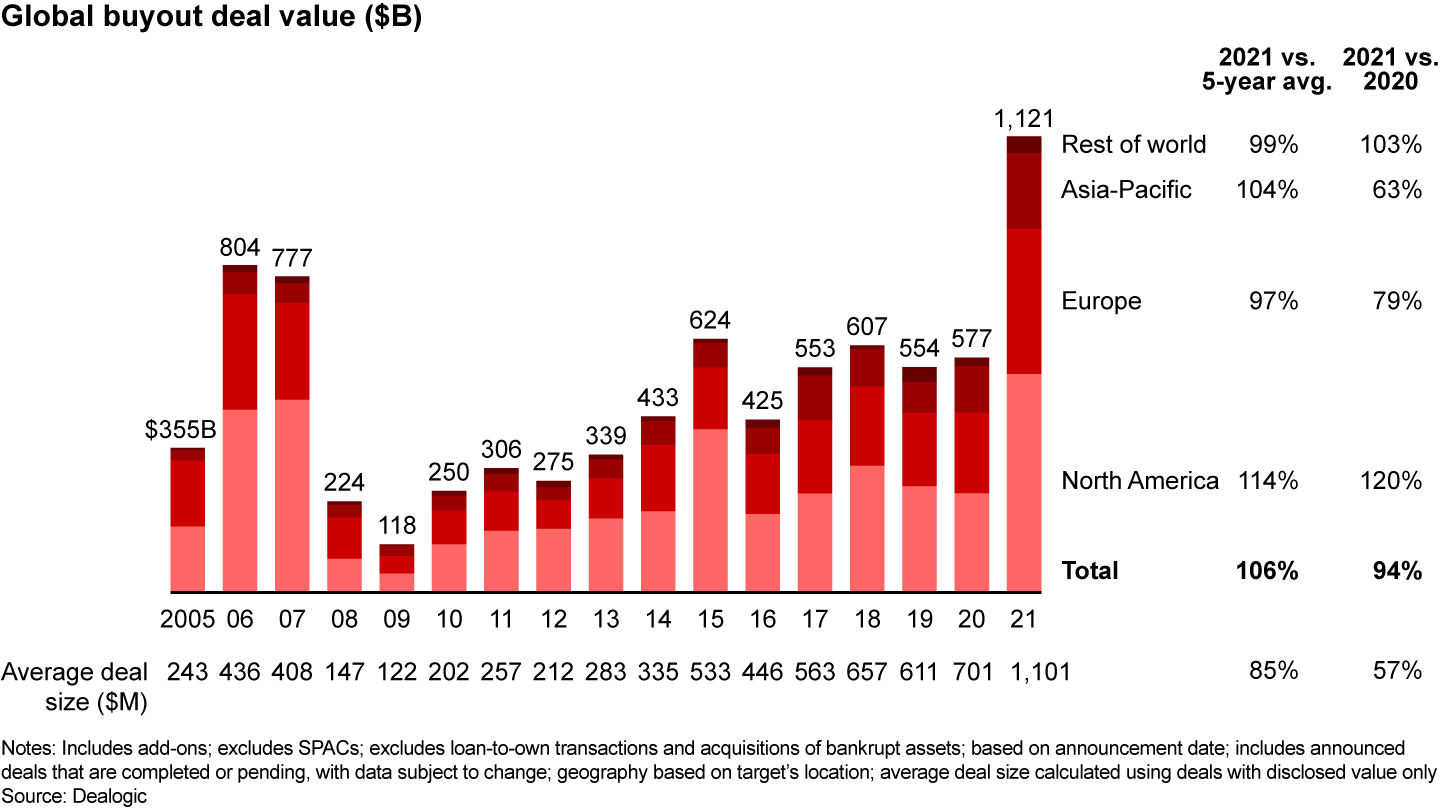
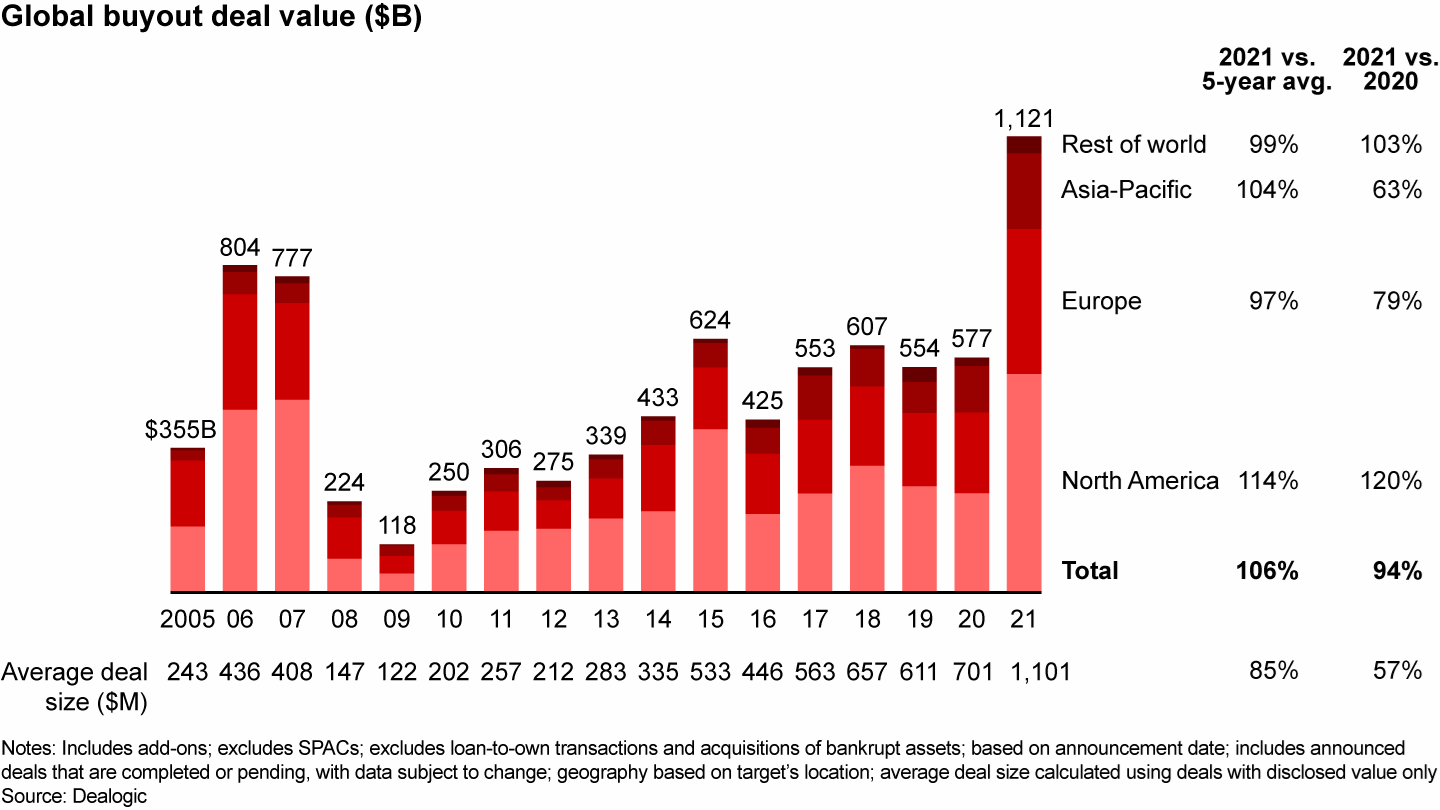
Deal size, not deal count, was clearly behind the increase in value. While the number of individual deals jumped to nearly 4,300 in 2021, up 16% from 2020 levels, that doesn’t explain the extraordinary growth in capital deployed. Rather, the multiyear trend toward bigger funds doing bigger deals accelerated in 2021. The 10 largest deals, including the more than $30 billion investment in Medline Industries led by Blackstone, Carlyle, Hellman & Friedman, and GIC, accounted for 18% of total value.
But the real impact came in the market’s broad middle, where the number of $1 billion–plus deals roughly doubled (see Figure 7). That helped increase average deal size by 57%, pushing it past the $1 billion threshold for the first time.
The stunning increase in 2021 deal value owes to a number of factors. The first is the sheer volume of capital sloshing through the market. After 10 years of steady growth, dry powder set yet another record in 2021, rising to $3.4 trillion globally, with approximately $1 trillion of that sitting in buyout funds and getting older (see Figures 8 and 9).
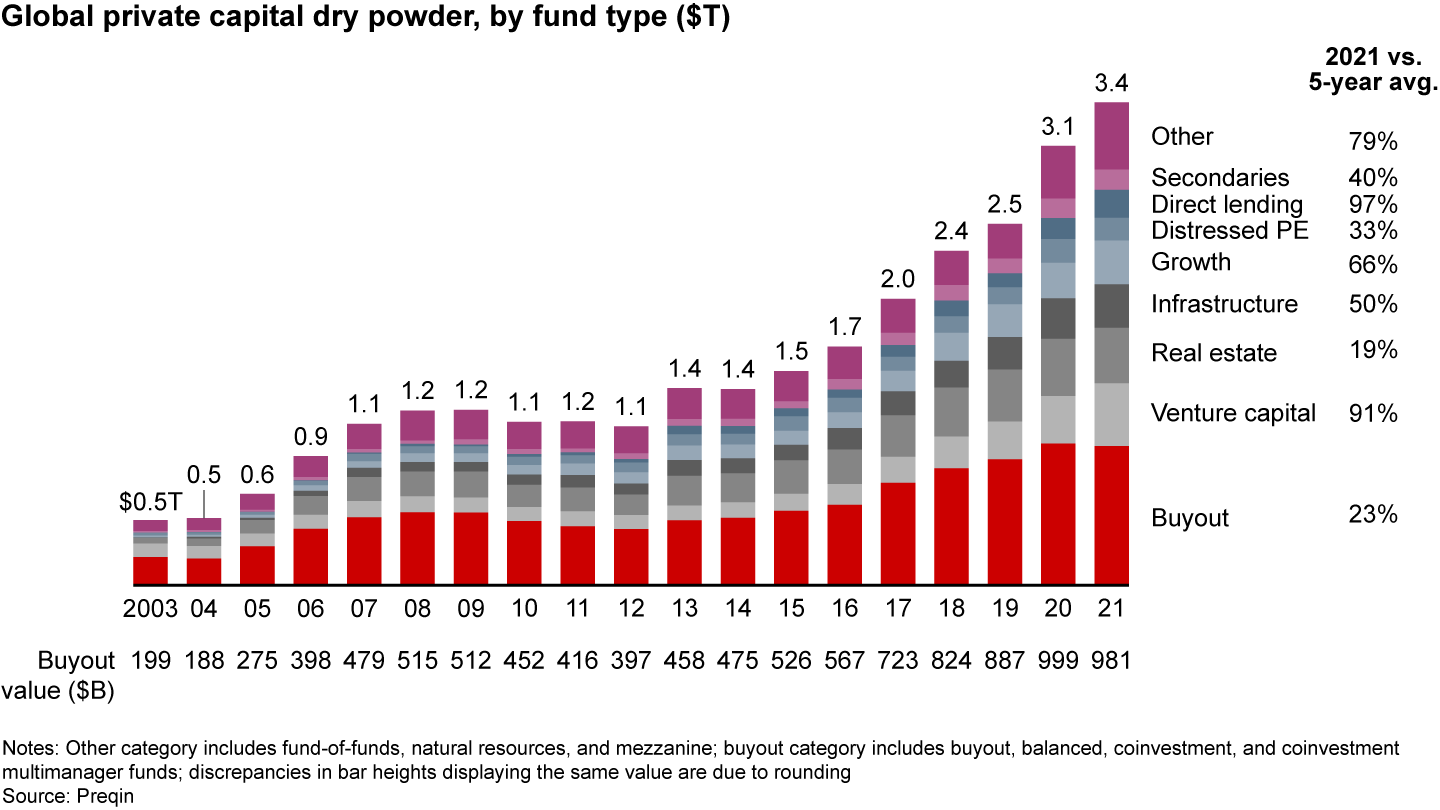
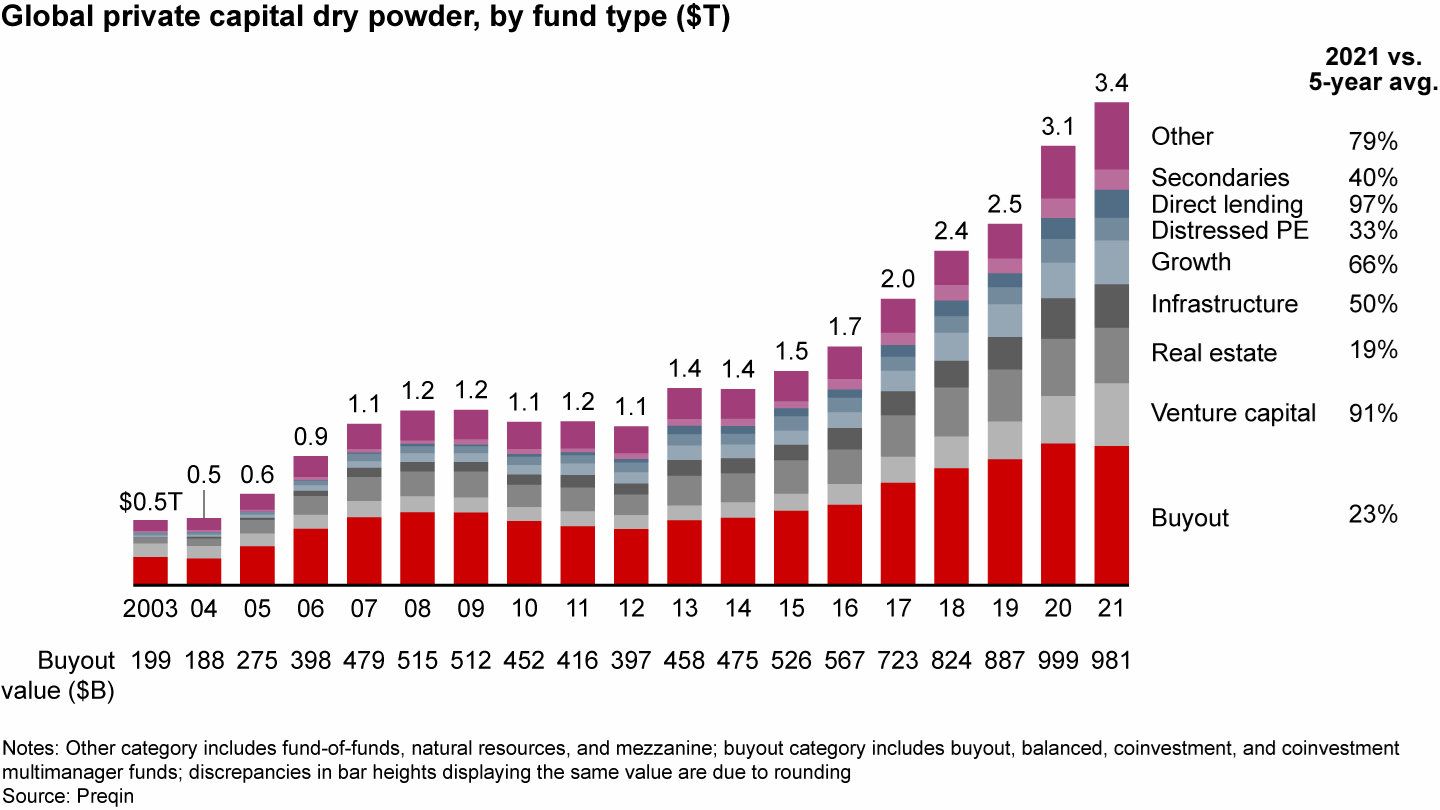
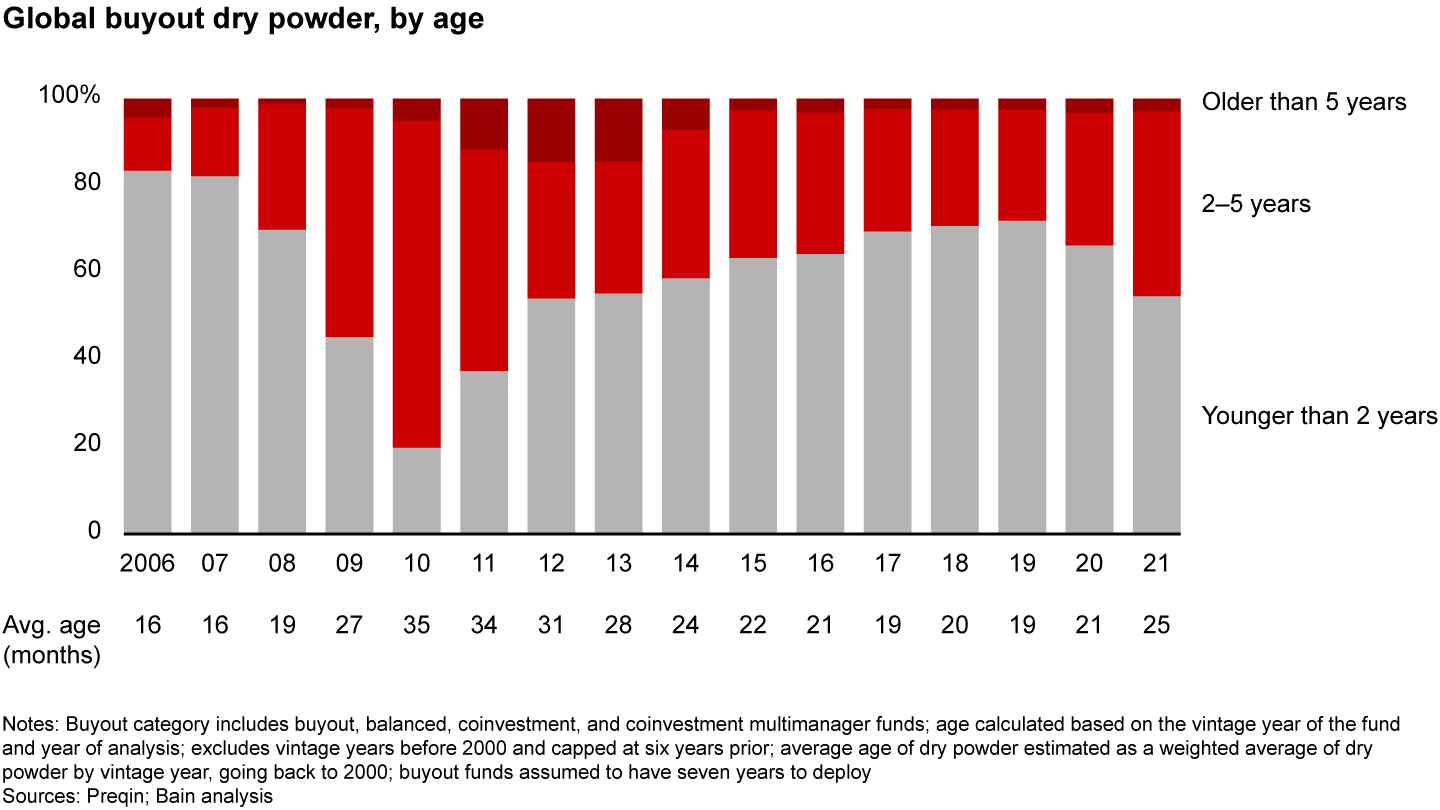
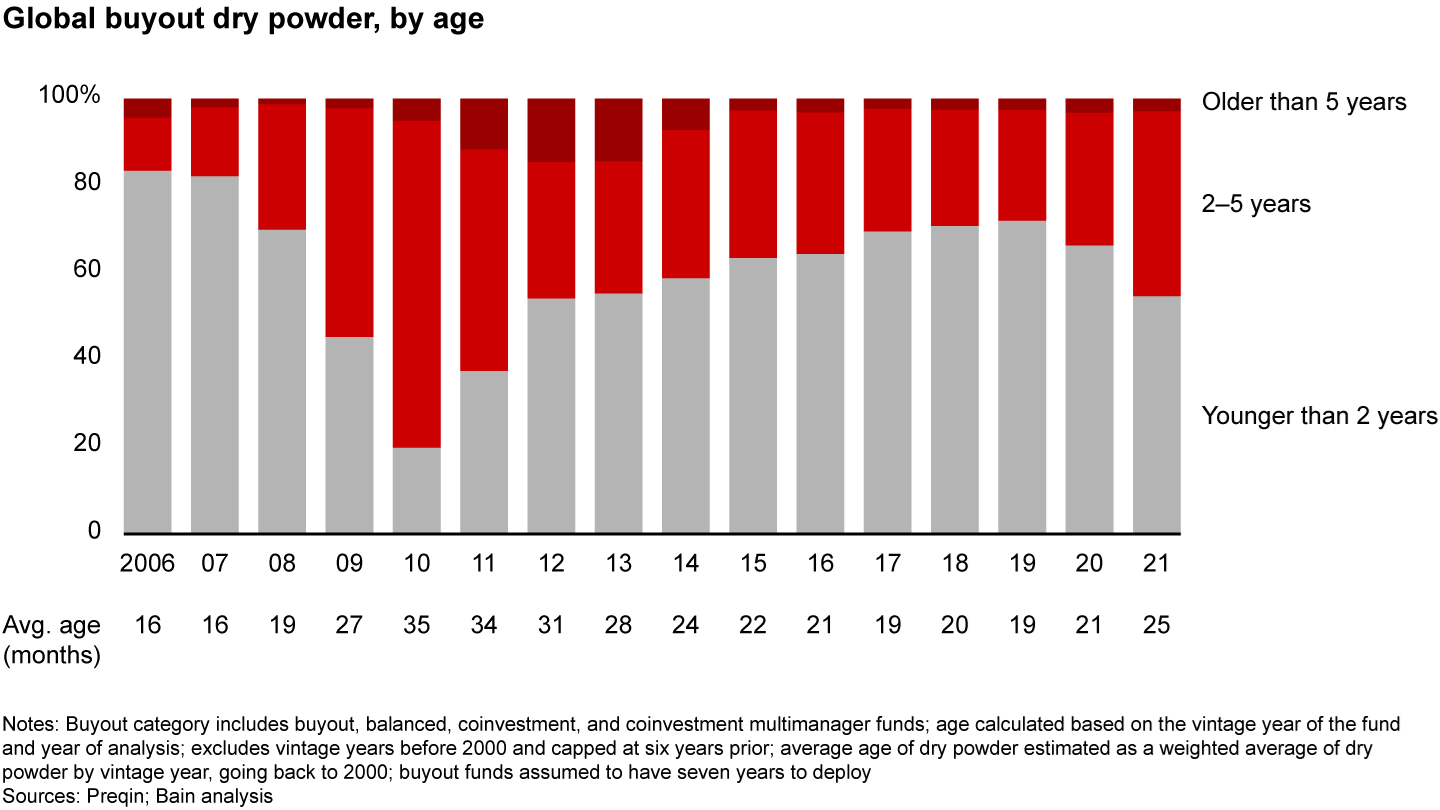
Well before the pandemic, the mountain of unspent capital was already putting pressure on GPs to put money to work in ever larger deals. Then the trillions in Covid-related stimulus added oxygen to the mix. The combination created a burst of activity in sectors across the board, but especially in technology and tech-enabled industries, where deal valuations tend to be higher.
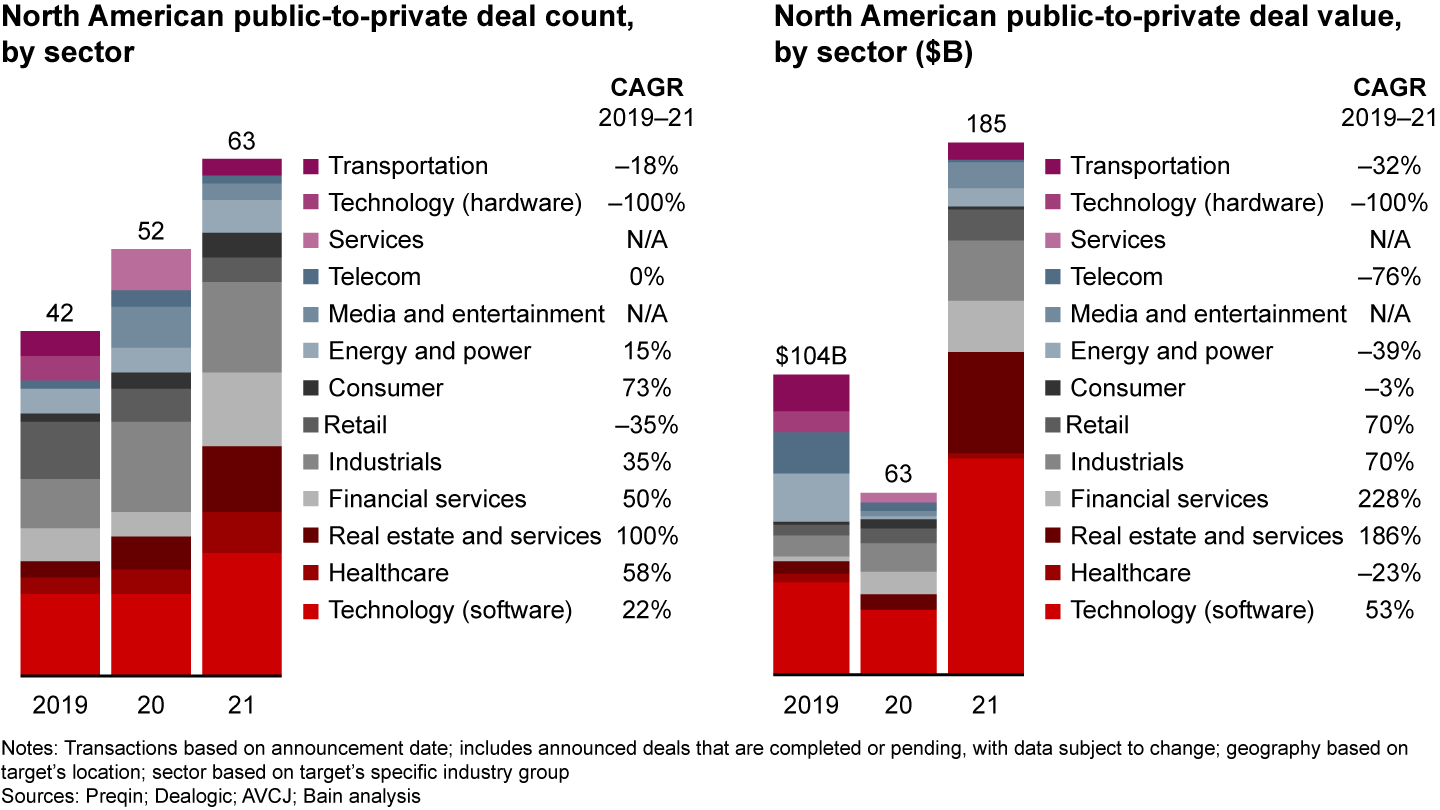
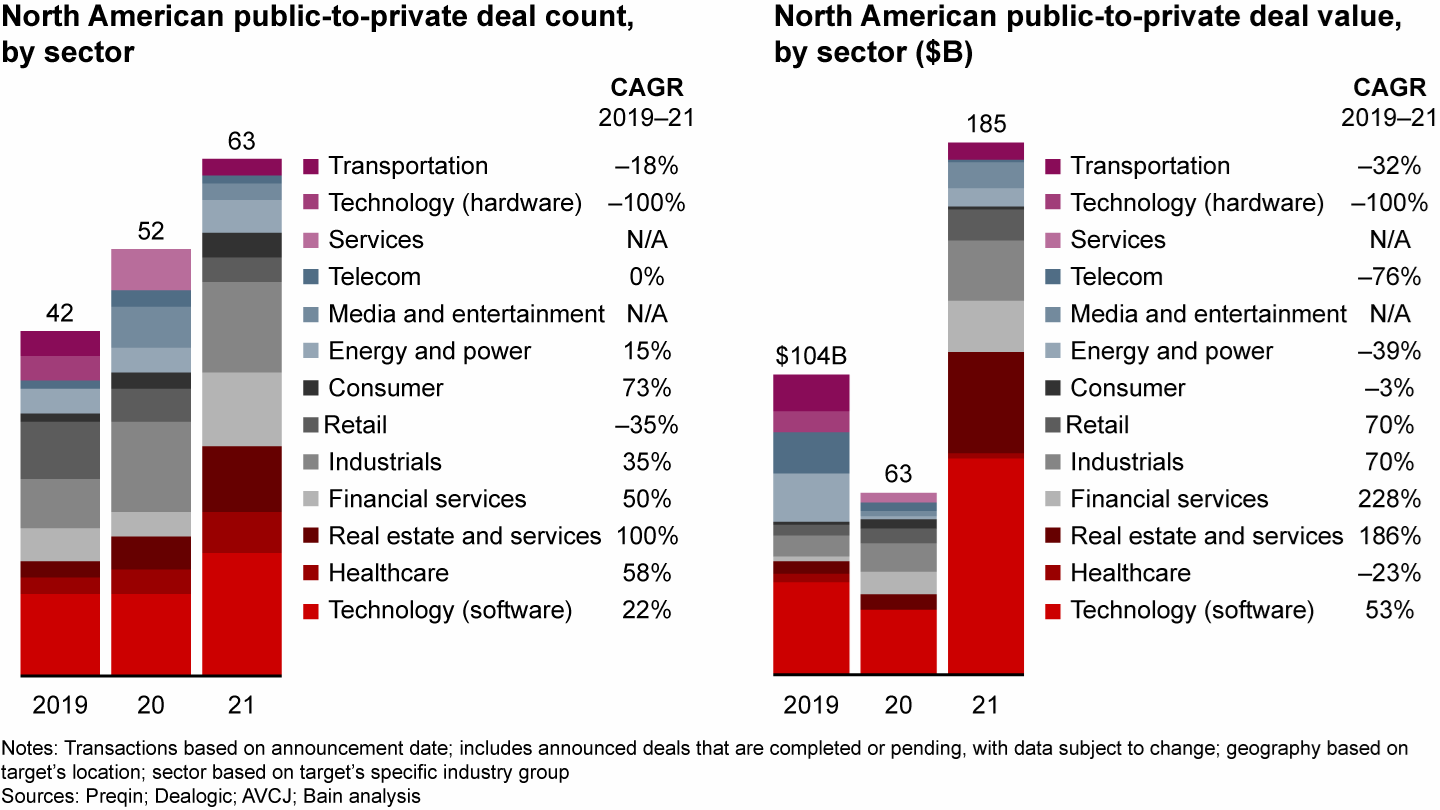
Perhaps not surprisingly, the opportunity to put large amounts of capital to work produced a sudden and sharp increase in public-to-private (P2P) deals, especially in North America and the Asia-Pacific region. These take-private transactions soaked up $469 billion in capital globally, a 57% one-year increase, and were largely responsible for 2021’s record-setting value total (see Figure 10).
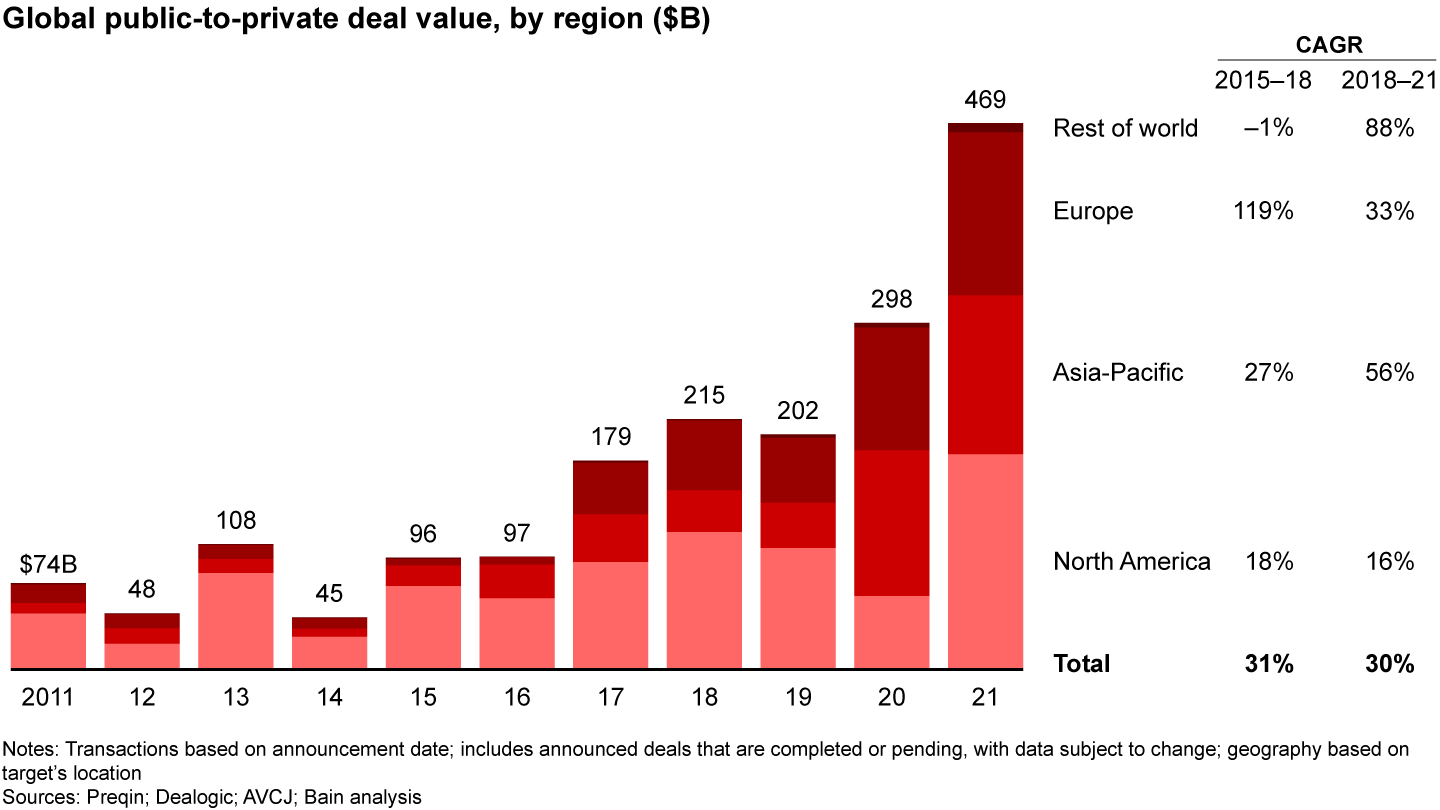
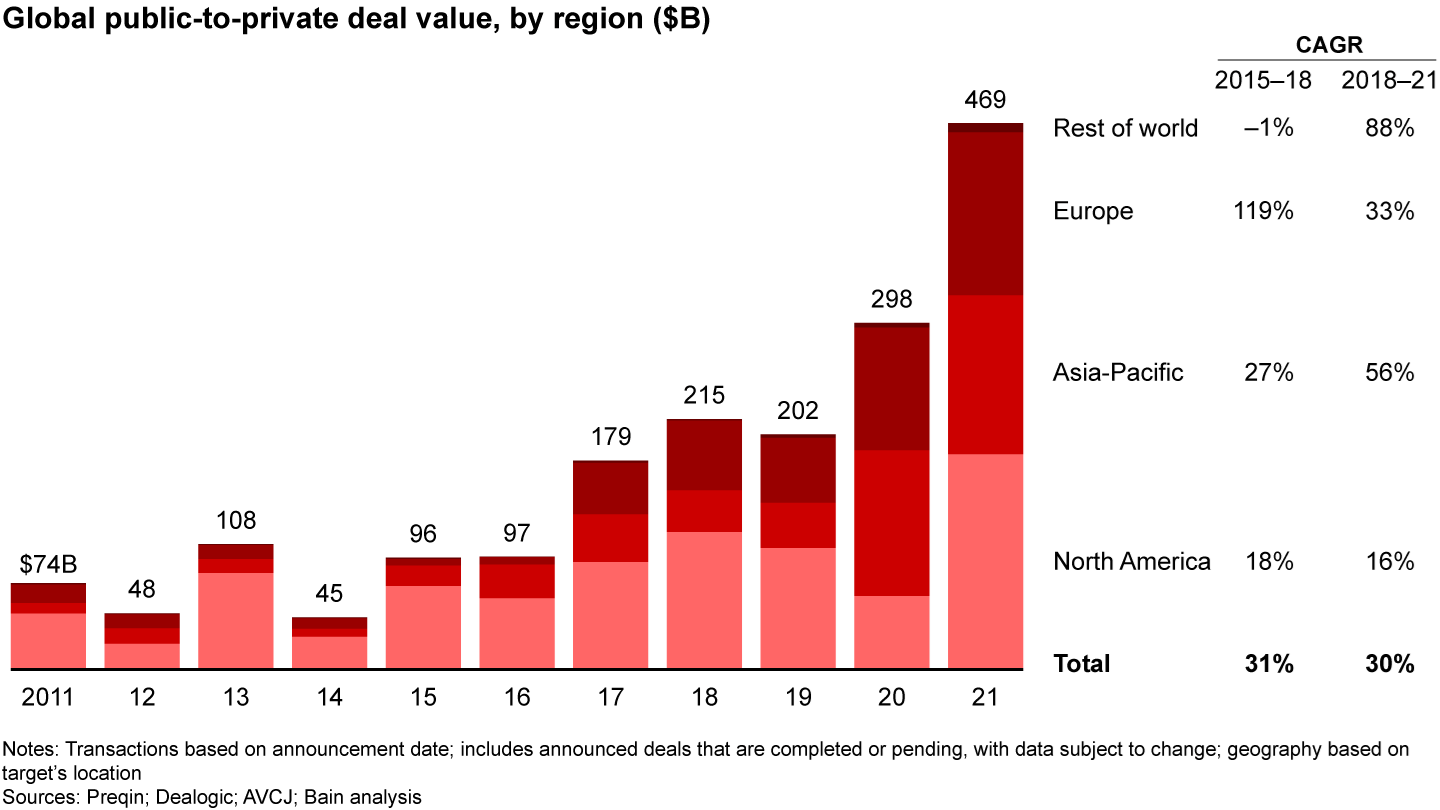
P2P deals by nature absorb a lot of capital because they tend to involve very large, established companies that often aren’t getting much love from the public markets. The ideal candidate offers steady cash flow, reasonable revenue growth, and a balance sheet that can support high enough levels of debt to generate strong returns.
The last time the market produced such a notable increase in large P2P transactions was in the run-up to the global financial crisis in 2006–07. That, of course, produced mixed results. While there were several notable home runs, a significant number of those deals proved to be overpriced and directionless. As a group, they produced lousy returns—a multiple of invested capital of roughly 1.5x, with a single-digit internal rate of return.
So is this year’s spike in P2P activity cause for concern? The impact of these deals was significant in both periods. In 2006, take-private transactions in the US made up around 91% of the sudden increase in value from 2005; in 2021, they accounted for 42% of the increase. Investors paid rich multiples for these companies in both time periods, but valuations in 2021 were actually higher: Multiples paid on P2P deals in 2007 on an enterprise value (EV) basis were 12.6 times earnings before interest, taxes, depreciation, and amortization (EBITDA)—or 1.3 times the market average. In 2021, P2P multiples were 19.3 times EV/EBITDA, or 1.6 times the average.
What really distinguished the 2006–07 time frame was that the deals were significantly larger, both in absolute terms and relative to the rest of the market. Among the top 10 P2P deals in those years, not one was below $24 billion. The largest in 2021, by contrast, was McAfee at $15.4 billion, including debt (see Figure 11). Because those deals were so huge, they required consortia of buyers—groups of large private equity funds cobbled together quickly just to get the deal done. The rush to close in those frothy times meant due diligence was often lax or nonexistent, and the management-by-committee ownership structures got in the way of establishing a clear value-creation plan.
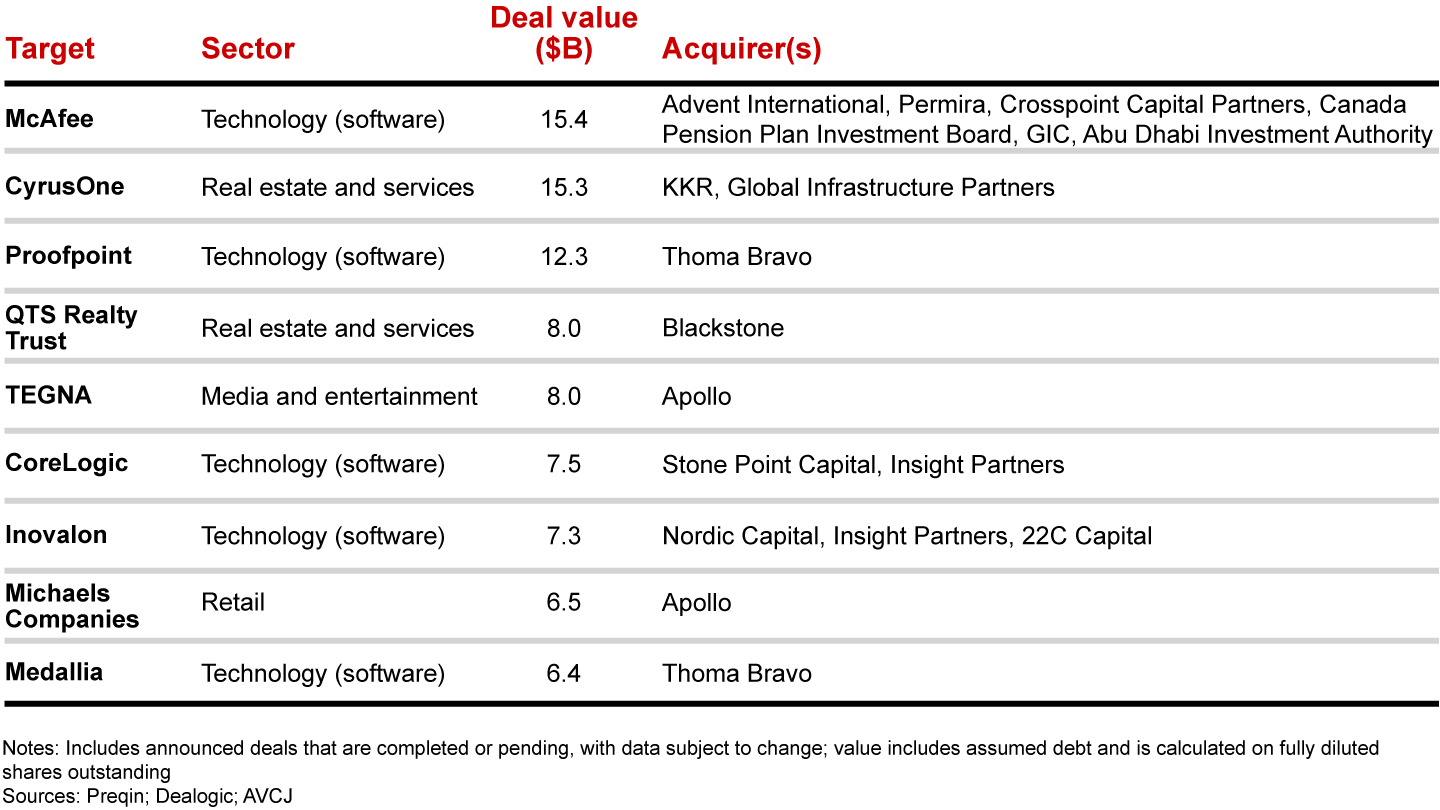
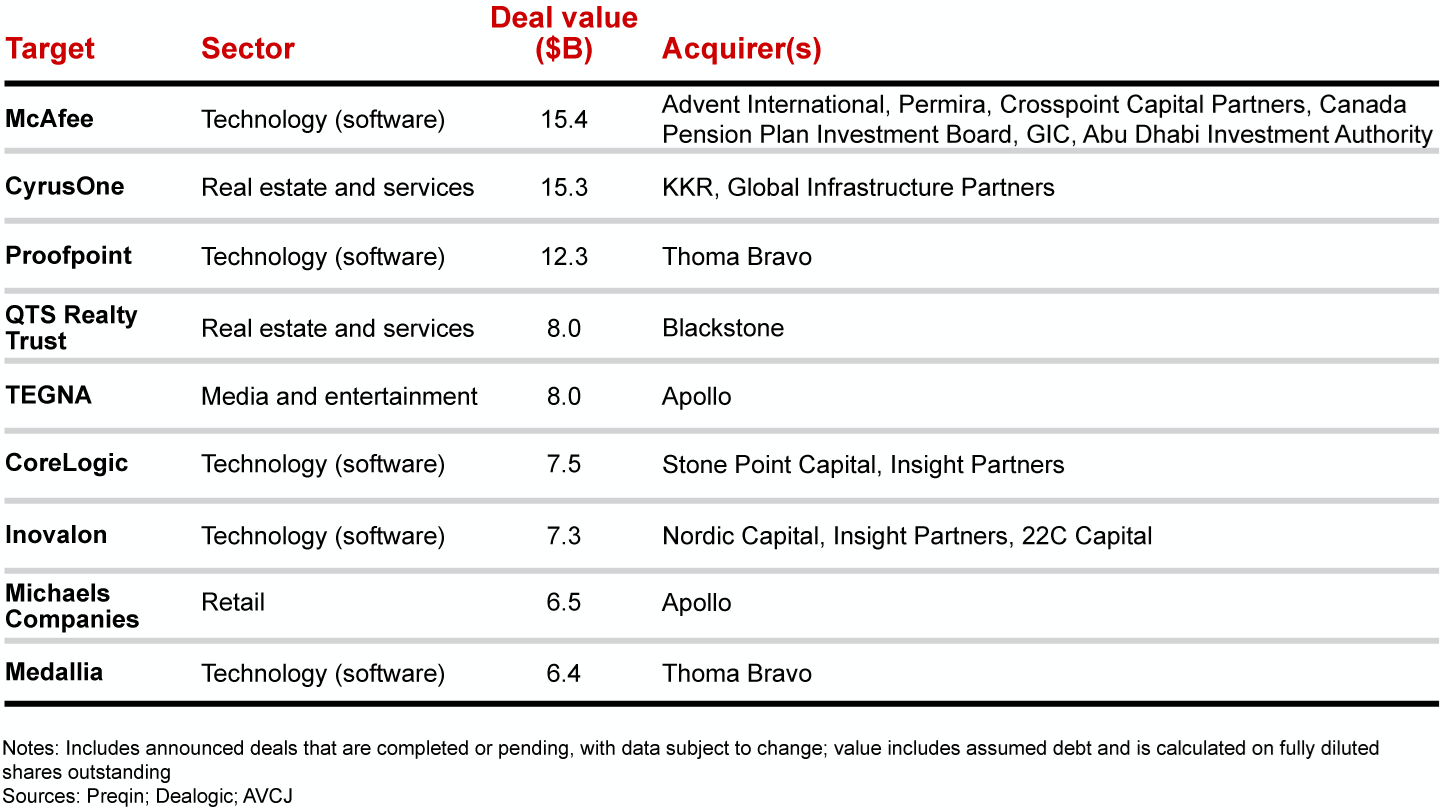
Not only were 2021’s P2P deals smaller by comparison, but they were typically done by one or two buyers with deep expertise in the sector—Thoma Bravo buying cybersecurity firm Proofpoint, for instance. The prices paid also reflect a clear bias toward tech deals, which command higher multiples, on average (see Figure 12). Those prices will inevitably dial up the heat on deal sponsors to execute effectively on clearly defined value-creation plans. But the chances of success are likely greater for a single firm with a long track record in a sector than for a group of odd bedfellows lacking a coherent value-creation plan.
What’s clear from the dry powder data is that buyout firms were heavily incented to put money to work in P2P deals last year. There is simply too much capital waiting in the wings, and large take-private transactions are an especially efficient way to write big checks. Indeed, by deploying large amounts of capital quickly over the last three years, buyout firms have seen their share of M&A activity globally rise to 19%, its highest level since 2006 (see Figure 13).
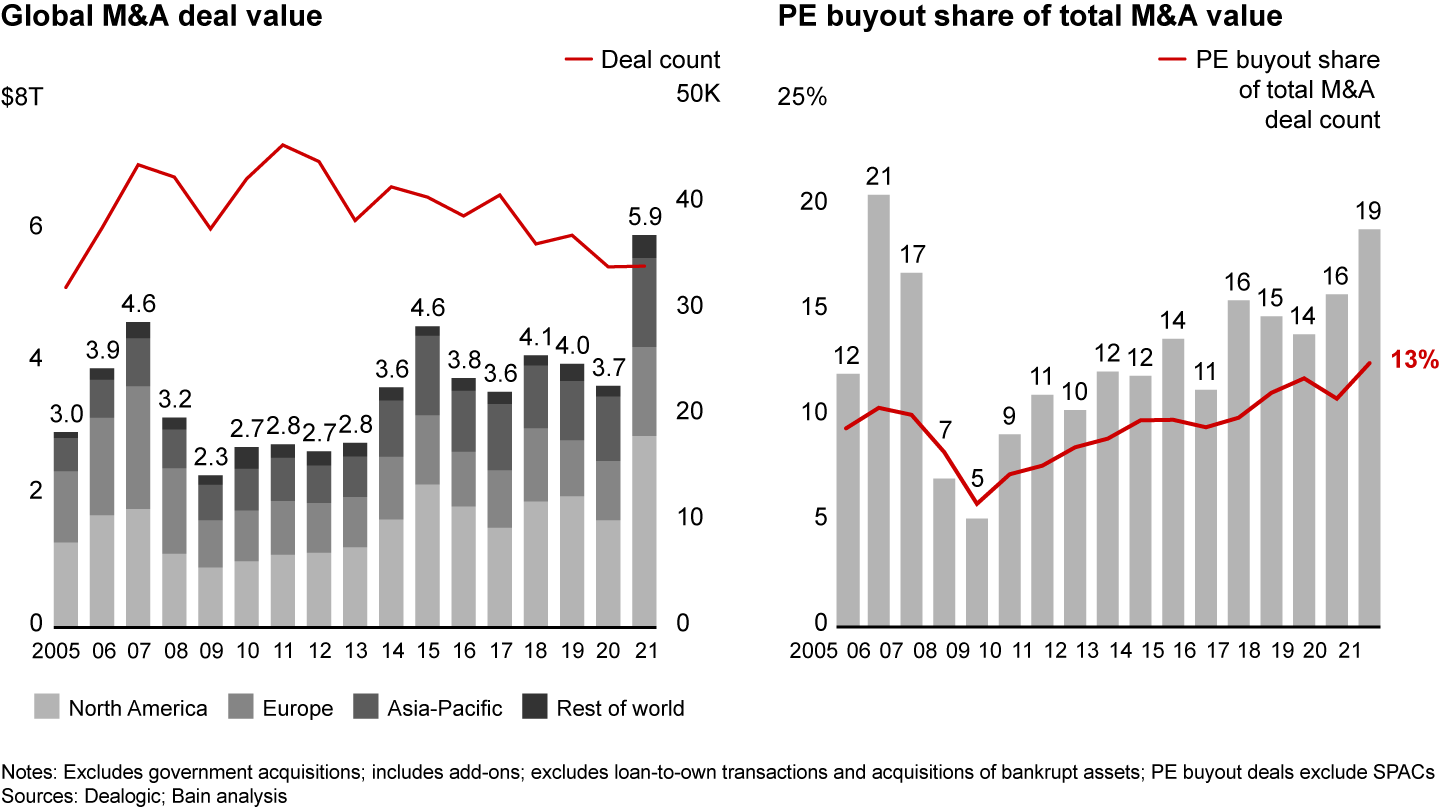
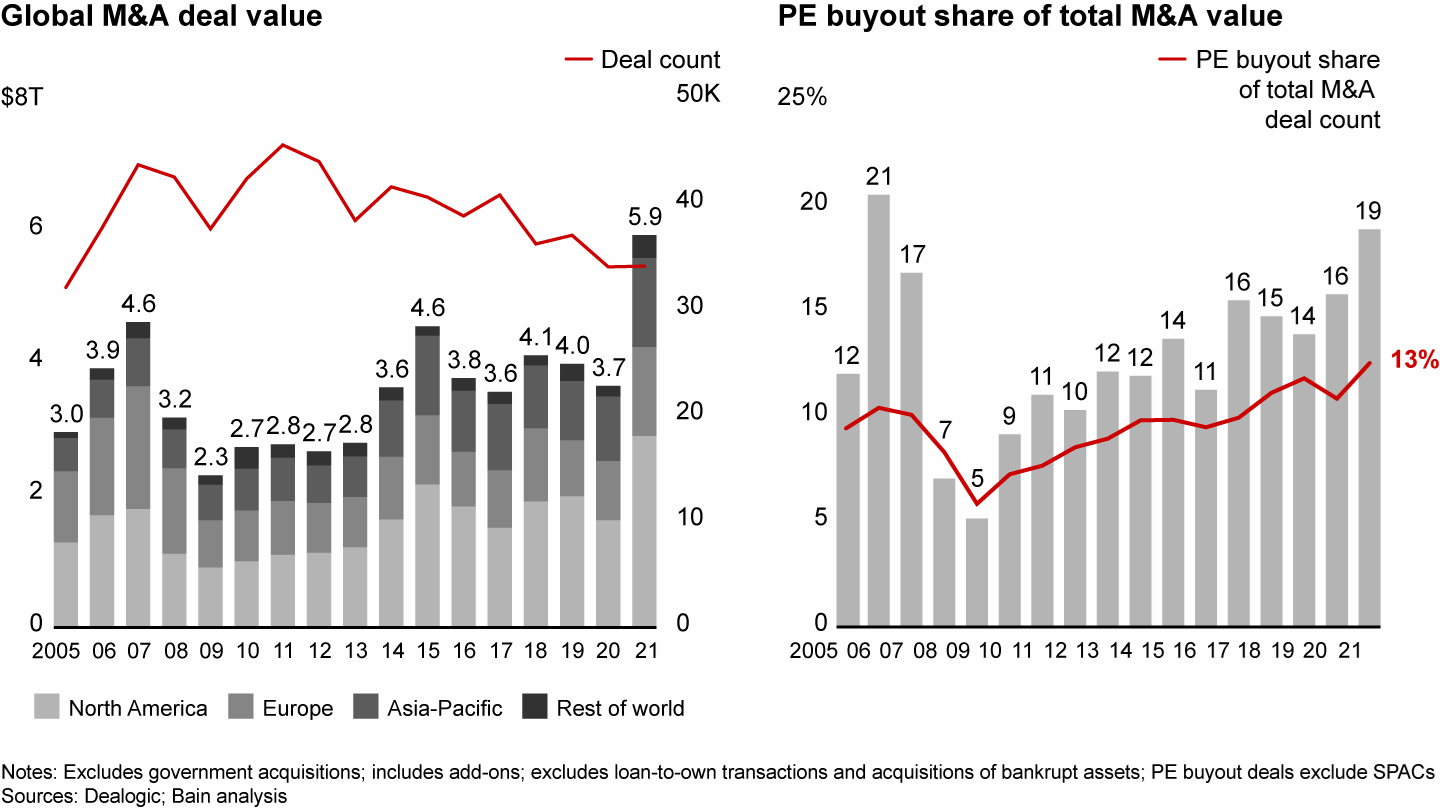
The push, however, has come at a cost: Average buyout multiples in 2021 rose 9% to 12.3x in North America, and, despite a slight decline, still stood at a lofty 11.9x in Europe (see Figure 14).
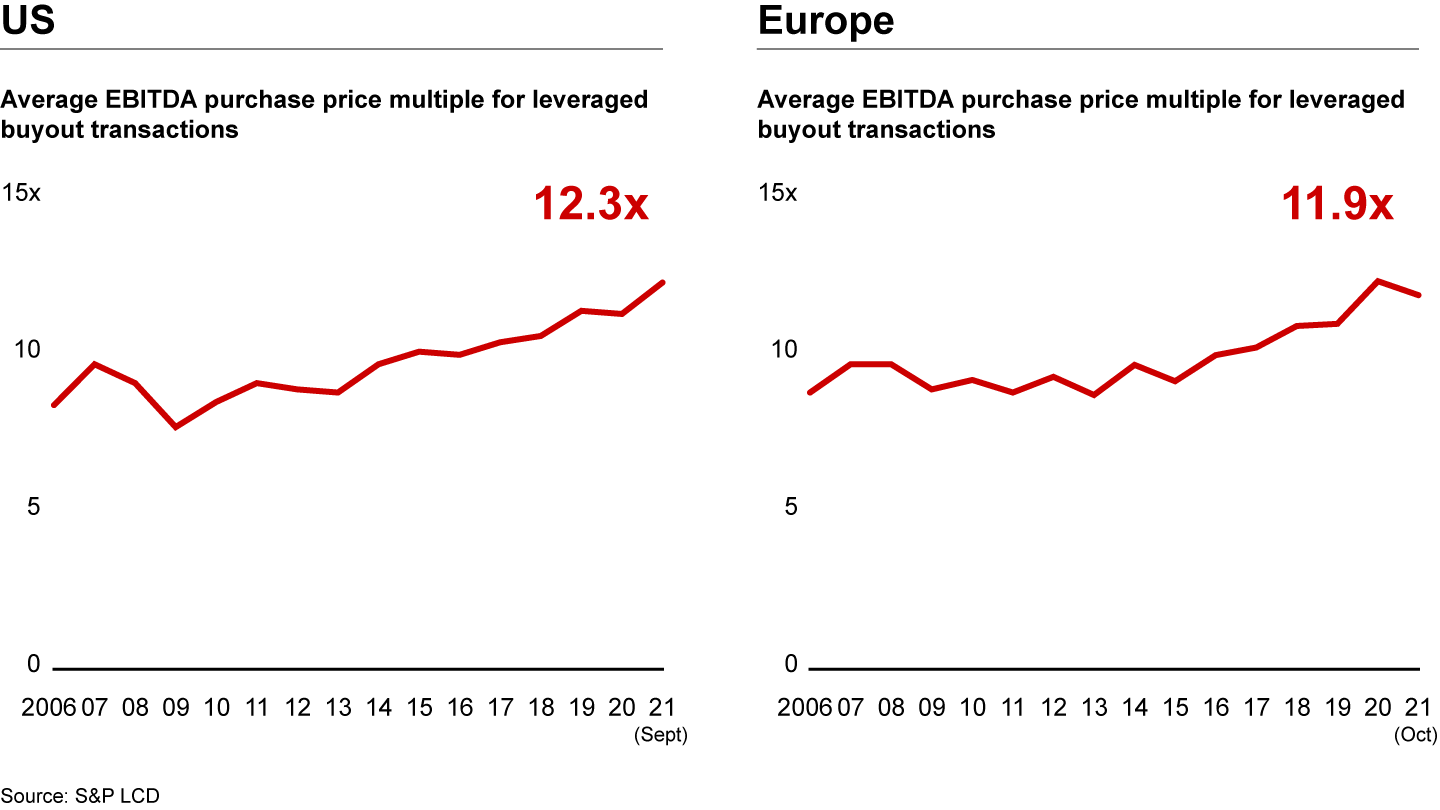
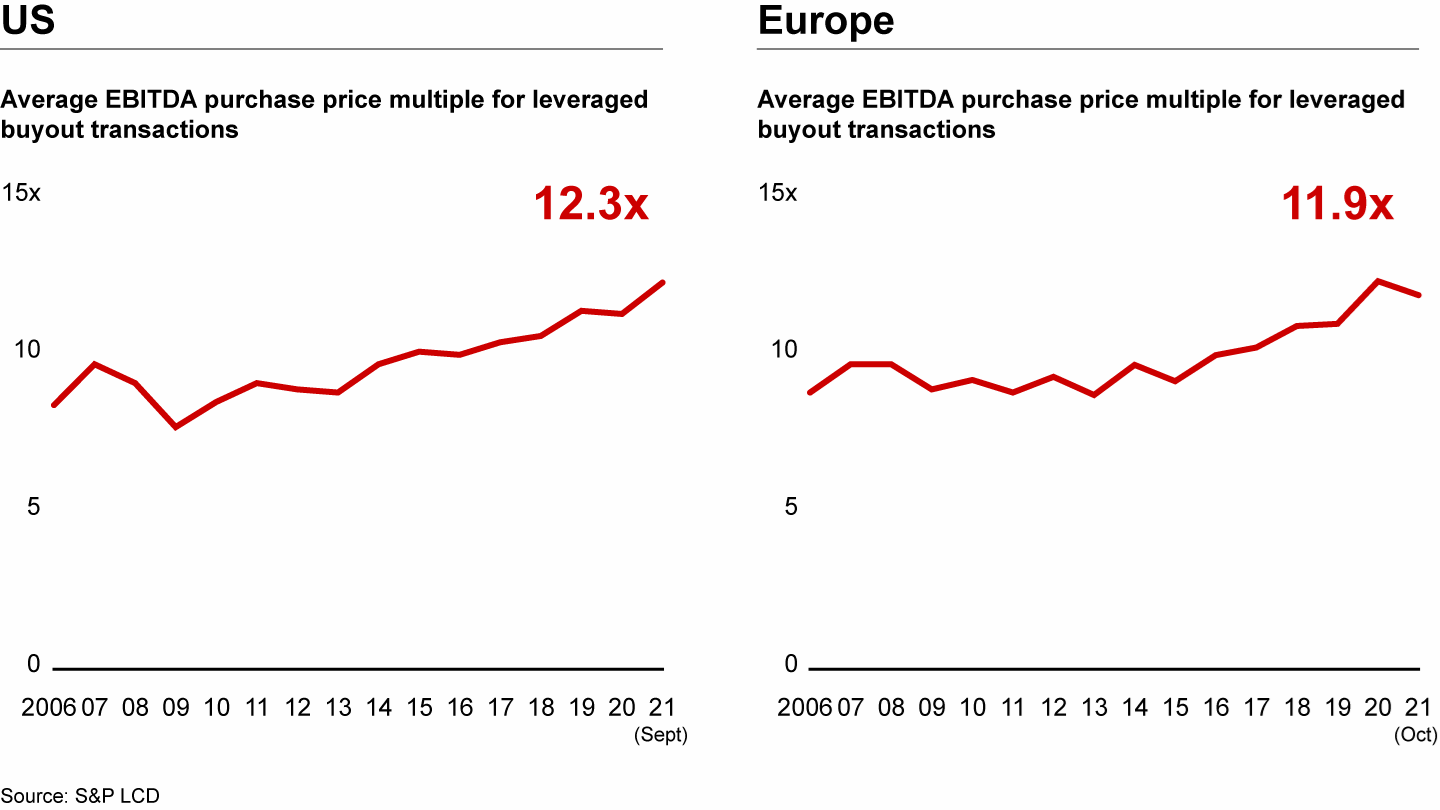
The rising market share (at rising prices) may signal a willingness on the part of private equity funds to outbid corporate buyers and other rivals for prized assets. Whether that makes sense will ultimately depend on a buyer’s reason for paying full price. In some cases, funds may simply be outbidding the competition because they have money to spend. But in many cases, private equity owners have themselves become corporate buyers. Add-on transactions have accounted for almost 20% of all deal value over the past five years, as funds use acquisitions to turn portfolio companies into scale players. Because those deals tend to offer synergies and strategic benefits, the buyer can often afford to pay a premium.
The increased level of pricing across the industry may also reflect something else: the bet that more and more investors are making on technology-fueled growth. While investment has remained robust across sectors, one in three buyouts now involves a technology company (see Figure 15). Counting the growing number of sectors, like fintech, healthcare, and business services, where outperformance is increasingly a function of technology expertise, the percentage may be more than half.
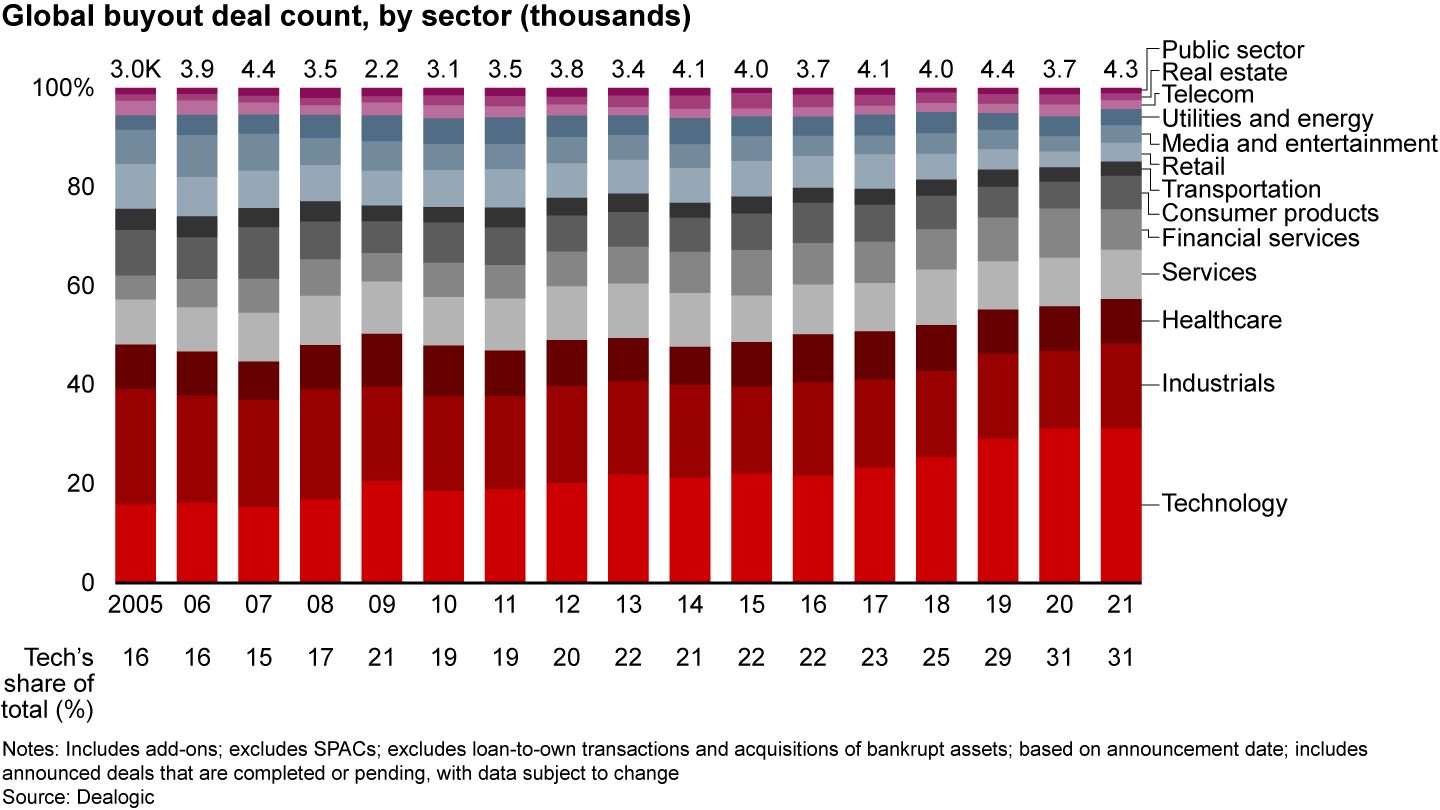
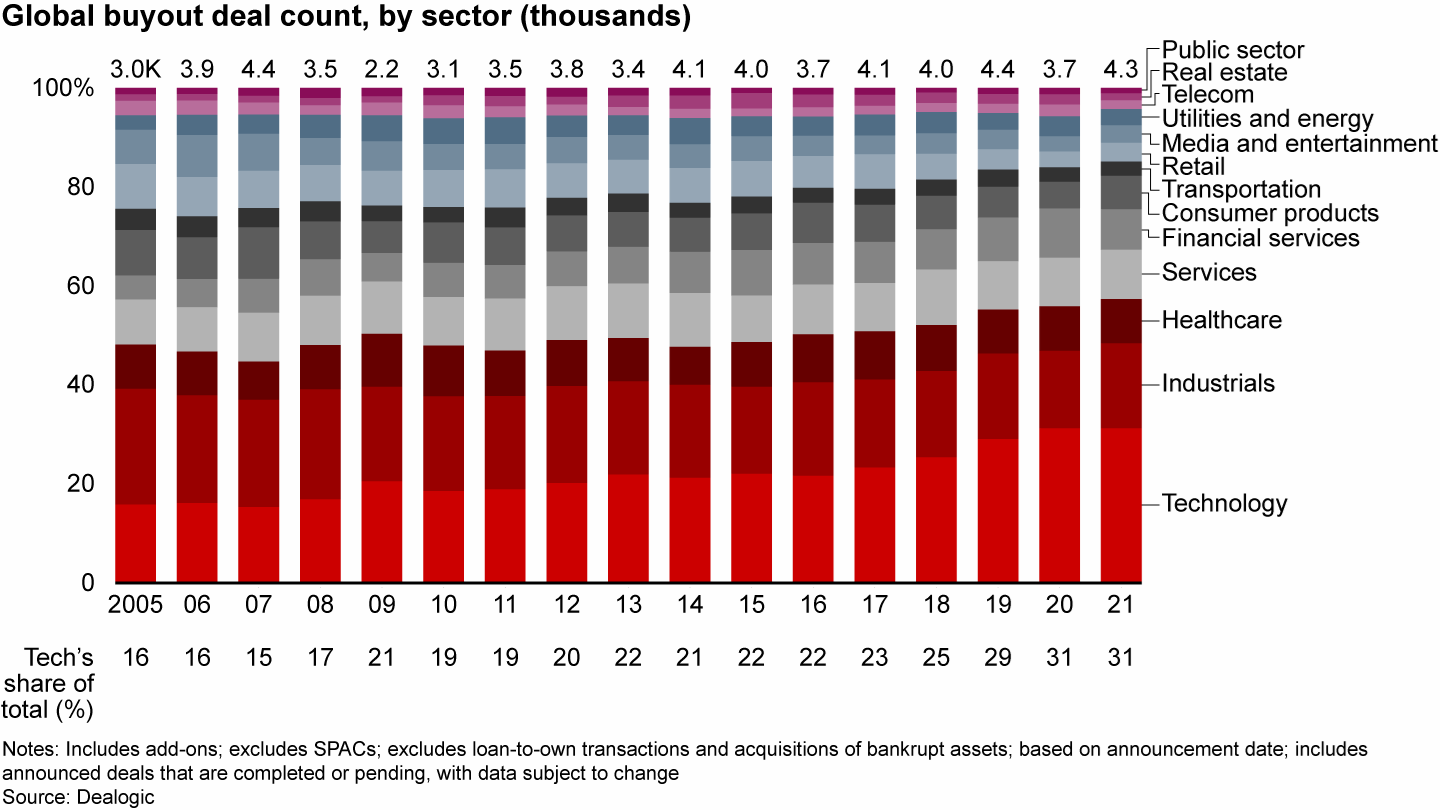
This wholesale change in how private equity investors approach the market shifts the investment calculus from underwriting cost to underwriting growth, which tends to justify higher multiples. However, this sort of investing is a different ball game in many ways. Understanding what’s changing in a given sector and underwriting both value and risk will require different motions for firms more accustomed to making money the old way. Consider the investment Blackstone has made over the last couple of years to build a growth capability that can help power returns across the entire firm.
The move into technology and growth is part of a pronounced shift toward specialization in the private equity industry. As mentioned earlier, LPs are increasingly looking to meet specific needs and allocations by investing across sectors and asset classes. That is spurring robust expansion in a variety of sector specializations, as well as in areas like secondaries, infrastructure, long-term funds, and venture capital.
Infrastructure funds, for instance, have evolved since the days when they were primarily focused on investing in cash-generating public infrastructure like toll roads. They have broadened their focus to sectors that ostensibly are operating businesses but derive most of their value from real estate and other hard assets. Antin Infrastructure Partners IV, for instance, spent around $700 million in 2021 to acquire Hippocrates Holding, a leading Italian pharmacy platform. Macquarie Asia Infrastructure Fund 2 acquired AirTrunk, a company that develops and operates large-scale data centers across the Asia-Pacific region.
These are steady, moderate-growth businesses for which funds set lower return hurdles. But because LPs value balancing their allocations with this kind of exposure, infrastructure funds have grown rapidly, attracting $120 billion in new capital in 2021 and besting their five-year average by 30%.
Exits
As vibrant as the market for investments was in 2021, exit markets were just as strong. Buyout funds unloaded $957 billion in assets globally, more than doubling a strong 2020 total and beating the five-year average by 131%. Once again, North American funds captured the most value, and the technology sector produced the largest share of deals. Yet exit activity showed extraordinary growth around the world, especially in the Asia-Pacific region (see Figures 16 and 17).
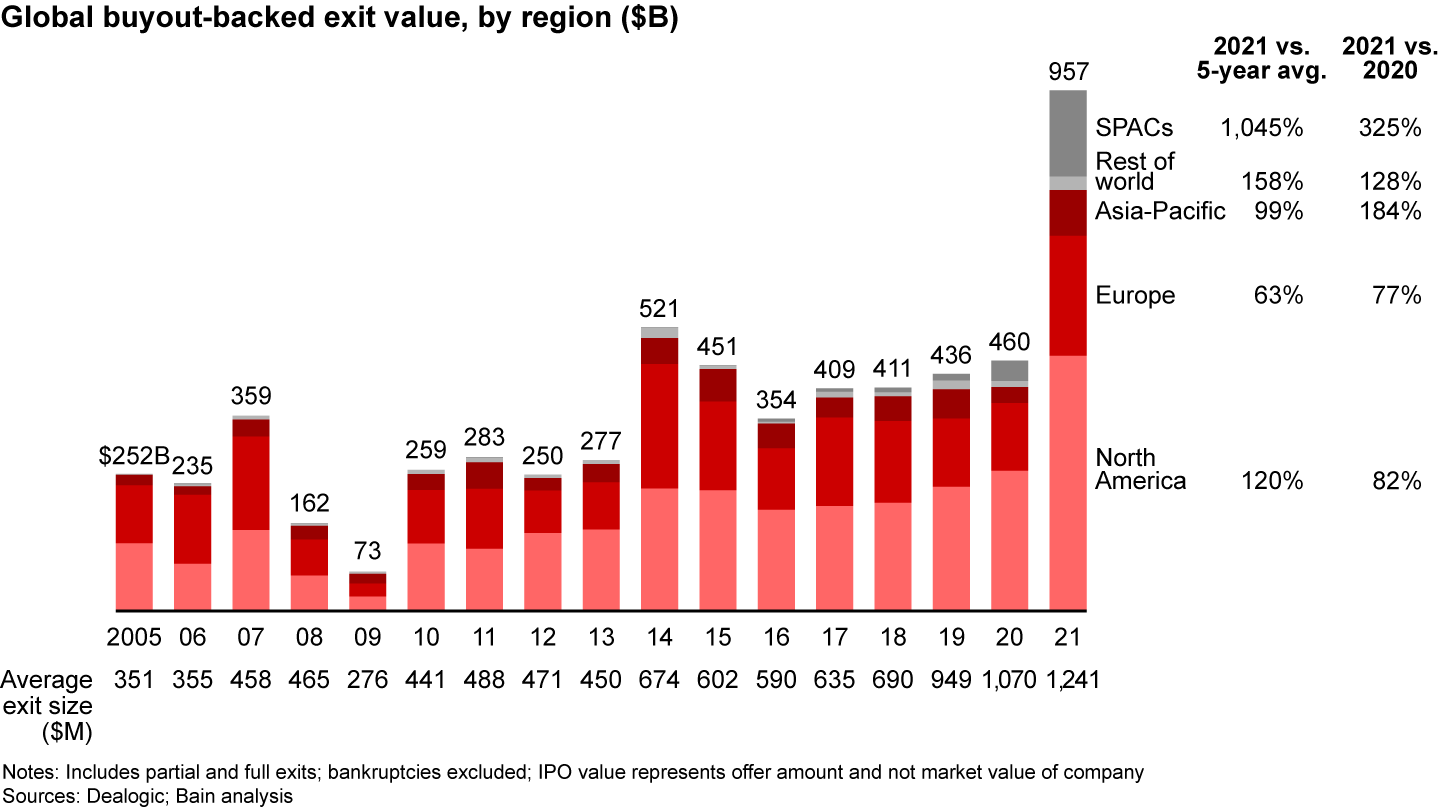
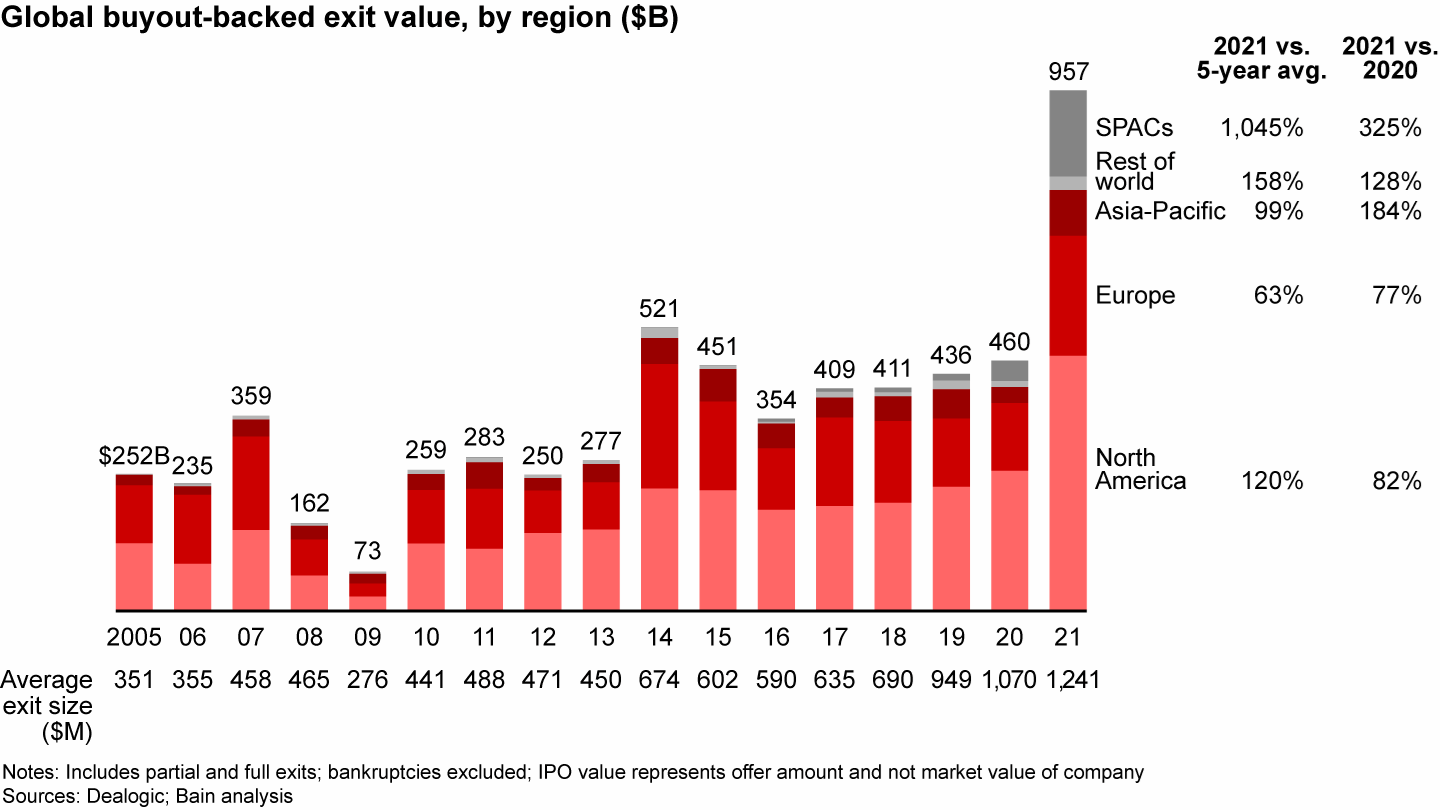
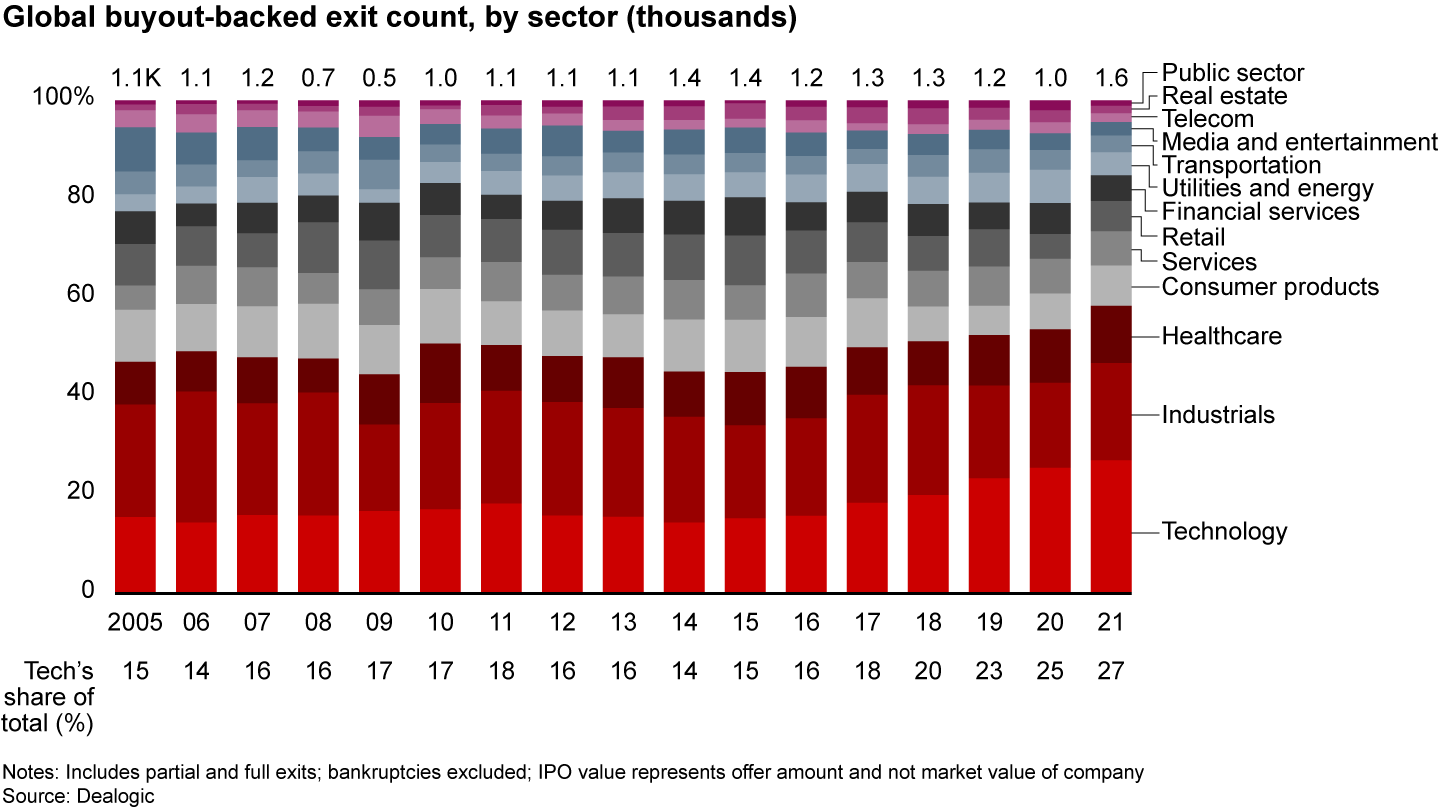
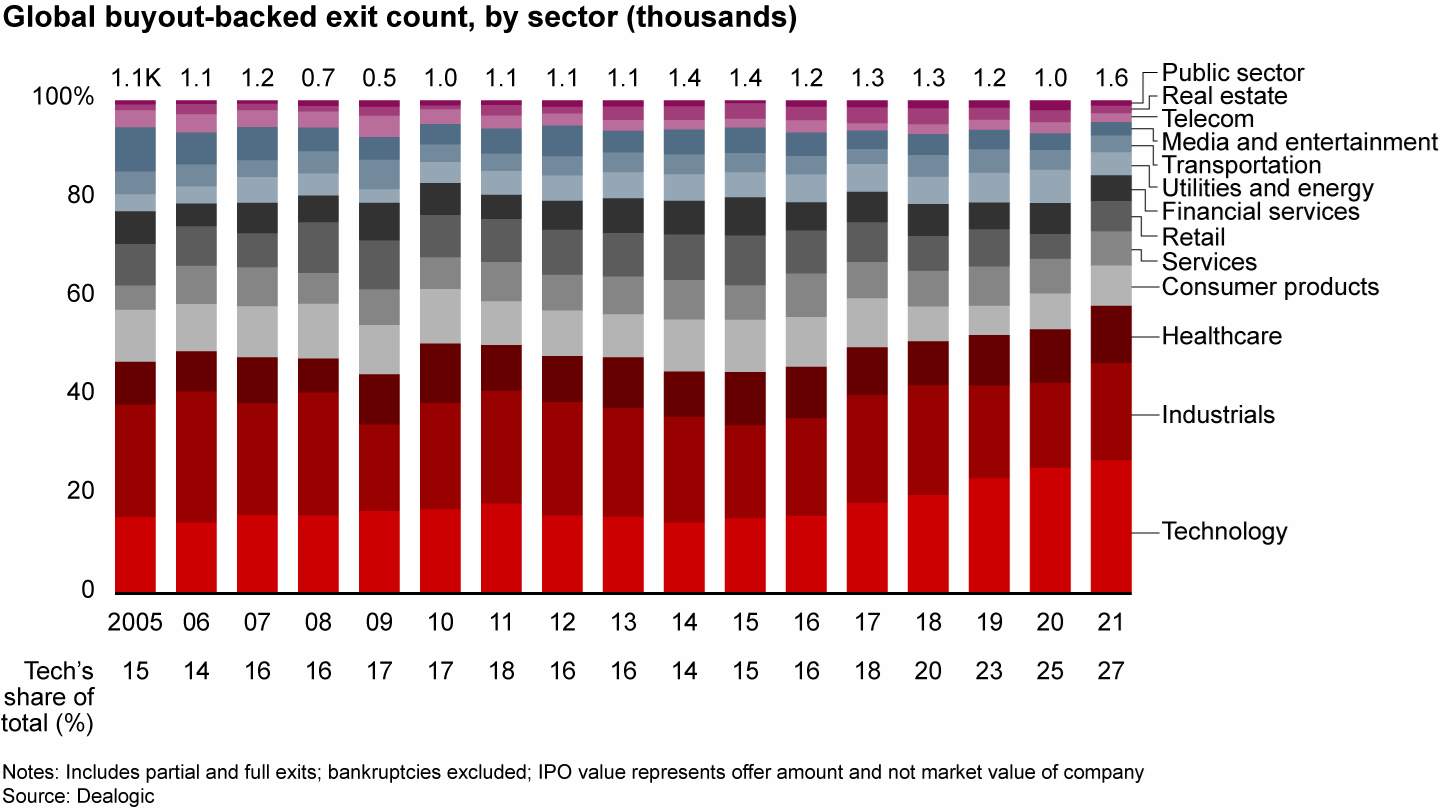
This uncommon performance was made possible by an equally uncommon alignment in the markets. Each and every exit channel—both old and new—was about as attractive as it could be in 2021 (see Figure 18).
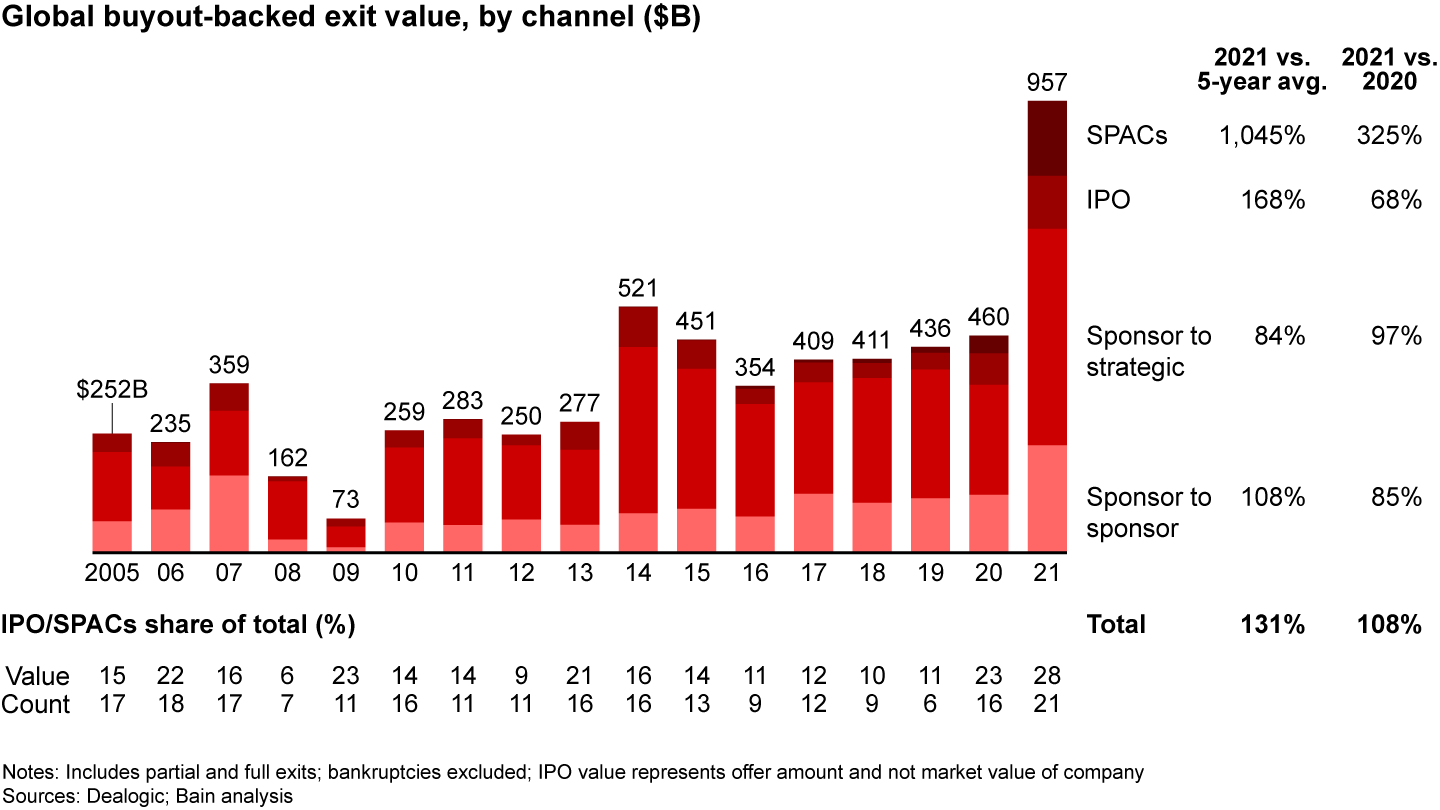
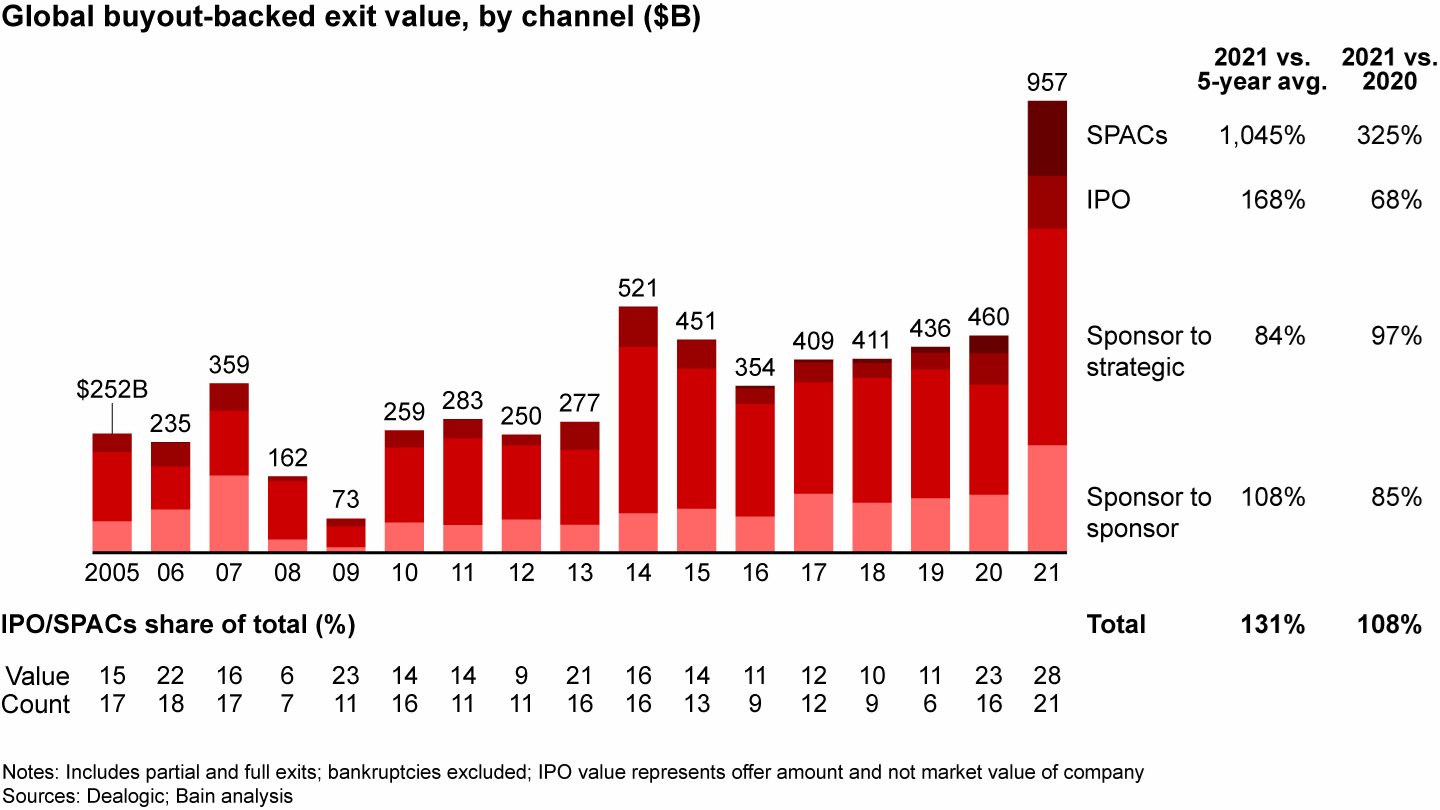
Massive amounts of dry powder drummed up deals between sponsors. Soaring public markets led to a burst in IPO activity. Rising stock prices and better-than-expected economic growth gave corporate buyers ample currency for strategic deals. The rise in special-purpose acquisition companies (SPACs) also played a role, albeit mostly in the growth sphere. Prices were soaring, markets were hungry, and the cost of debt was near zero.
For GPs, this perfect storm environment meant one thing: If any asset in your portfolio was ready to sell, now was the time to do it.
Corporations, which tend to view private equity ownership as a seal of approval, were the most voracious buyers of former portfolio companies, pumping $458 billion into the market, or double what they spent a year earlier. Sponsor-to-sponsor deals were next at $228 billion, with SPACs coming in third at $158 billion (although that number includes the full value of deals in which buyout firms owned minority shares). What made the SPAC volume stand out was the fact that it rose from just $37 billion in 2020, a 325% increase. IPOs also grew rapidly, adding $112 billion in volume, up from $67 billion in 2020, as sponsors rushed to take advantage of soaring equity markets, particularly in the US.
The rise, fall, and rise again of SPAC IPOs over the past two years has been a sight to behold. Once an arcane financing vehicle few had ever heard of, SPACs burst into the mainstream in 2020, with new issues reaching a fever pitch in early 2021. SPACs are shell companies with no operations that raise capital through an IPO and use the proceeds (alongside PIPE financing and, sometimes, debt) to fund one or more mergers, which then form the basis of an ongoing public entity. They typically are on a time clock, meaning they have to spend the money within a given time frame, a period that has been slipping in new deals from 24 months to between 12 and 18 months.
SPAC IPOs grew rapidly in 2020 amid roaring equity markets and reached a peak of $36 billion in funds raised each month in February and March of 2021. But then regulatory and accounting issues, combined with declining post-merger SPAC share prices, dramatically reduced new issues, and value plummeted to $3 billion in April. Since then, volume has slowly revived as SPAC sponsors began offering investors better terms, including overfunded trusts, shorter expiration periods, and more investor-friendly warrant structures. The market settled into a relatively steady cadence of about 30 SPAC IPOs per month over the summer before increasing again in the fourth quarter to a level closer to 60 per month (see Figure 19).
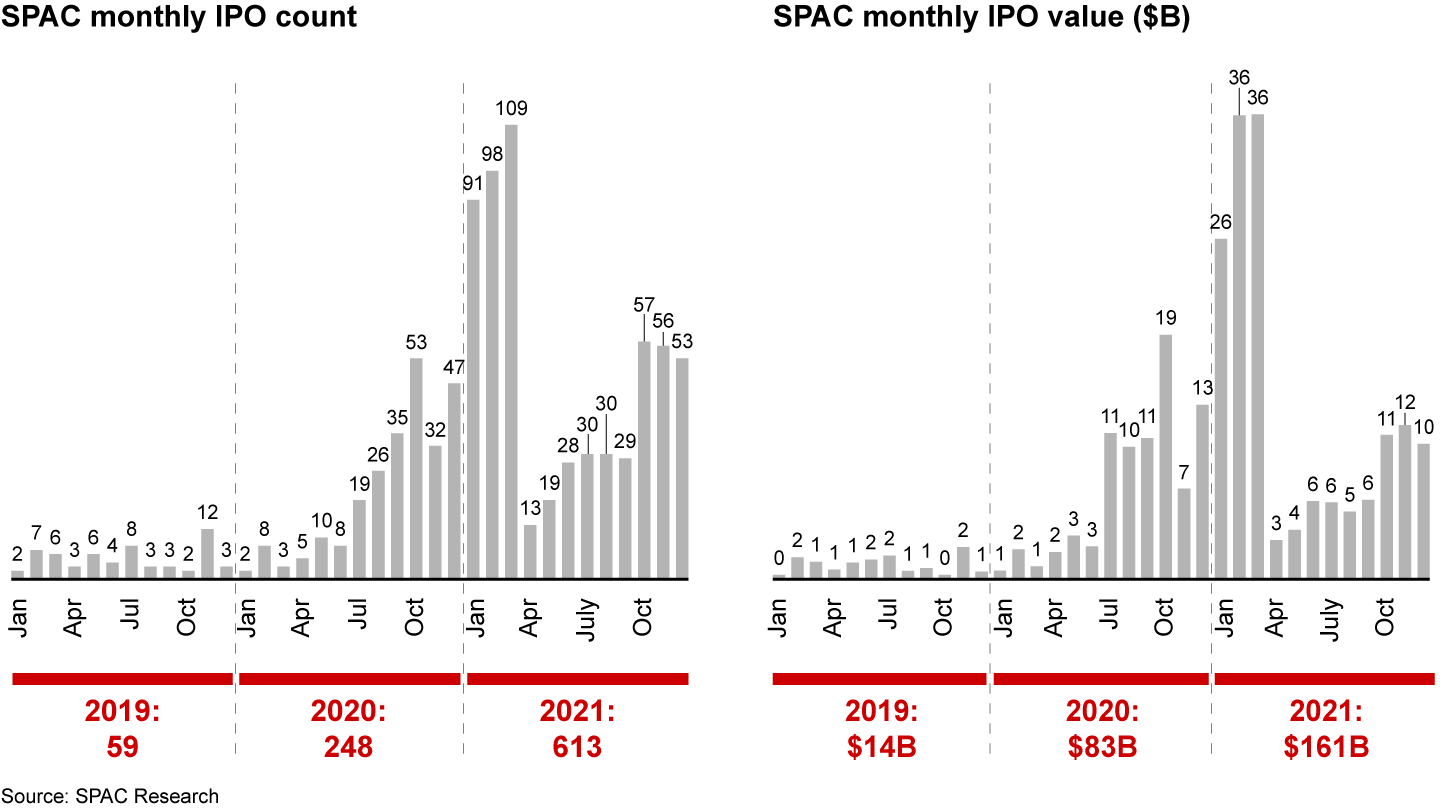
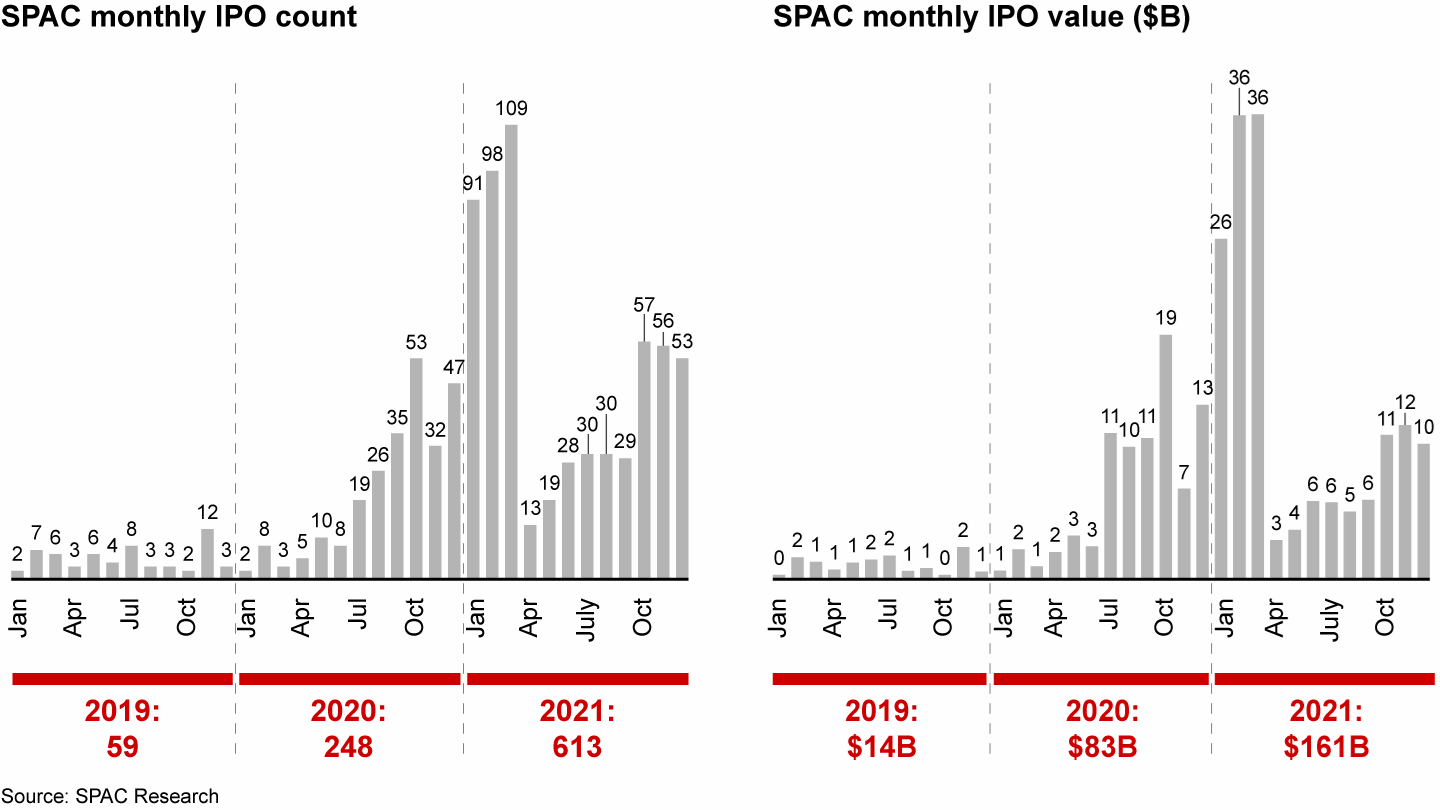
It’s easy to forget that, despite all the volatility, the SPAC boom had created an army of 575 public shell companies as of December 2021, a number that has been growing pretty steadily for two years. Those shell companies are stalking the market for targets and are highly motivated; many of them will expire in early 2023 if they aren’t successful in putting the money to work.
If they were to succeed, they would create new public companies at a pace not seen since the dot-com boom of the late 1990s. Indeed, the 575 “searching SPACs” represent around 12% of the more than 4,000 public companies listed in the US (see Figure 20).
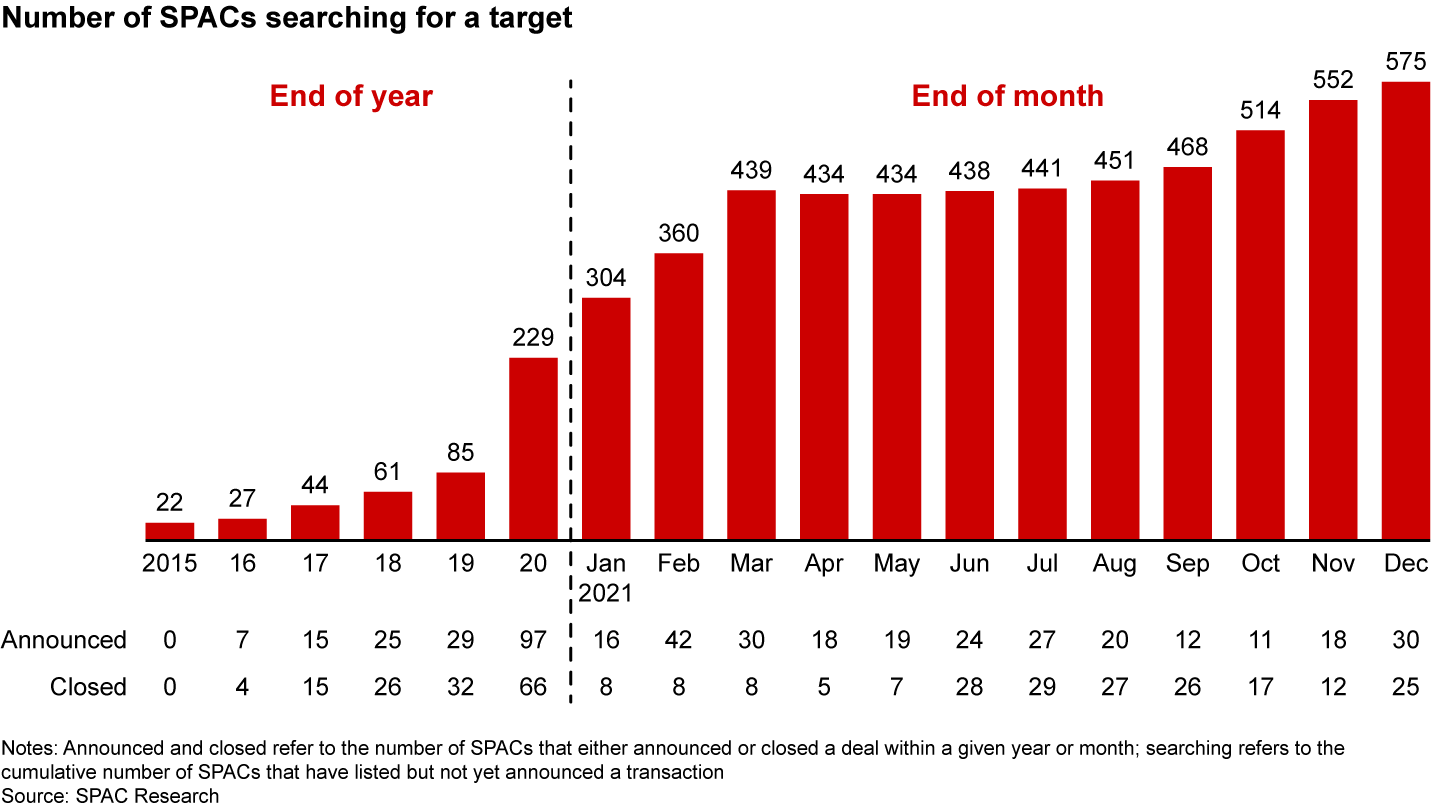
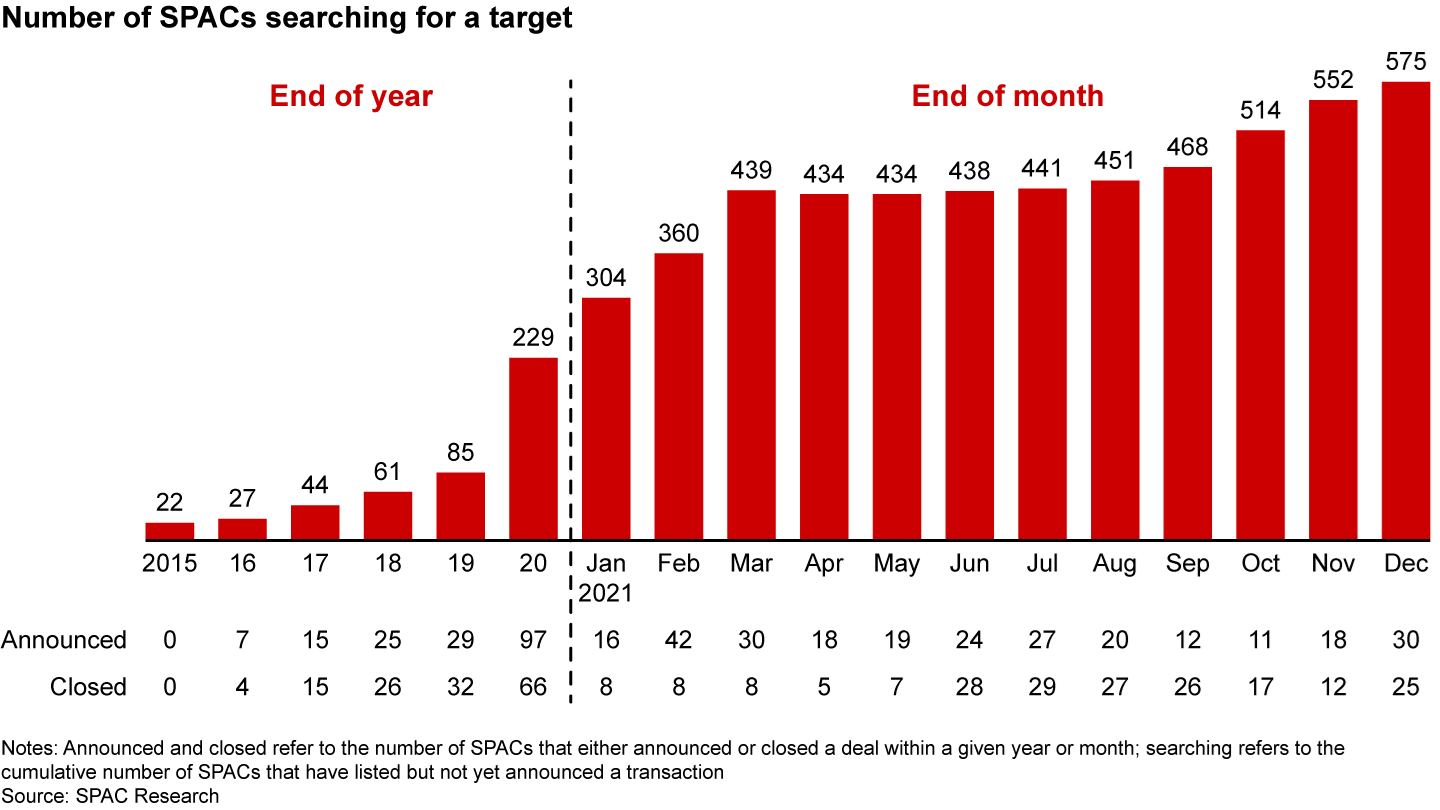
That seems unlikely, however. At the SPAC merger pace set in the fourth quarter of 2021, more than 200 SPACs would be forced to liquidate by March 2023.
The long-term impact of SPACs on the buyout world is hard to evaluate. SPAC deals to date have trended heavily toward flashy, high-growth venture-type companies rather than the larger, more established companies found in buyout portfolios. It’s possible that will change as the SPAC market evolves, but given their volatility, it’s difficult to handicap their staying power. Performance remains an issue; a Bain analysis of market returns for various cohorts of SPACs shows they have badly trailed the S&P 500 over the past two years. How the market plays out over the next 6 to 24 months will likely determine the long-term steady state of SPAC IPO issuance and its impact on the private equity industry.
Even as GPs tapped exit channels with a vigor unseen in years, they were seeding the growth of the secondary market, an alternative channel that gives funds the flexibility to delay or transform exits depending on what’s happening with individual companies and markets.
While private markets outperform public markets over every time period, the one big disadvantage for investors is a lack of liquidity. LP capital is typically locked up for a period of three to five years, and GPs are under pressure to pay it back after that period, even if they still see value in holding an asset. By creating a market for preexisting investor commitments, secondaries provide liquidity that solves the problem on both sides; it gives LPs a way out when they need it and allows GPs to stay involved with a promising asset as long as they see fit.
Even as GPs tapped exit channels with vigor, they were seeding the growth of secondaries, an alternative channel that gives funds the flexibility to delay or transform exits.
Over the past several years, special-purpose vehicles, continuation funds, and other vehicles have emerged that allow GPs to transfer existing commitments between funds, freeing up LP capital or resetting the clock.
Firms are also buying up secondary funds or building secondary expertise to increase their exposure to what is emerging as a new asset class. CVC, for instance, recently said it would acquire Glendower Capital, while Franklin Templeton acquired Lexington Partners. TPG, meanwhile, hired two secondary experts from Landmark Partners, which itself was acquired by Ares Management. Because these vehicles are hard to classify, existing data sources understate their growth. But anecdotal evidence suggests secondaries are expanding rapidly, and 86% of LPs in the Coller Capital survey said they expect the class to keep up the growth over the next three years.
Fund-raising
In a year marked by new records set, private market fund-raising didn’t disappoint. Global funds raised across the full private capital spectrum hit $1.2 trillion, a 14% increase from the 2020 total and the highest level ever reached. Buyout funds raised $387 billion in 2021, their second-best year ever. But growth, venture, and infrastructure all grew faster relative to their five-year averages, and buyout’s share of the total has flattened at around 30% over the past several years (see Figures 21 and 22).


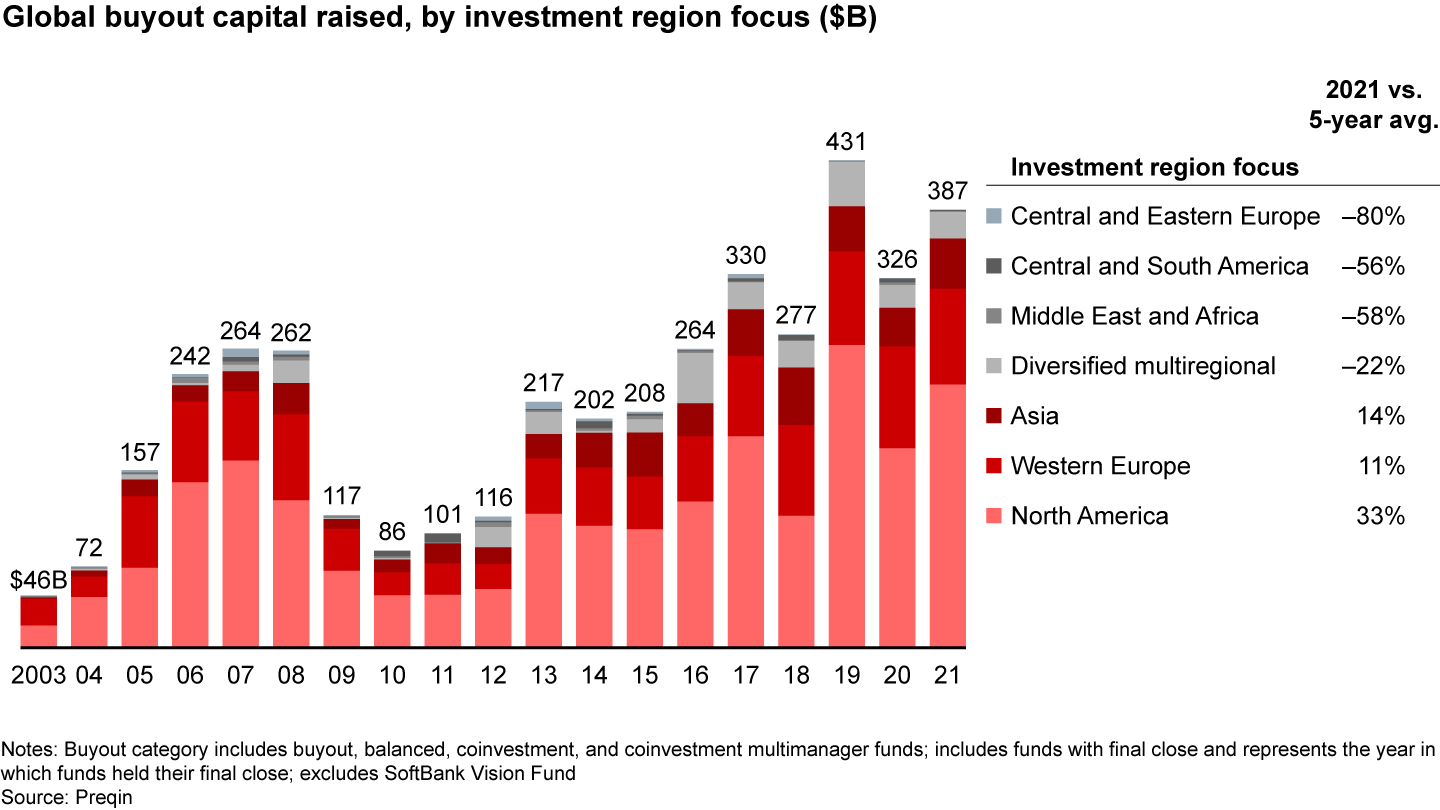
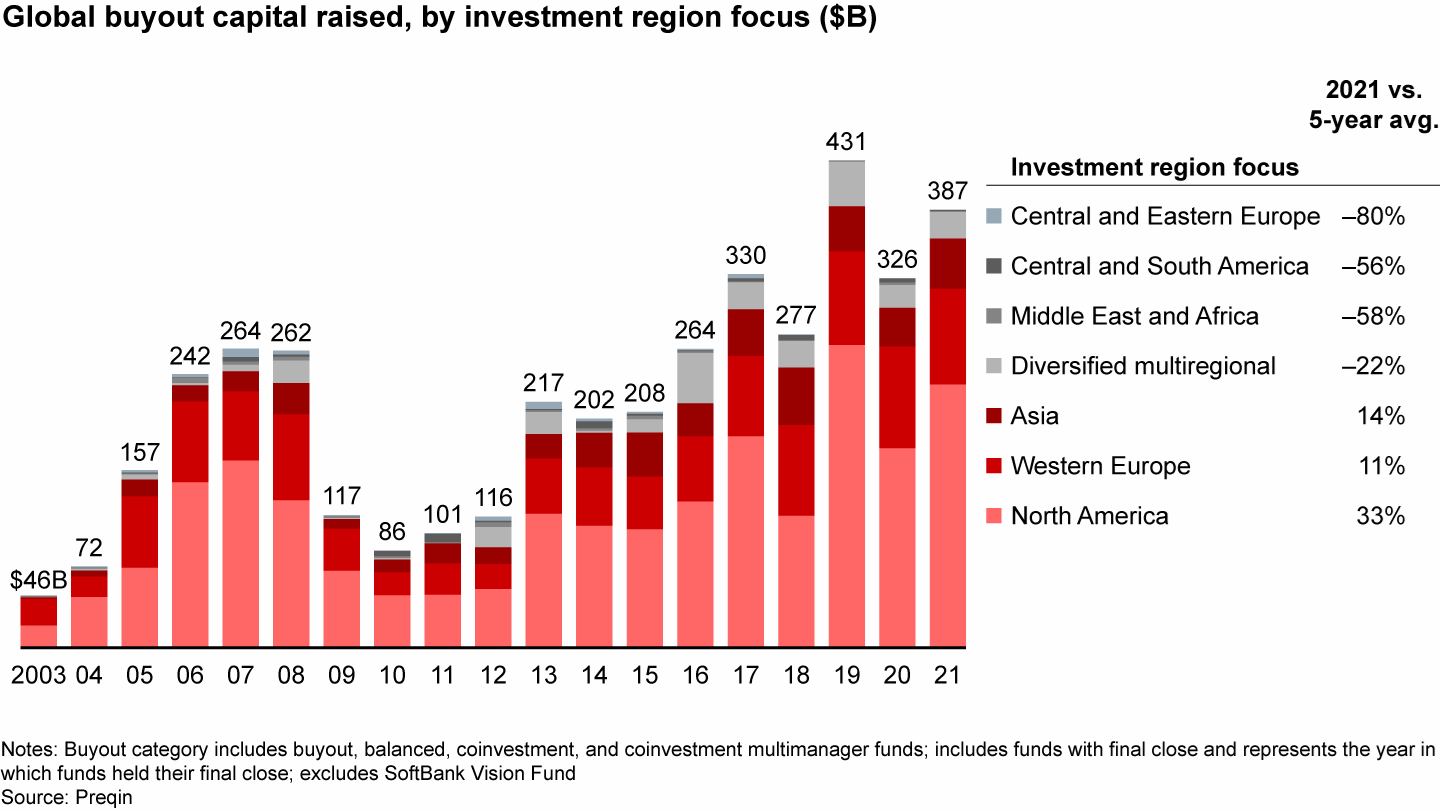
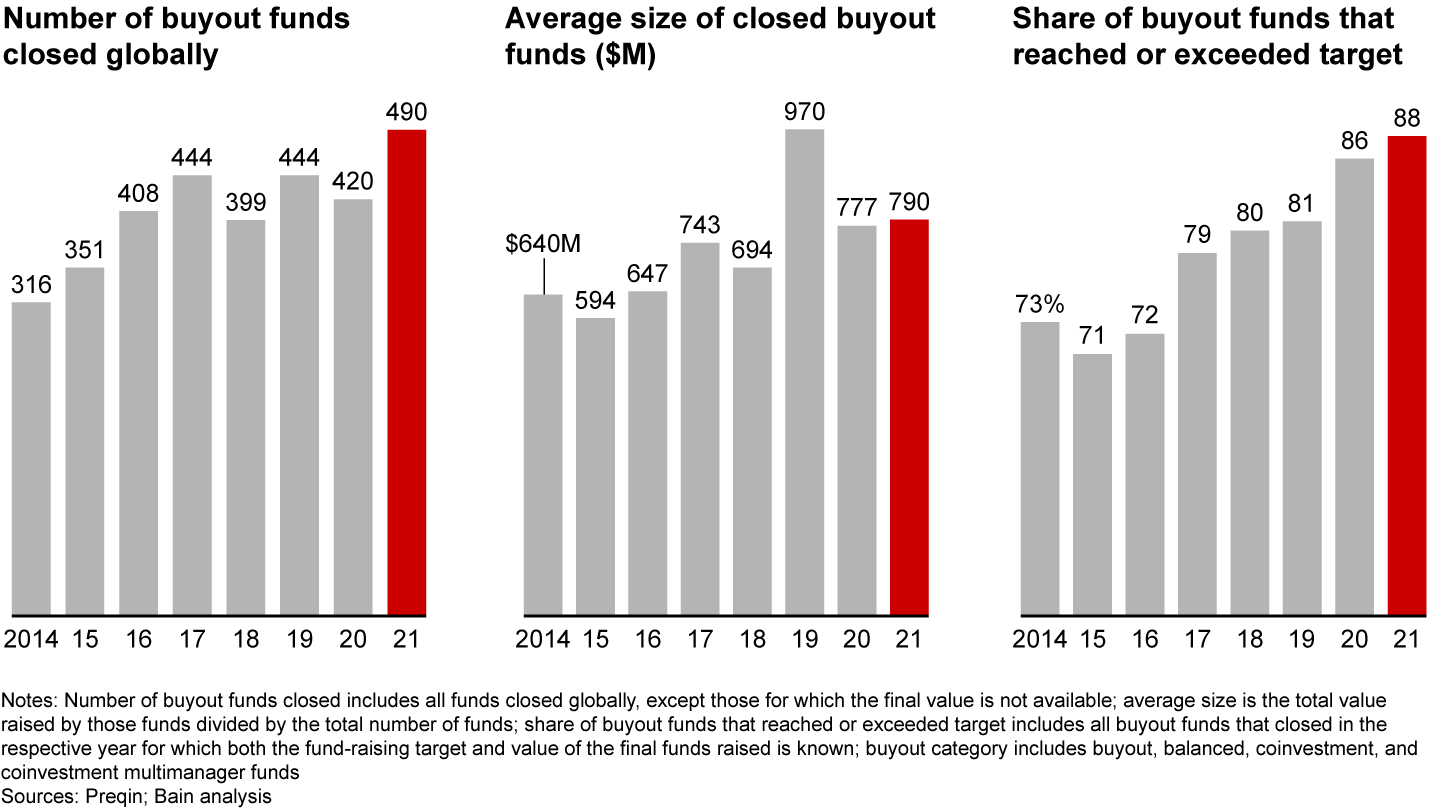
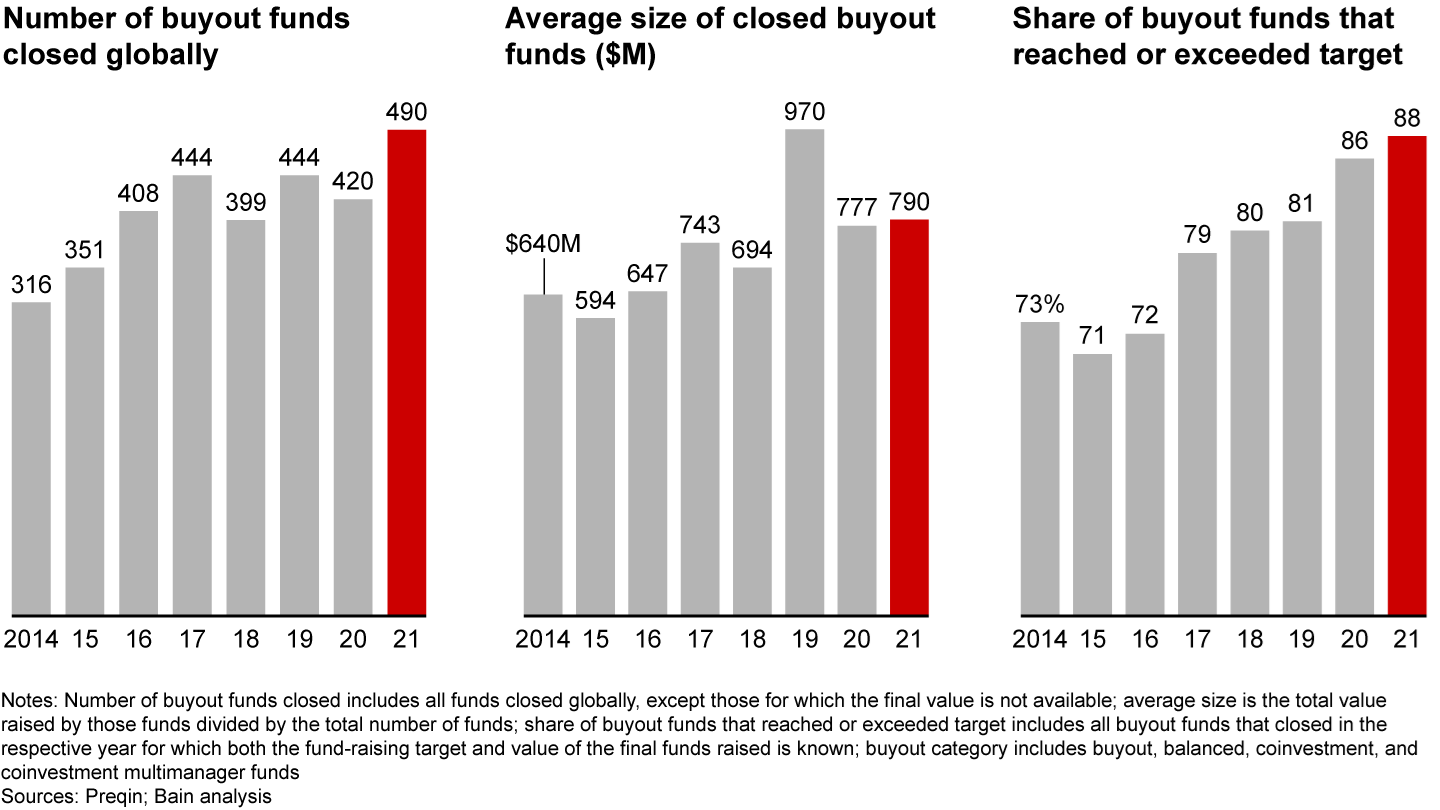
Investor enthusiasm for private equity shows no signs of waning. A full 88% of LPs surveyed by Preqin in 2021 said that they expect to increase or maintain their PE allocations this year, and 95% said they will do so over the longer term. The enthusiasm translated into a strong year on the road for most funds and a now-familiar pattern in fund-raising: The big get bigger. More funds closed in 2021, the average size kept creeping upward, and the majority closed at or above target (see Figure 23). The largest funds—those with assets under management greater than $5 billion—continued to attract almost half of all buyout capital raised (see Figure 24).
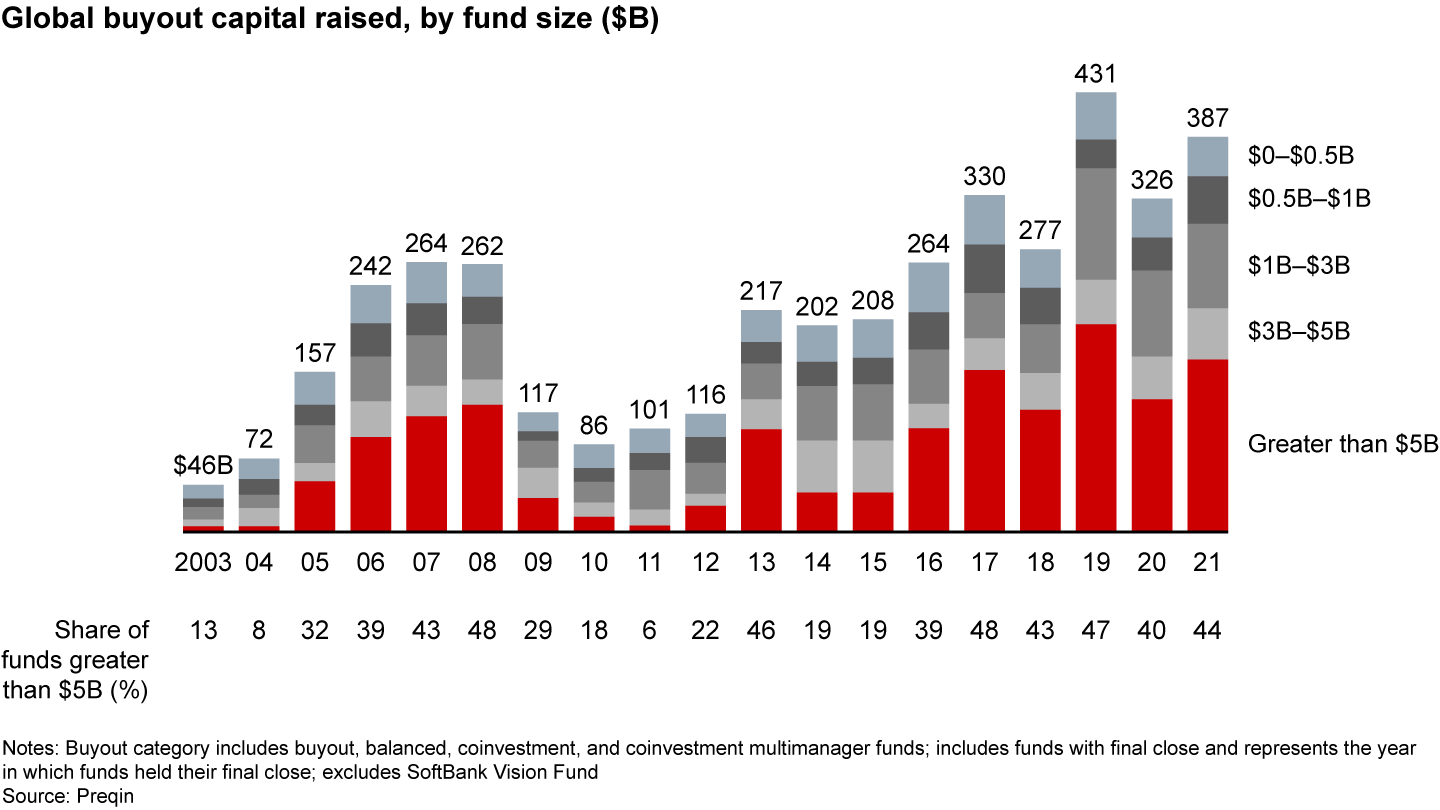
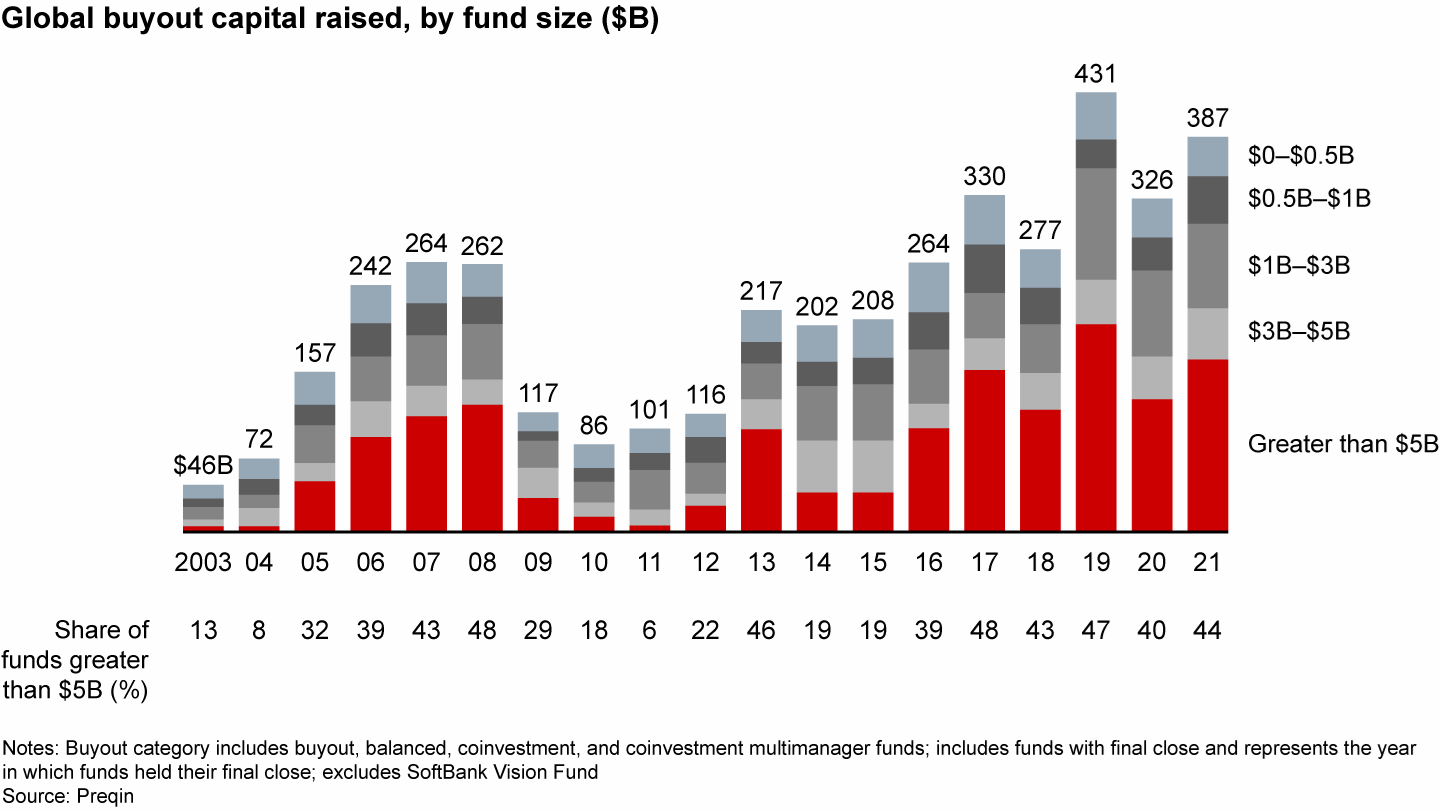
The industry’s marquee buyout funds, in fact, have developed a comfortable routine with their LPs. While historically they might have raised a large flagship fund every three to five years, they’re pulling that schedule forward, coming back to investors every one or two years and raising an even larger fund. Hellman & Friedman, for example, raised $24 billion (vs. $20 billion targeted) for its X fund in 2021, less than three years after raising $17 billion for fund IX. Stepping up in this way has accelerated the supersizing trend. Among the top 20 managers, the average flagship fund size jumped from $12 billion to $17 billion between the last two fund-raising cycles.
For most funds, however, closing took longer in 2021 than it had in previous years. The percentage of funds that hit their target in less than a year dropped from 44% to 33%, and if you were in the market’s middle or below, it was especially challenging (see Figure 25).
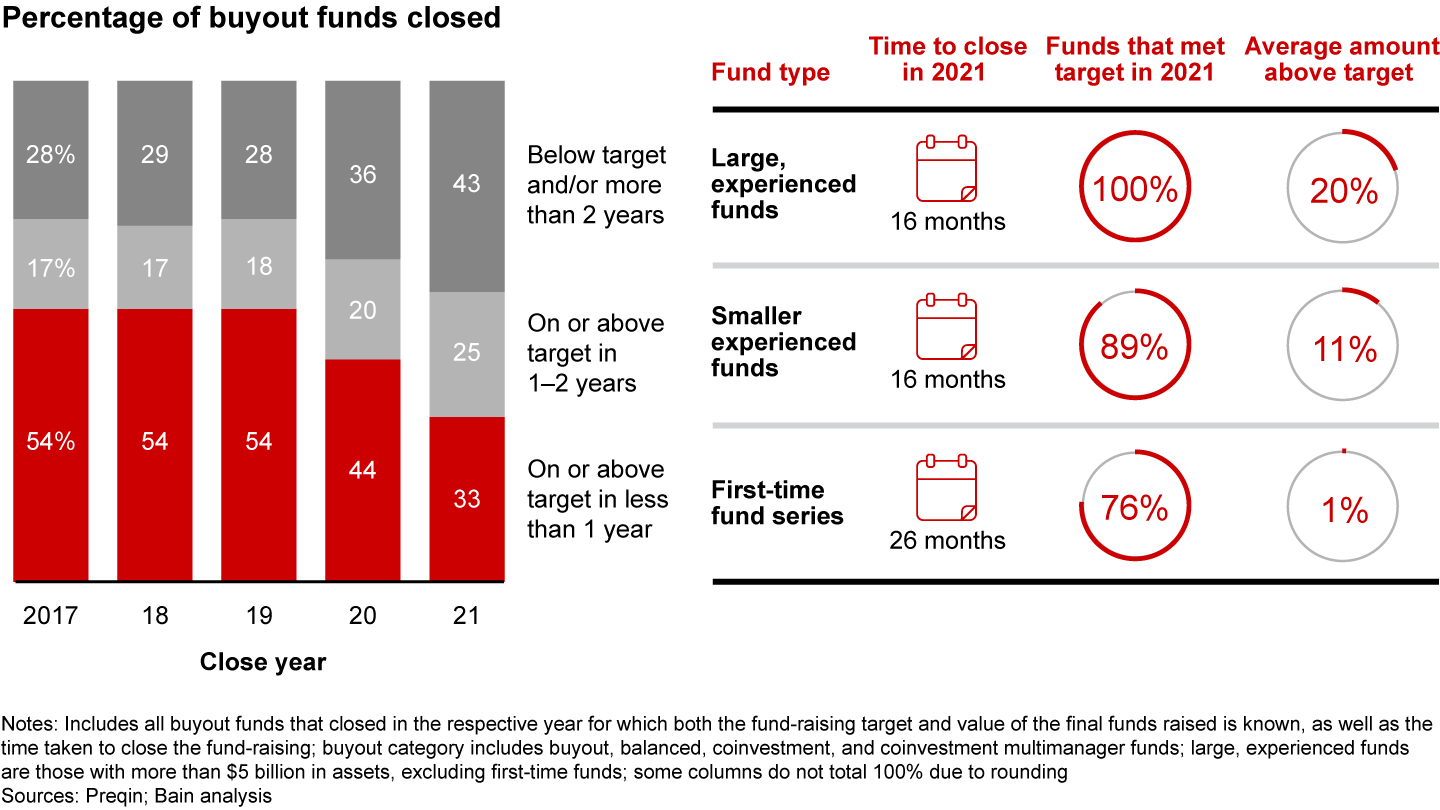
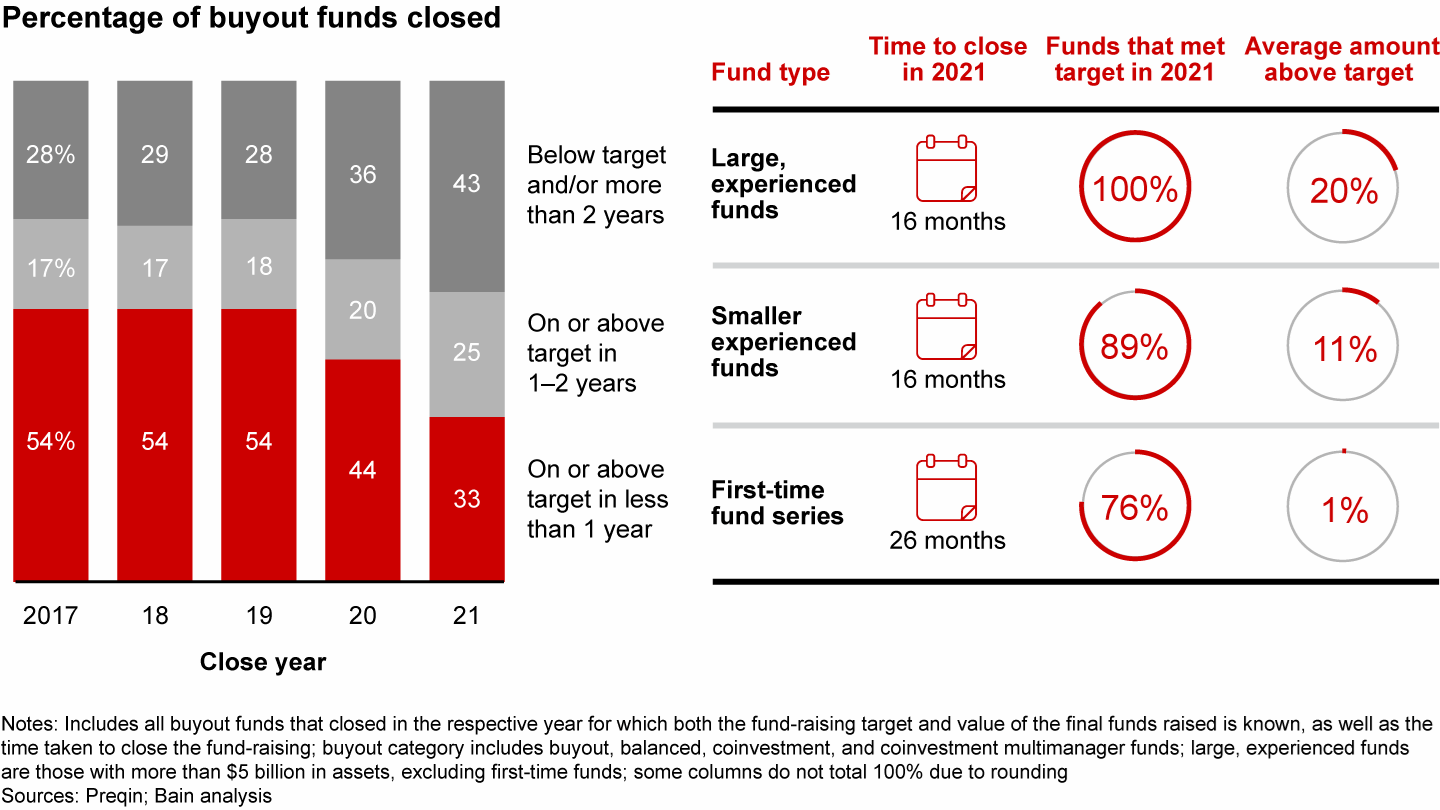
As we discussed in last year’s report, fund-raising within the buyout category has shifted significantly. LPs clearly have a bias toward size and experience in the funds they choose. But they are also rewarding funds that have specialized expertise or a unique angle on creating value.
For the first two-thirds of private equity’s relatively brief history, the industry was shaped by the classic buyout fund, one geared to hunt for value in a number of industries and sectors with a diversified portfolio. Since 2010, however, these classic funds have been losing share to specialists—firms that have carved out clear areas of expertise and exploited them aggressively, including hyperfocused subsector funds, growth funds, ESG specialists, long-hold funds, etc. The share of capital raised for classic funds has slipped from a recent peak of 80% in 2013 to 69% at the end of 2021. That was a slight improvement from 2020, but the trend is still evident.
This is rewarding diversified giants like KKR or Carlyle that can quickly stand up funds to take advantage of investor trends. It is also benefiting funds that are right in the middle of hot sectors like software, healthcare, or fintech, along with new funds that offer an innovative way to tap a certain market. Consider Arctos, a fund that buys and sells minority stakes in sports teams. It was on the road for 18 months in 2020 and 2021 and raised its first $3 billion in capital.
Investors certainly aren’t all looking for such exotica, but the message in fund-raising patterns is unambiguous: Funds that have an angle, especially a tech-related angle, are the ones raising money the fastest. As LPs become more and more sophisticated in how they split up their private equity allocation, they are looking for targeted solutions that stand out from the crowd in terms of experience, focus, and performance.
The message in fund-raising patterns is unambiguous: Funds that have an angle, especially a tech-related angle, are the ones raising money the fastest.
Returns
As far as returns go, private equity continued to deliver for investors in 2021. Buyout funds on average have generated stronger pooled net IRR than public markets across multiple time periods and geographies (see Figure 26). As has been the case over the past several years, the outperformance has been narrowest in the US, where the long technology-driven rally in the public averages has closed the historical gap with private equity.
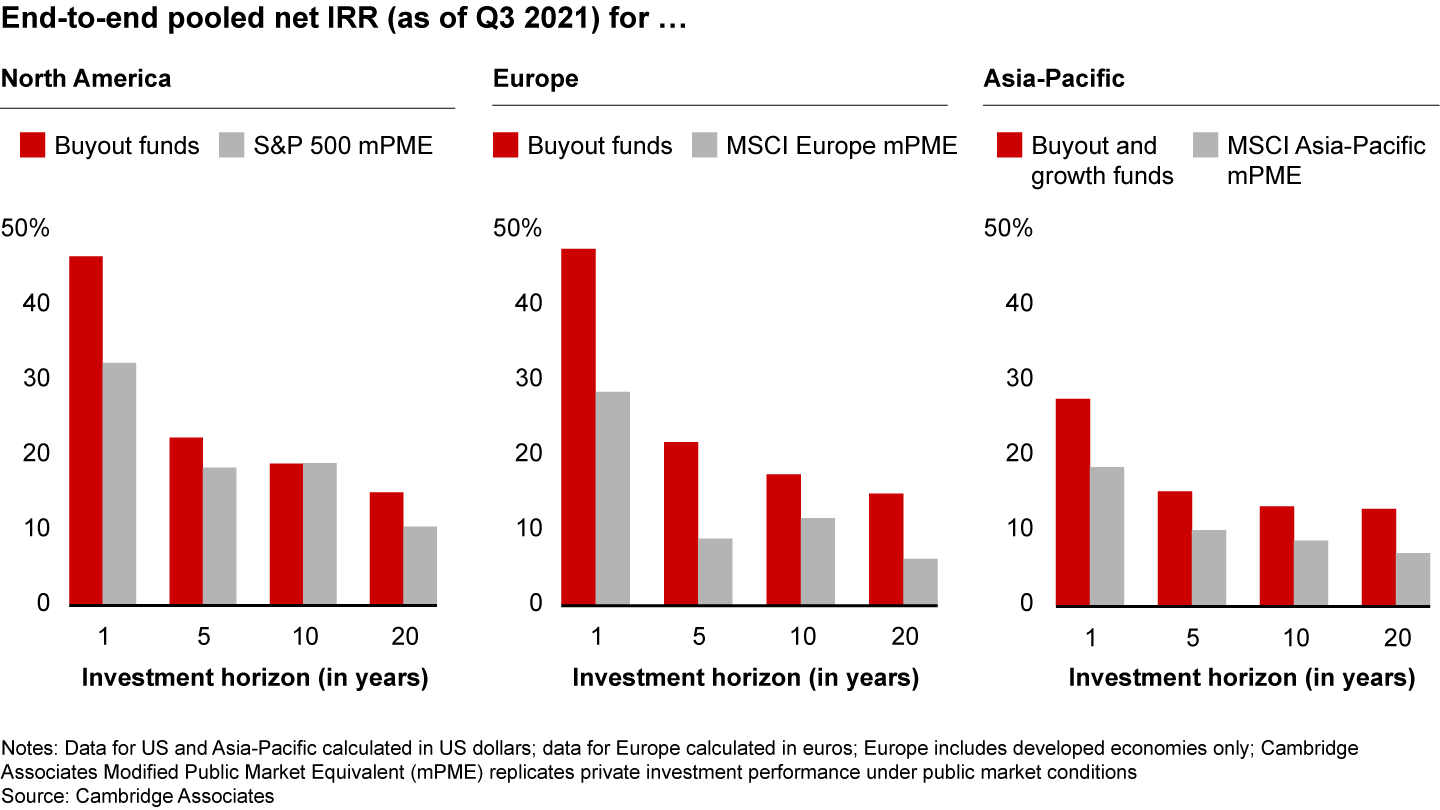
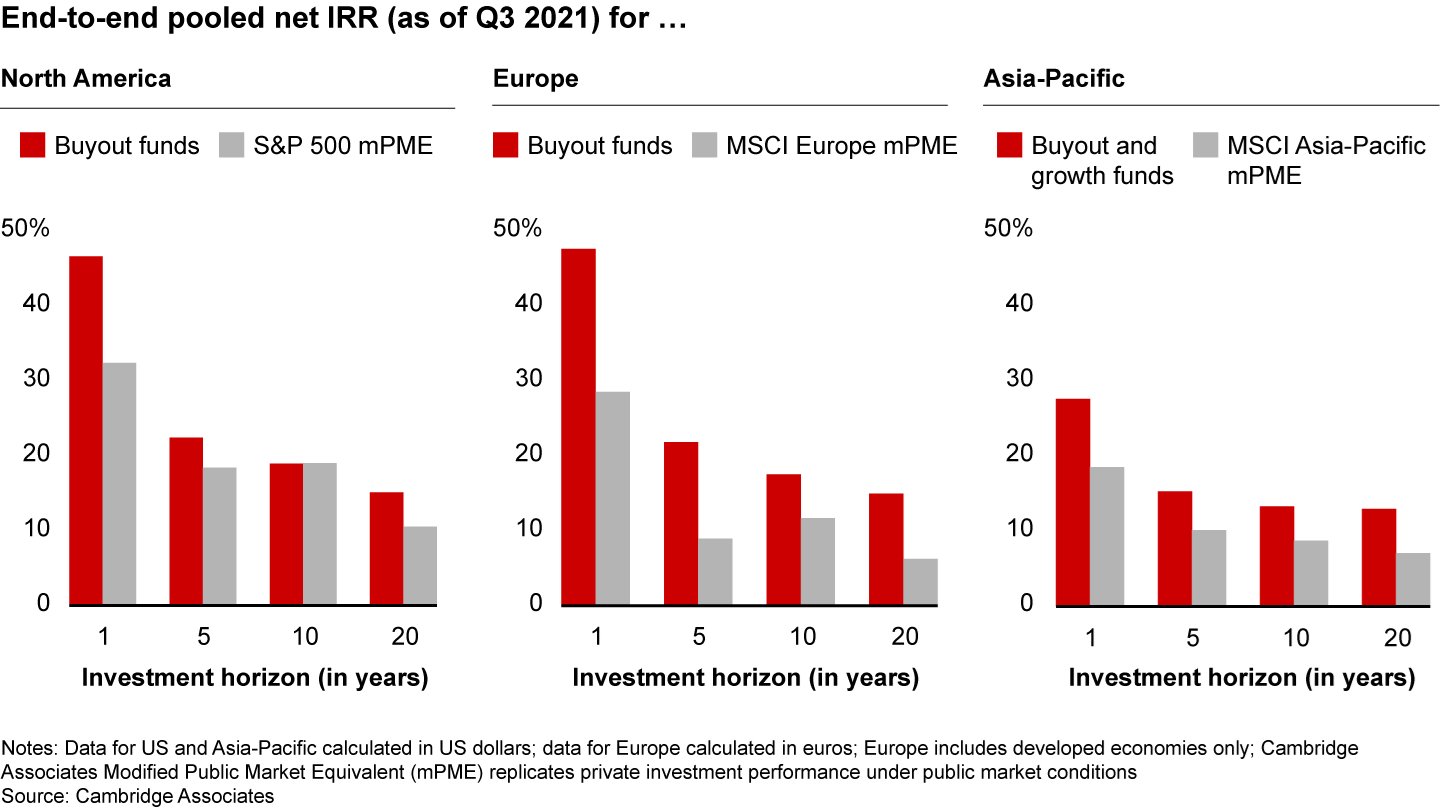
The argument could be made that a narrow gap plays to the public markets’ favor, since private equity offers less liquidity. But as we’ve seen, limited partners seem more enthusiastic about private equity in recent years, not less. There are a couple of reasons to expect this isn’t likely to change unless the private markets begin to disappoint. First, the surge in US equities since the global financial crisis has been a historical anomaly, which sophisticated investors know is likely to revert to the mean eventually. Second, the public rally is less monolithic than it seems. The strong appreciation has been driven disproportionately by a handful of very large tech companies like Apple, Amazon, and Microsoft, meaning public investors are disproportionately increasing exposure to these companies as well.
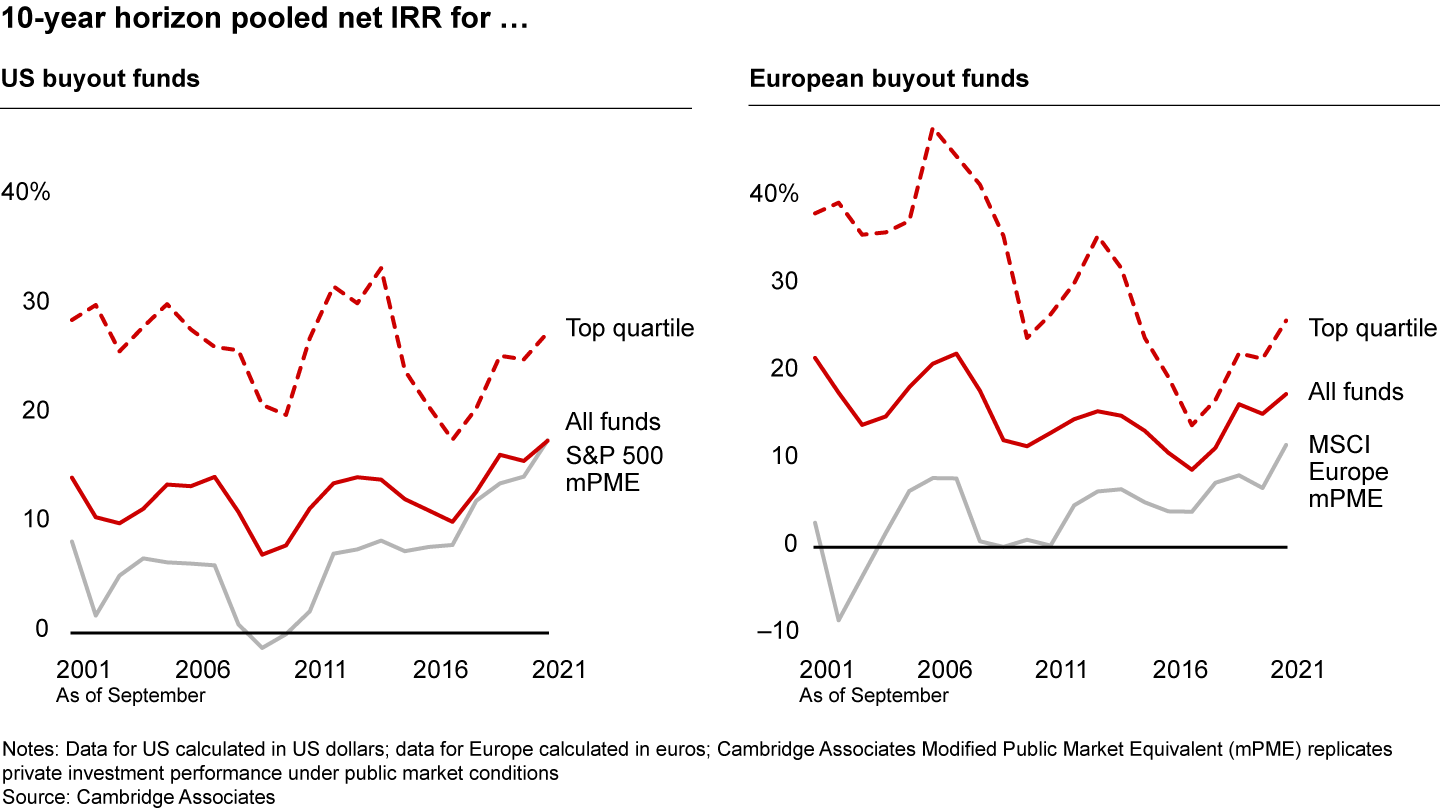
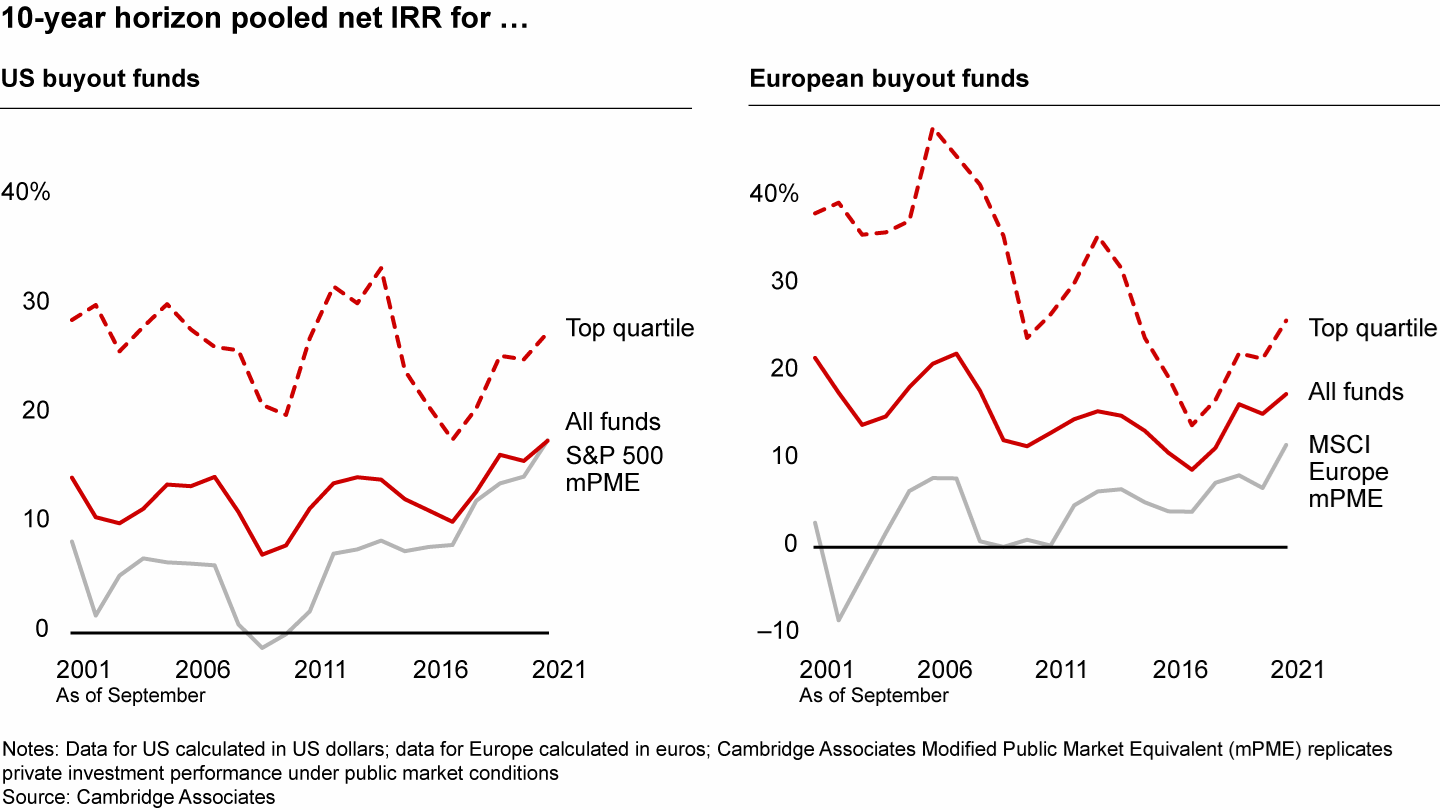
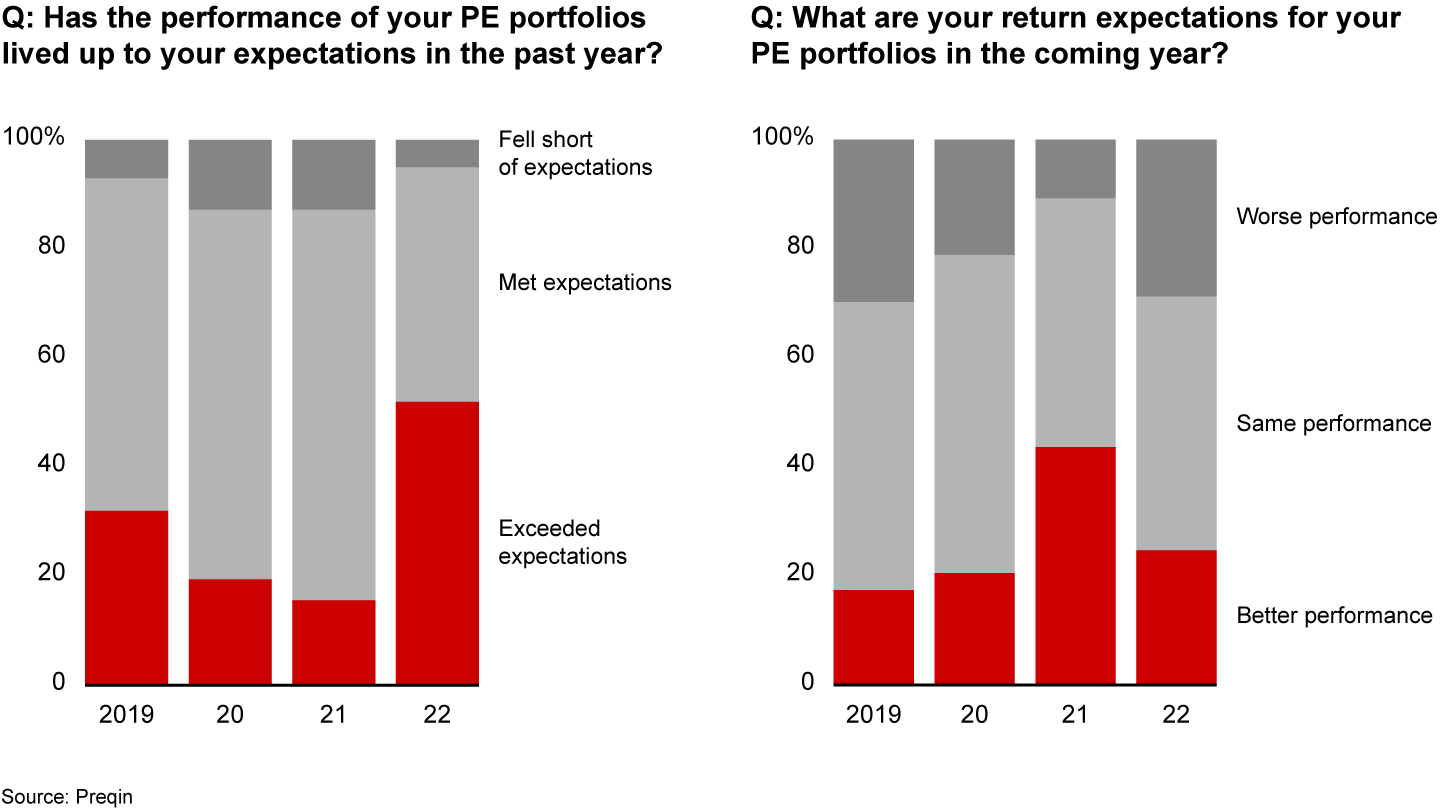
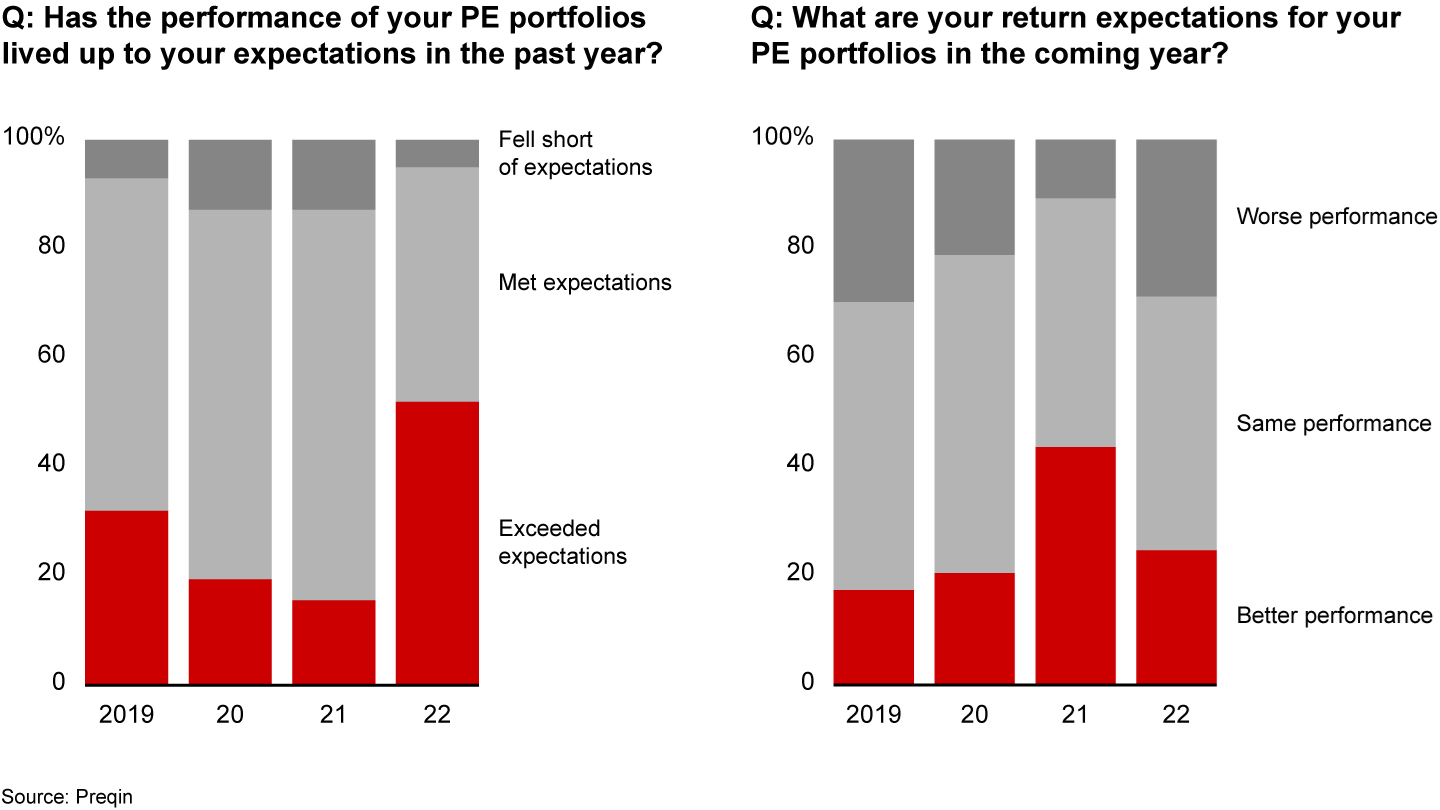
Private equity continues to offer broader exposure, less volatility, and returns that are better over time, especially at the top tier (see Figure 27). That helps explain why respondents to Preqin’s 2021 survey of LPs remain highly satisfied with their private equity allocations. A full 95% said that the performance of their PE portfolio met or exceeded their expectations in the past year, although some predict a bit of cooling in the coming year (see Figure 28).
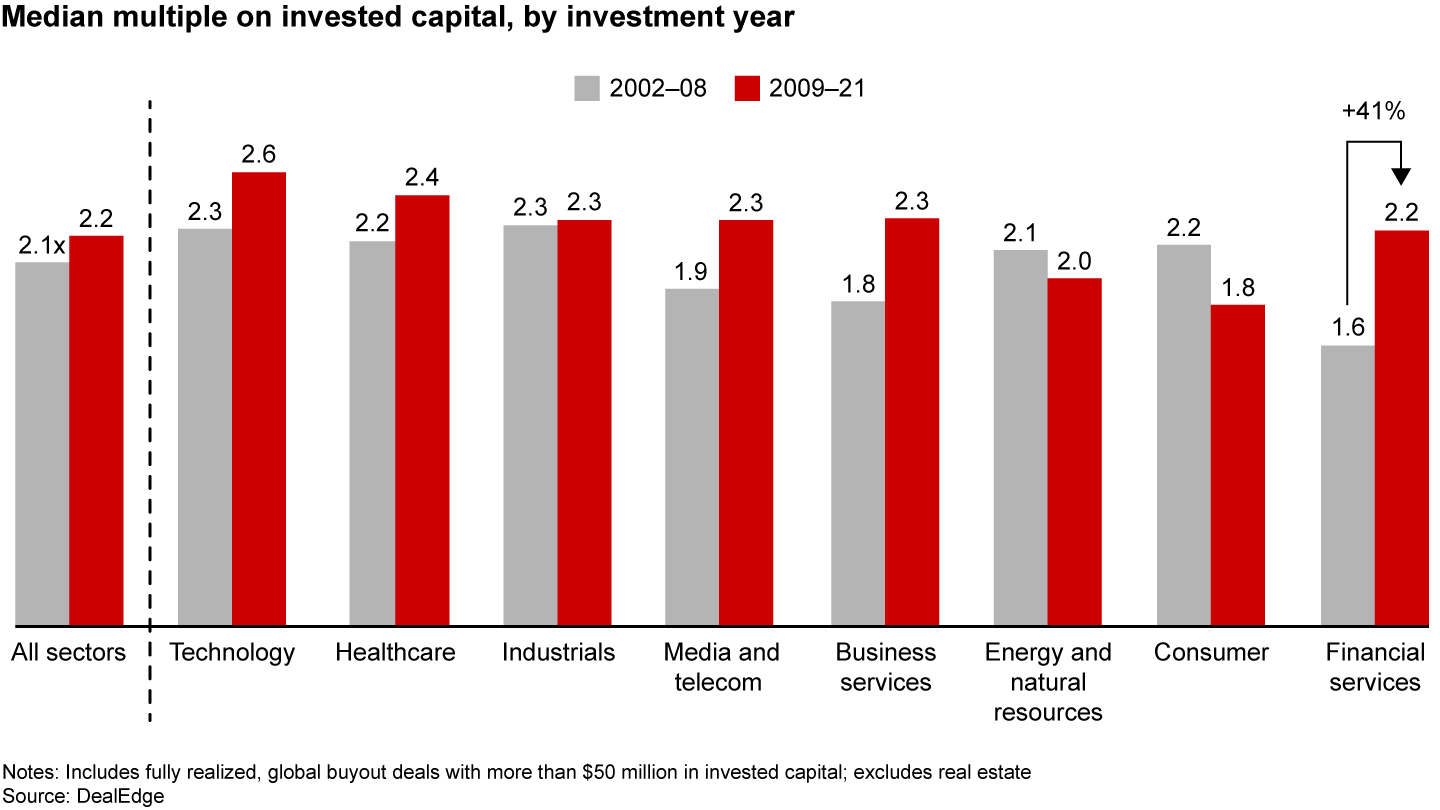
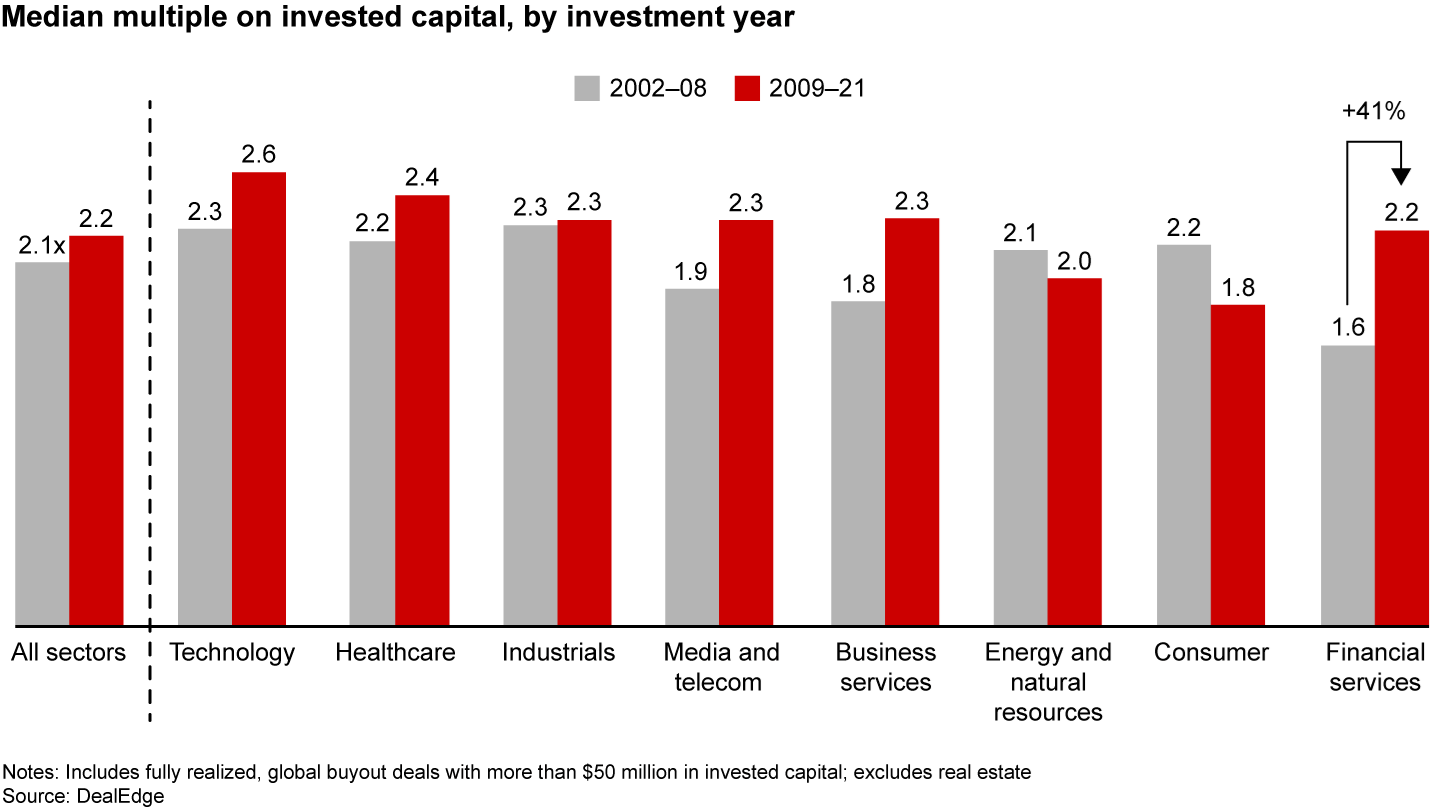
Returns in private equity, of course, aren’t monolithic either, which is why LPs have tended to reward certain funds over others. In the years since the global financial crisis, for instance, returns from technology, business services, and financial services have increased relative to performance before the crisis, and capital flows to these tech and tech-enabled sectors have risen. The broad consumer sector, on the other hand, has declined in performance (see Figure 29).
As we discuss elsewhere in this report, strong sector investing is all about expertise; picking the right companies in any sector can produce top-tier returns. What investors are looking for is differentiated performance, and they are clearly rewarding the funds that can deliver.
Asia on the rise
Over the past decade, the share of assets under management focused on the Asia-Pacific region has grown significantly faster than AUM focused on the rest of the world. The region has grown 2.4 times faster than North America and 3.0 times faster than Europe (which it passed for second place in 2018). It finished 2021 with a 30% share of total AUM (see Figure 30).
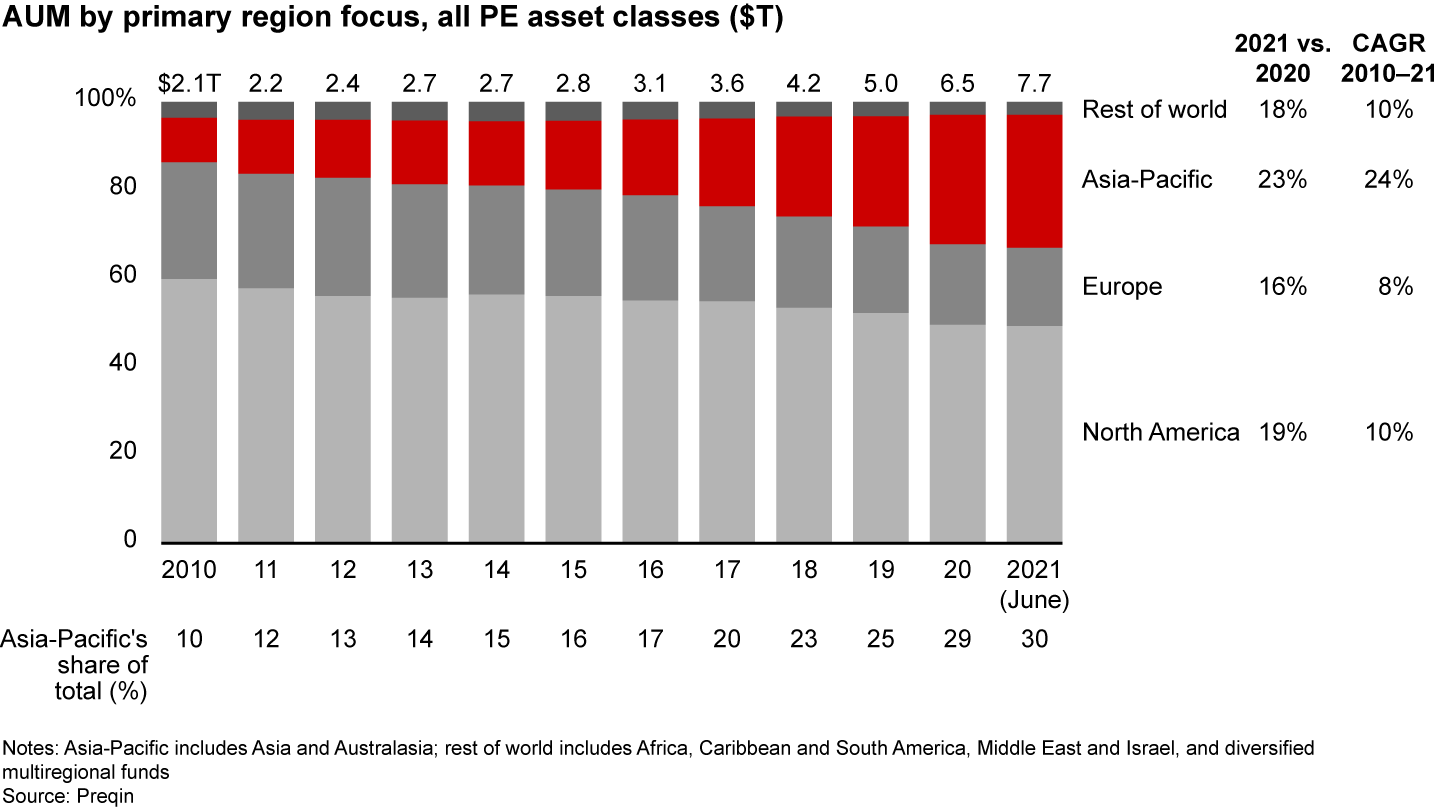
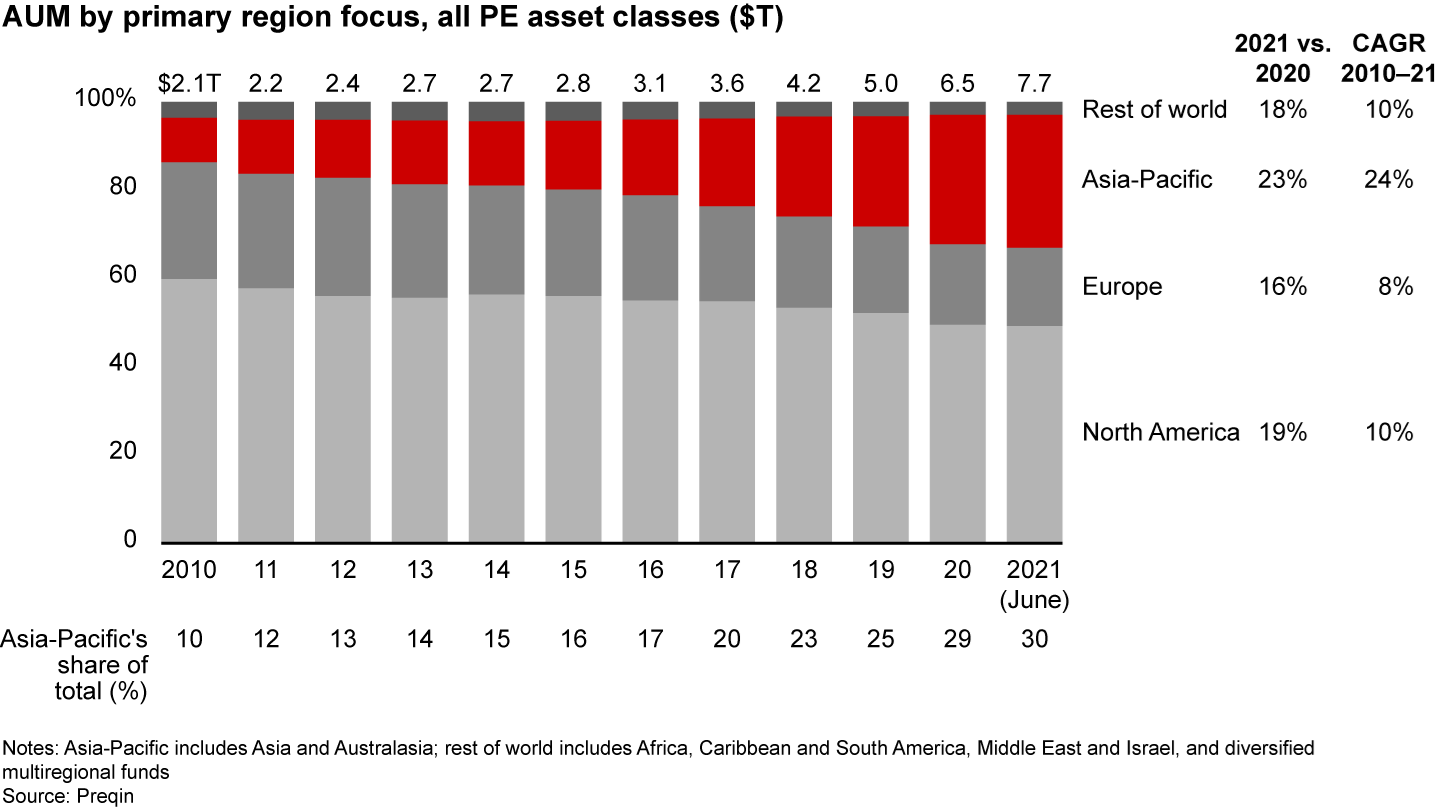
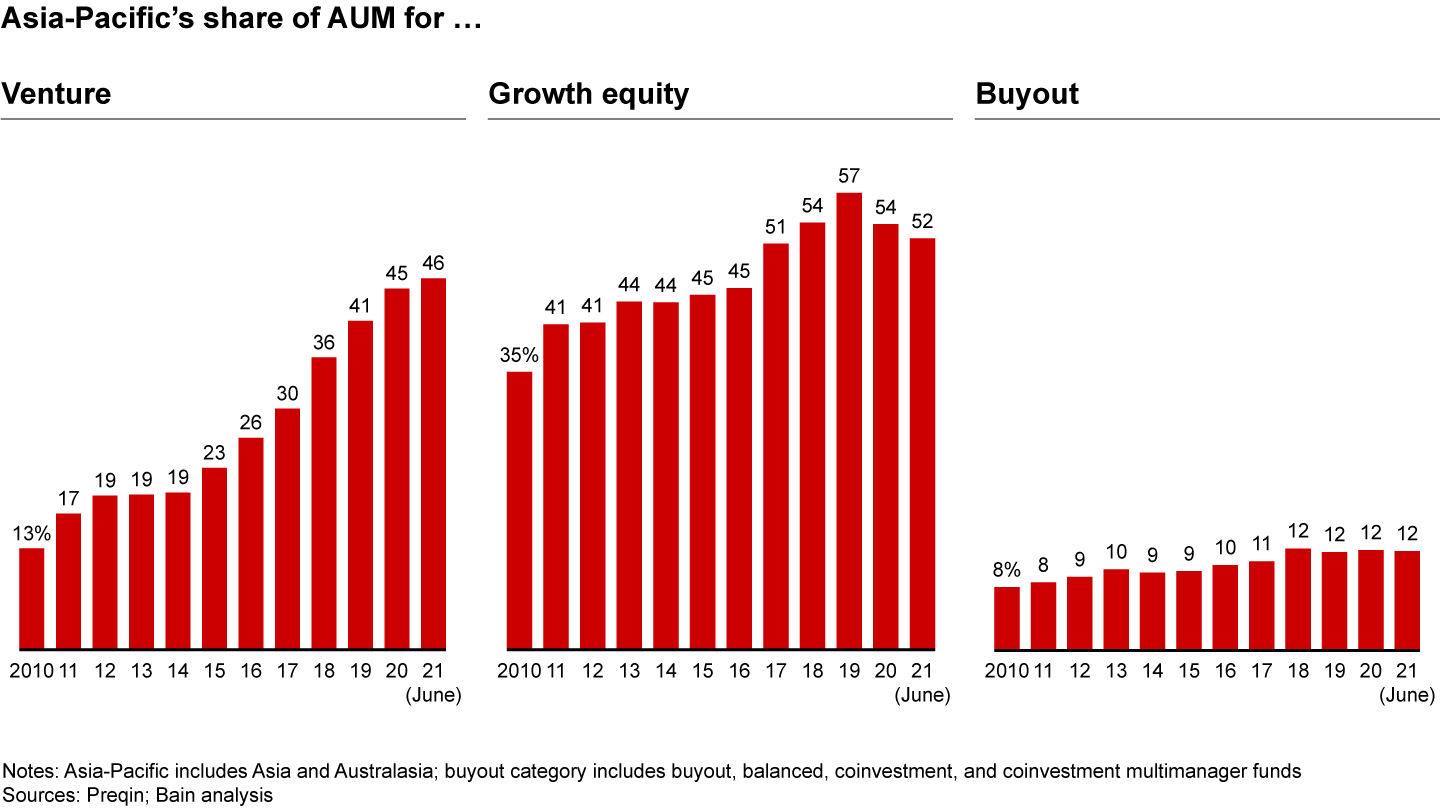
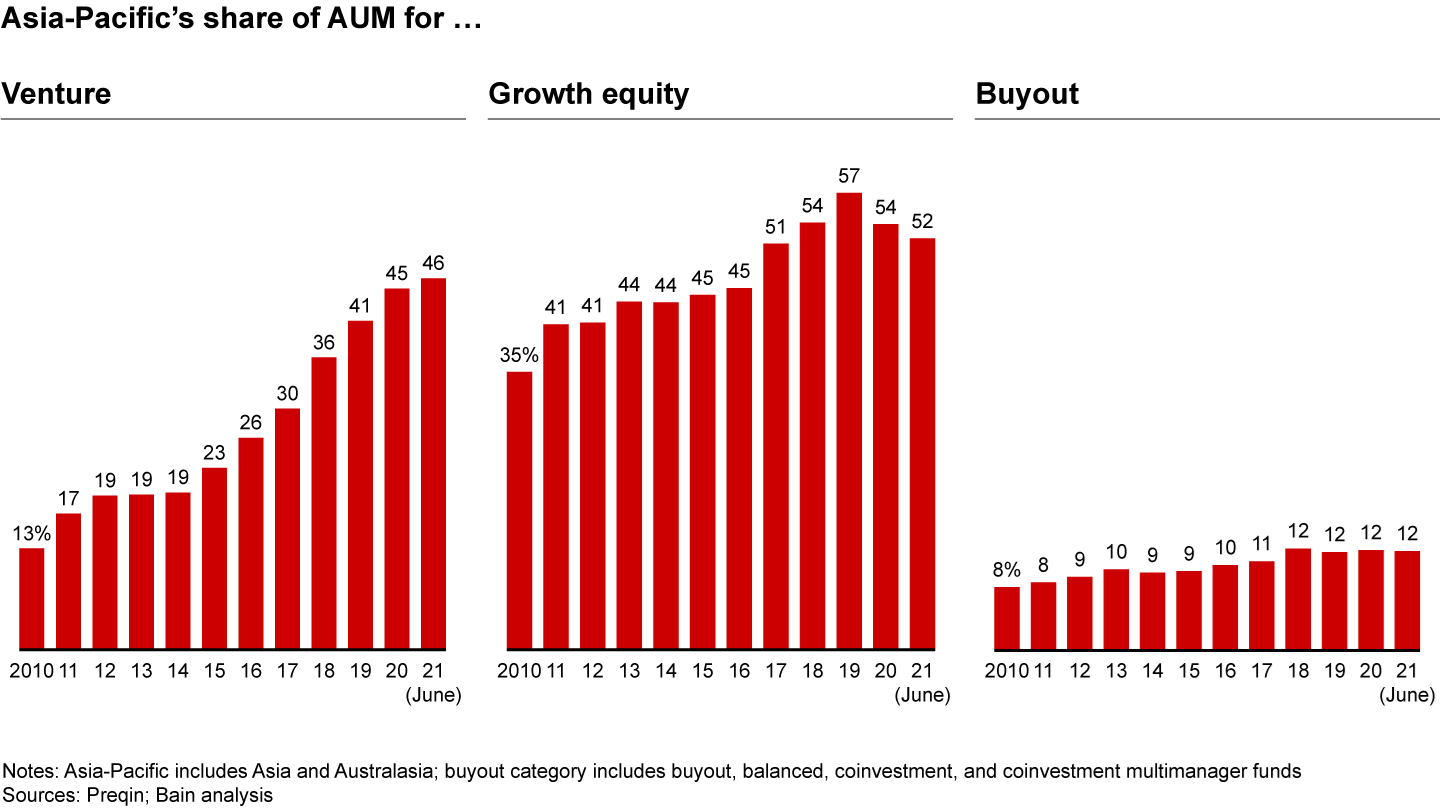
The shift toward Asia and away from Europe, in particular, reflects the dominant trends in private equity today: the rapid rise of technology and venture investing. Asia-Pacific investors have long been focused on growth more than buyout, but that trend has been even more pronounced over the past several years. Venture AUM focused on Asia-Pacific hit 46% of the total in 2021, up from 13% in 2010. Asia has lost a little ground to other regions in growth equity AUM over the past two years but still commands a share of 52%. While the region’s share of buyout AUM remains relatively low at just 12%, that too has grown rapidly (by 50%) since 2010 (see Figure 31).
Unsurprisingly, the bulk of this growth capital is focused on technology. Tech deals made up just over half of all deals done in the region in 2021, vs. 31% globally (see Figure 32).
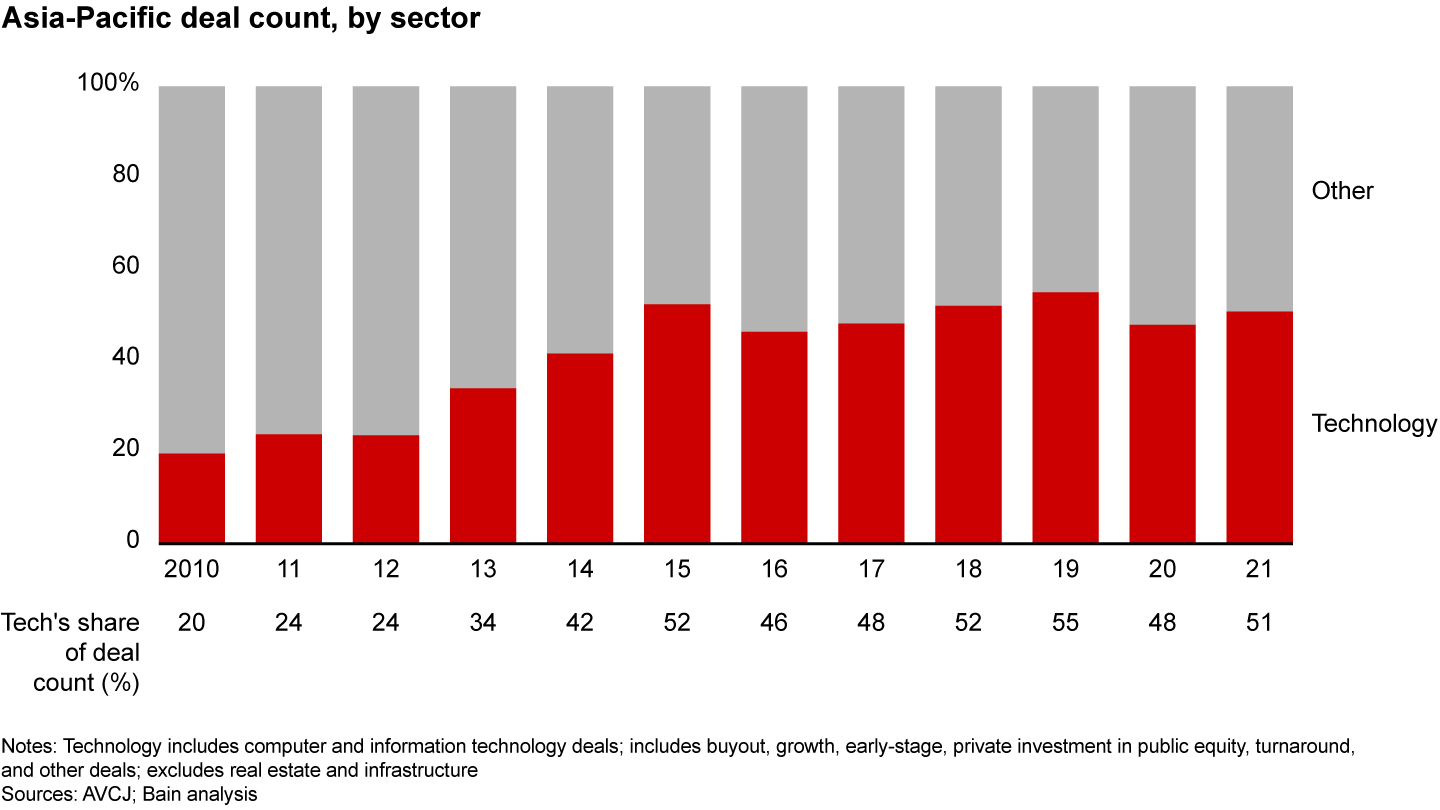
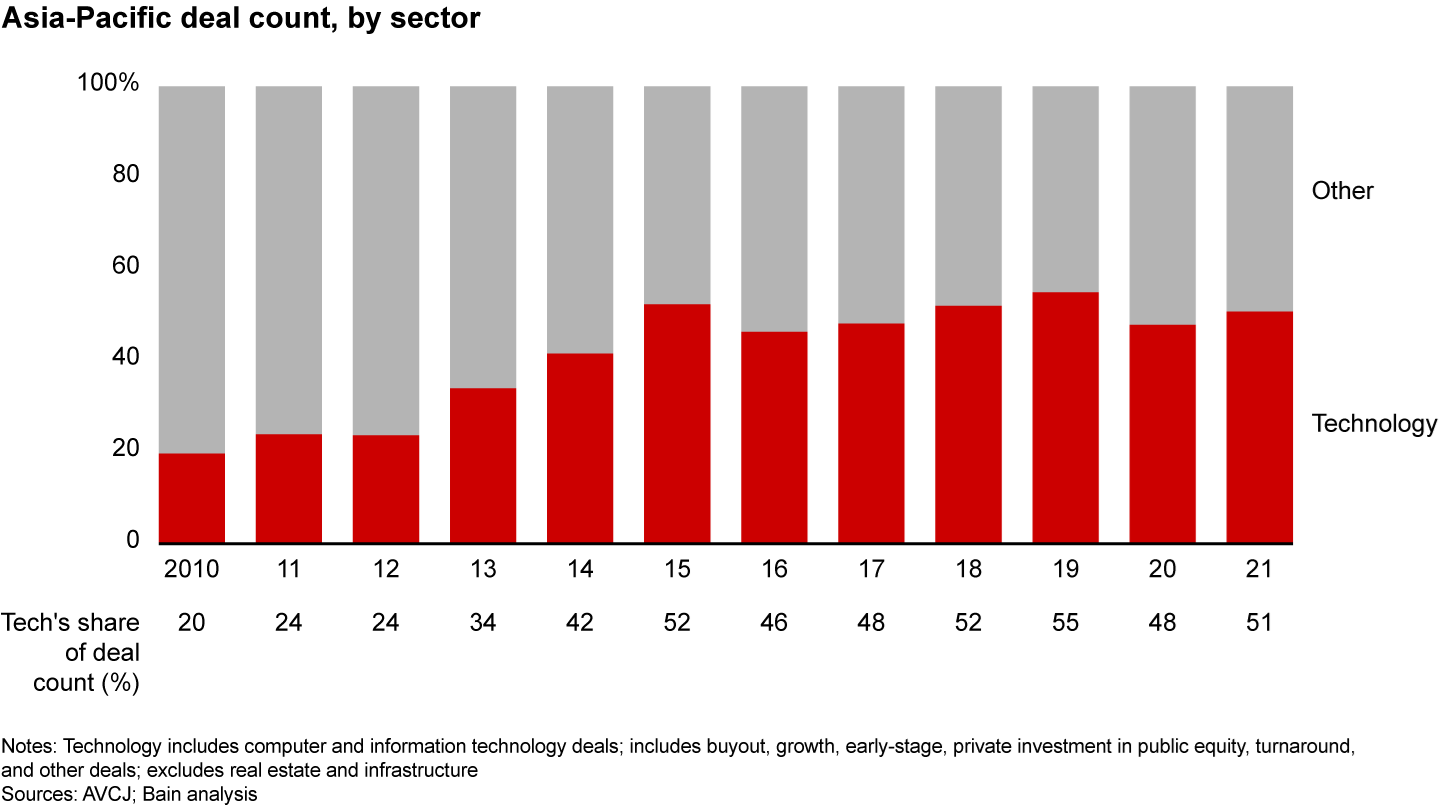
Within the tech sector, activity was highly concentrated (about half) on e-commerce, software, and online services. Greater China and India, which accounted for $128 billion and $61 billion in deal value in 2021, respectively, were the most vibrant markets, with some of the biggest deals. When India’s online retailer Flipkart sought an injection of $3.6 billion, a diverse collection of investors showed up, including the Canada Pension Plan Investment Board and hedge fund Tiger Global.
Other recent big deals in the region have included Carlyle’s $3 billion investment in Indian IT services company Hexaware, SoftBank’s $1.7 billion investment in South Korean travel platform Yanolja, and a $1.5 billion funding round raised by Lalamove, an on-demand logistics company based in Hong Kong.
Closing the ESG measurement gap
Since we wrote about creating value through ESG in this report a year ago, environmental, social, and corporate governance issues have only gained currency among consumers, employees, and investors. Yet as more and more LPs and GPs seek ways to implement meaningful ESG strategies, they inevitably encounter a measurement gap that makes it difficult to gauge success.
A lack of specific data standards and best practices related to ESG is hampering investors’ ability to consistently evaluate ESG performance across their PE portfolios. Even where high-quality data exists, firms and institutions may lack the capacity to collect, analyze, and report on it.
These challenges come through clearly in a survey of LPs conducted jointly by Bain and the Institutional Limited Partners Association (ILPA). When asked about the role ESG plays in their current and future private equity strategies, these organizations were unambiguous: ESG is becoming an increasingly important factor in making investment decisions.
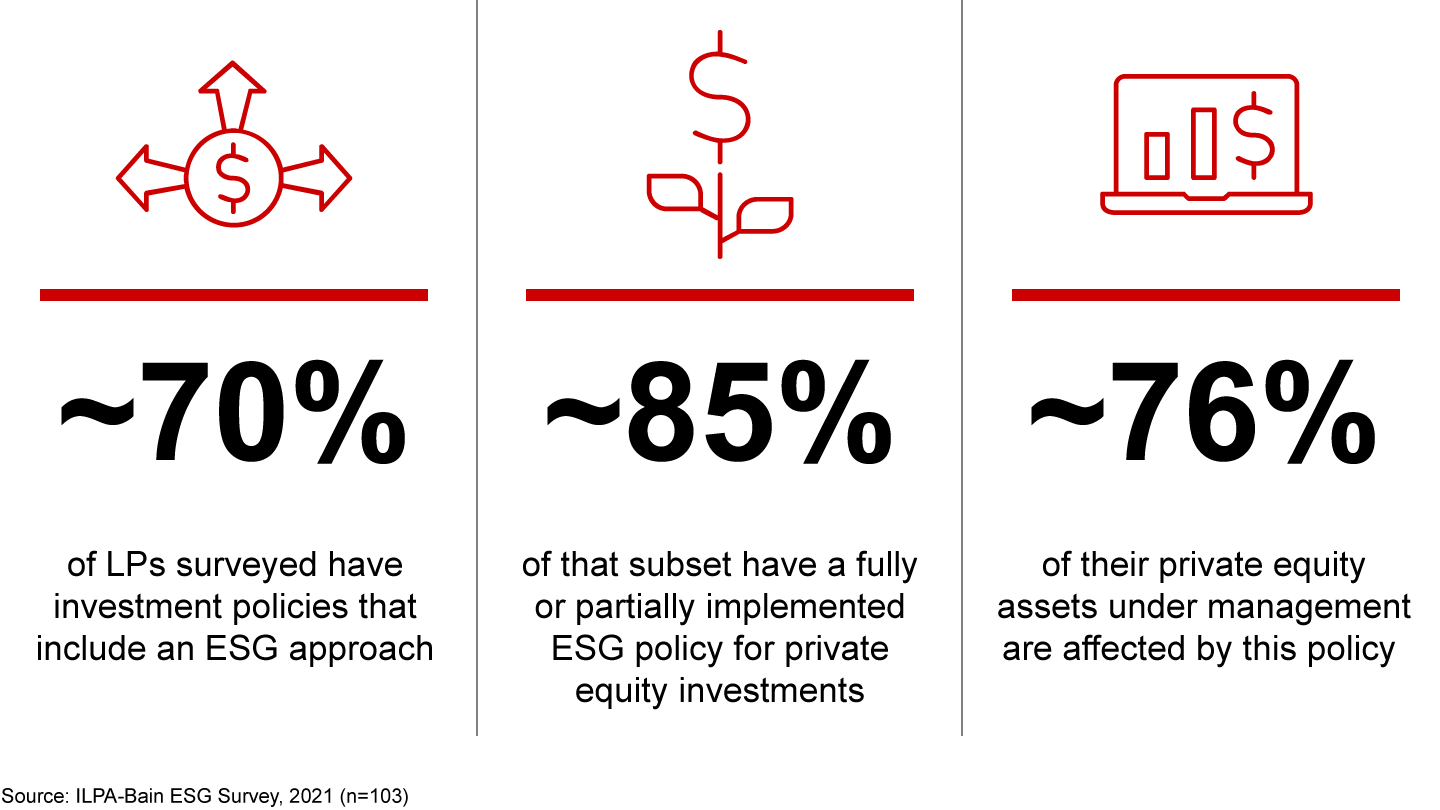
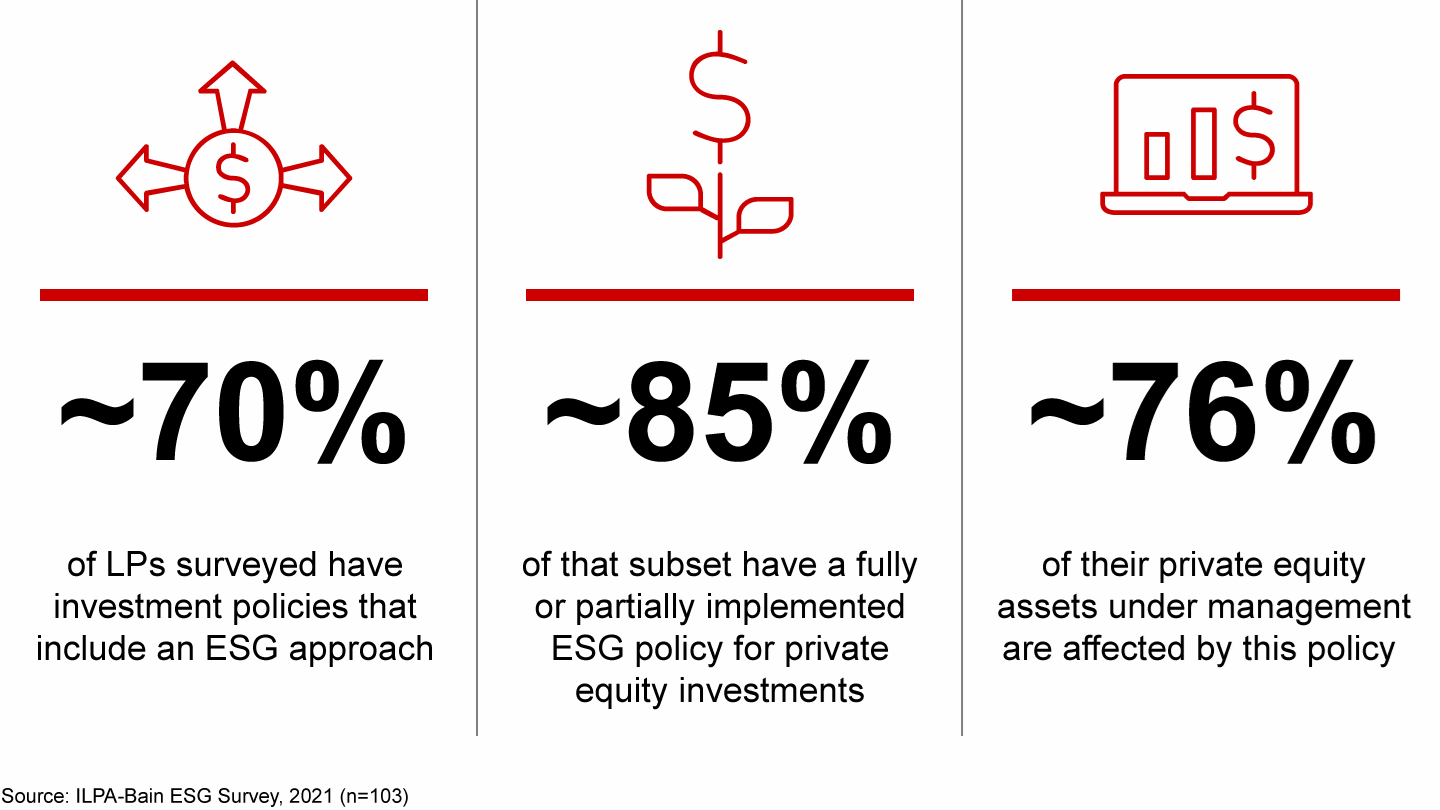
Approximately 70% of respondents have made ESG a part of their investment policies. Of those, around 85% have a specific ESG policy related to private equity allocations, and those policies affect about 76% of their private equity assets under management (see Figure 33). Half of all respondents said ESG is additive to investment performance, although regional differences remain. In Europe, 70% agree that strong performance on these issues increases valuation premiums, while in North America, that percentage drops to 38%.
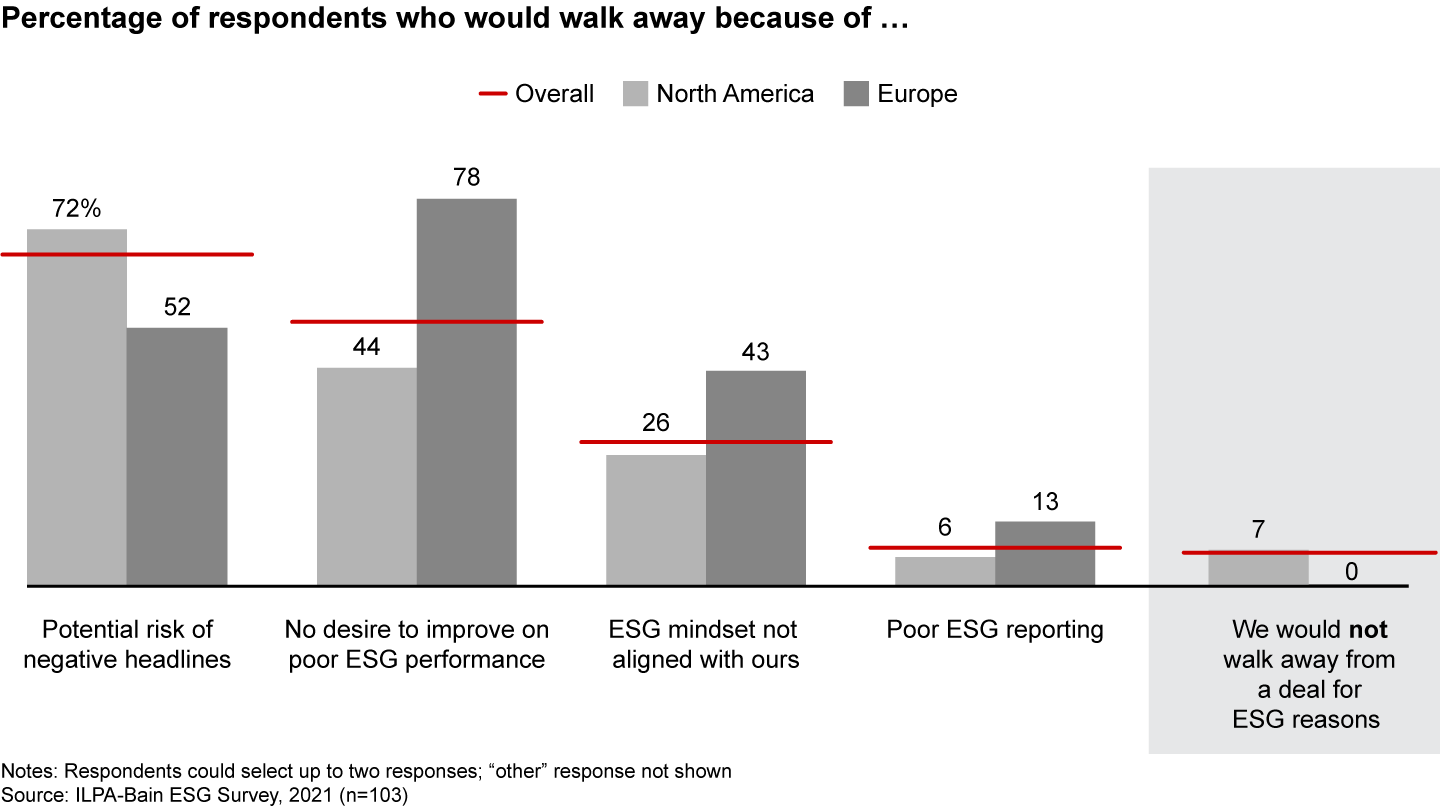
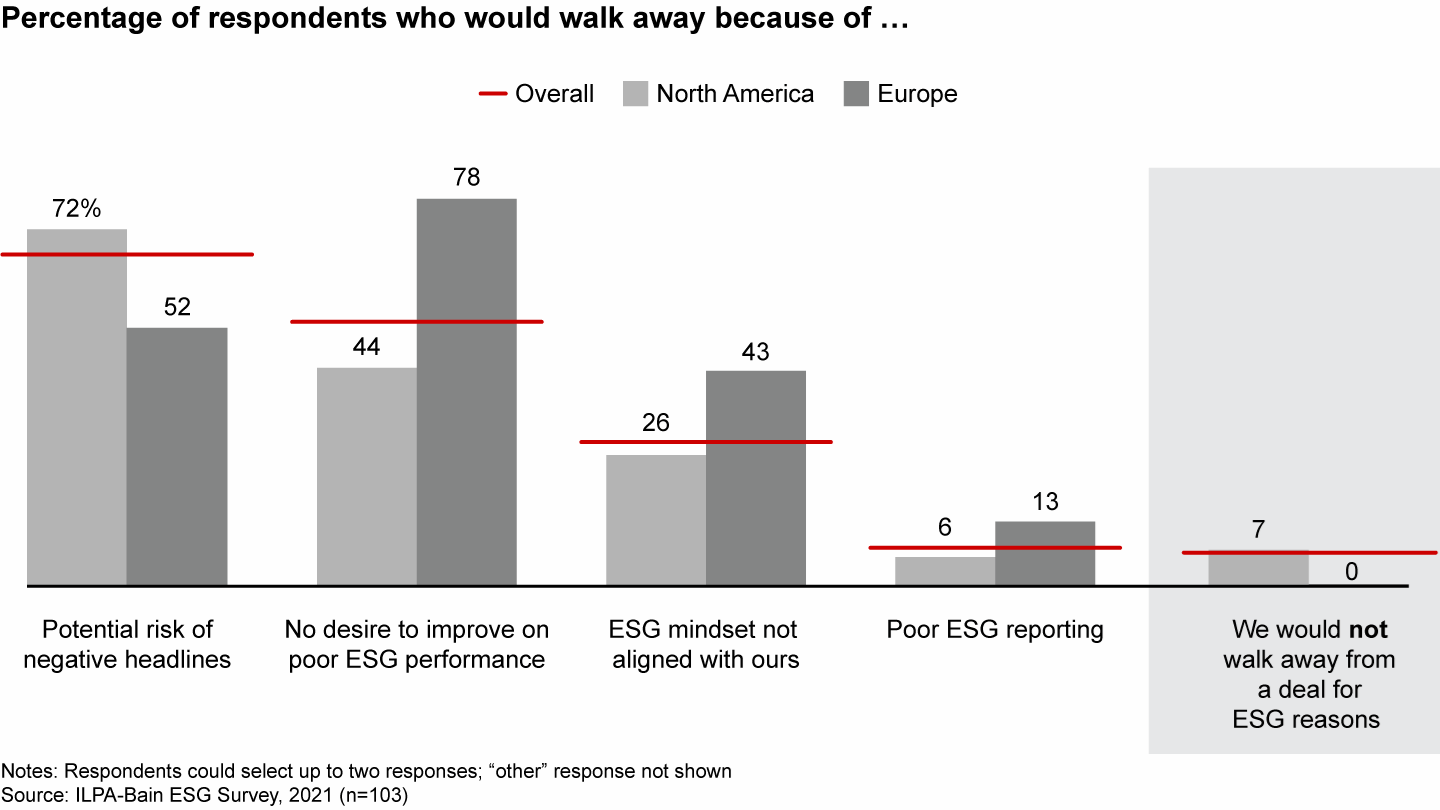
The overwhelming majority of LPs (93%) said they would walk away from an investment if it posed an ESG concern. But, again, there were regional differences. The biggest concern in North America would be the potential for negative headlines; in Europe, LPs would be more likely to walk away if a company showed no desire to improve performance on these issues (see Figure 34).
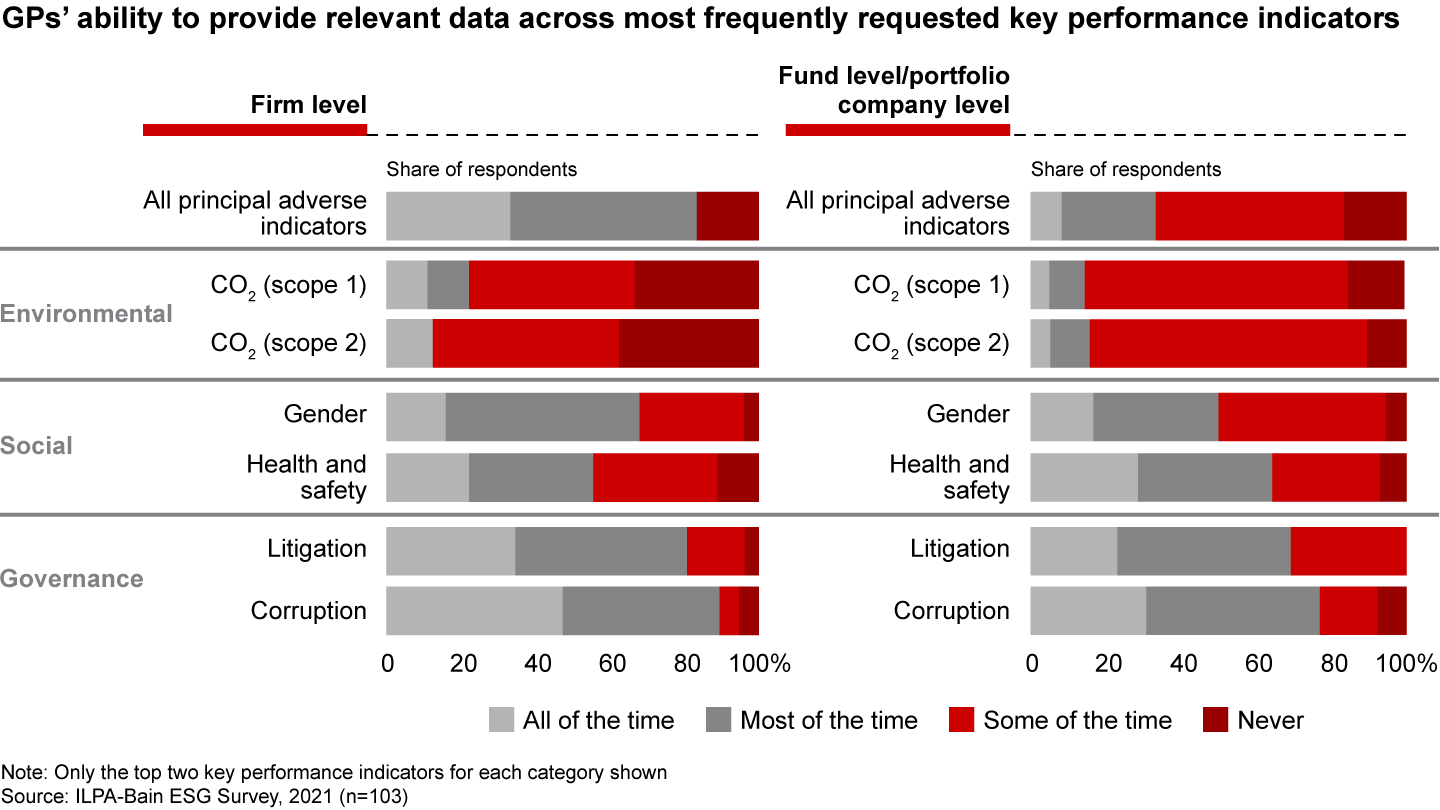
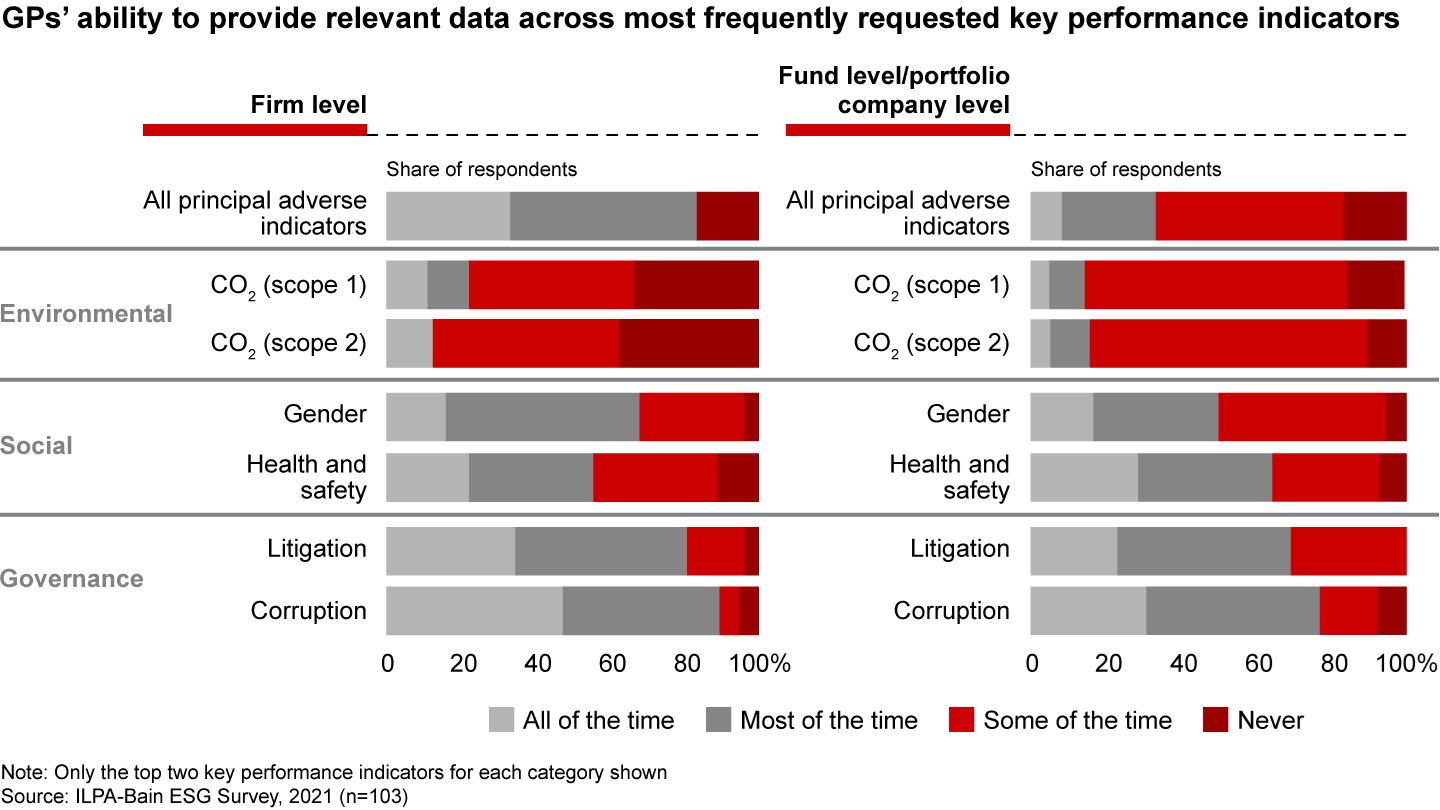
Regional differences aside, enthusiasm for ESG among LPs is evident. Yet fewer than 20% of respondents said they ask their GPs for ESG reporting based on key performance indicators. This may be a matter of not asking for what you can’t have, since the preponderance of GPs aren’t able to provide those reports anyway. Fewer than 25% of GPs, for instance, have the ability to report on scope 1 or 2 carbon emissions all or most of the time. And only around 35% can readily provide a full-scope report on all principal ESG indicators, ranging from carbon emissions to corporate corruption (see Figure 35).
When thinking about closing this persistent gap between intent and execution, it’s easy to play the skeptic. Action on ESG has always suffered from the fact that it is a broad, sometimes nebulous concept that encompasses a multitude of issues. It is highly unlikely the investing world will develop a universal theory for what good looks like in every industry sector across every aspect of ESG. Given the complexities involved, that has all the characteristics of a holy grail.
But those leading the charge on ESG are finding ways to quantify performance anyway. They are using traditional benchmarks, as well as newly developed ones, to provide transparency around how sustainable, equitable, and responsible they are across their firms and portfolios. And, importantly, they are finding innovative ways to use those insights to help drive better returns.
GPs and portfolio companies are learning to adapt metrics like Net Promoter ScoreSM to gauge how ESG performance is affecting the loyalty of customers and employees. Third-party services like Persefoni are emerging to help companies understand and measure impact around common issues like their carbon footprint. Others, like EcoVadis, have developed sustainability rankings for individual companies and their supply chains. Meanwhile, bespoke benchmarks are being created sector by sector as more work is done to figure out how to do good and produce outstanding returns at the same time.
The Bain/ILPA survey is hardly alone in signaling that companies and their owners will have to find ways to boost performance on these issues or risk losing faith among their most critical stakeholders. For private equity, it’s not just a matter of doing the right thing but of doing what’s required to thrive into the future. It’s also important to recognize that action is better than waiting for answers. The best approach to closing the measurement gap is to get moving and do something, then try to be transparent about what you have done and the impact it is having.
Net Promoter Score℠ is a service mark of Bain & Company, Inc., Satmetrix Systems, Inc., and Fred Reichheld.