
Report

|
|
Executive Summary
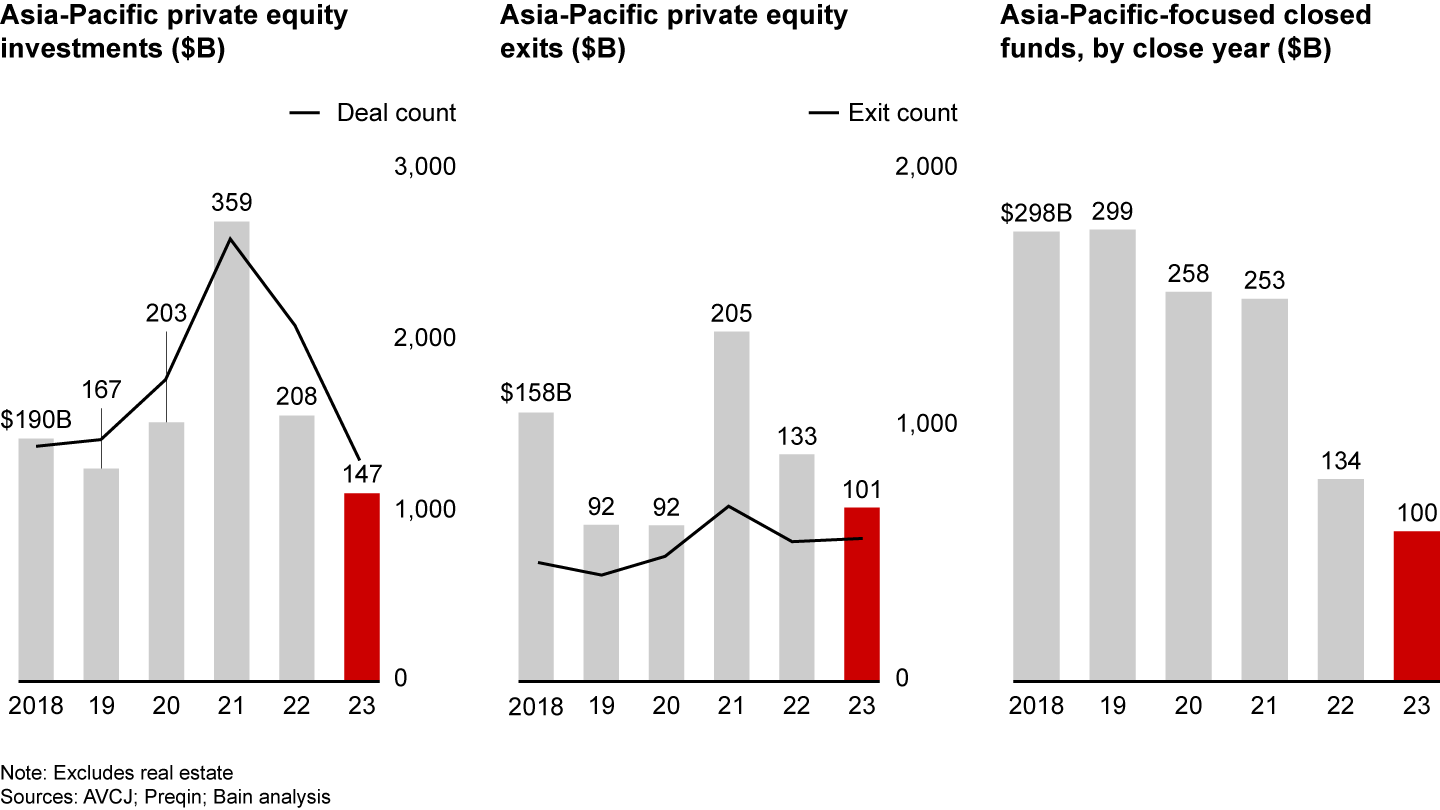
Asia-Pacific Private Equity: Investors pulled back, and deal activity plungedFor the second year in a row, uncertainty hovered over Asia-Pacific private equity (PE) markets. Many investors put dealmaking on hold in 2023, worried about slowing economic growth across much of the region, persistently high interest rates that raise the cost of PE debt, and volatile public stock markets. Ongoing geopolitical tensions and global conflicts reinforced investors’ concerns. Unable to fathom what was ahead, funds retrenched to wait out the storm. The unsettling mix of macroeconomic conditions was investors’ key concern, according to Bain’s 2024 Asia-Pacific Private Equity survey. Deal value fell to $147 billion, extending the dealmaking slump that began in 2022. Exits plunged, and fund-raising declined to its lowest level in 10 years (see Figure 1).
Figure 1

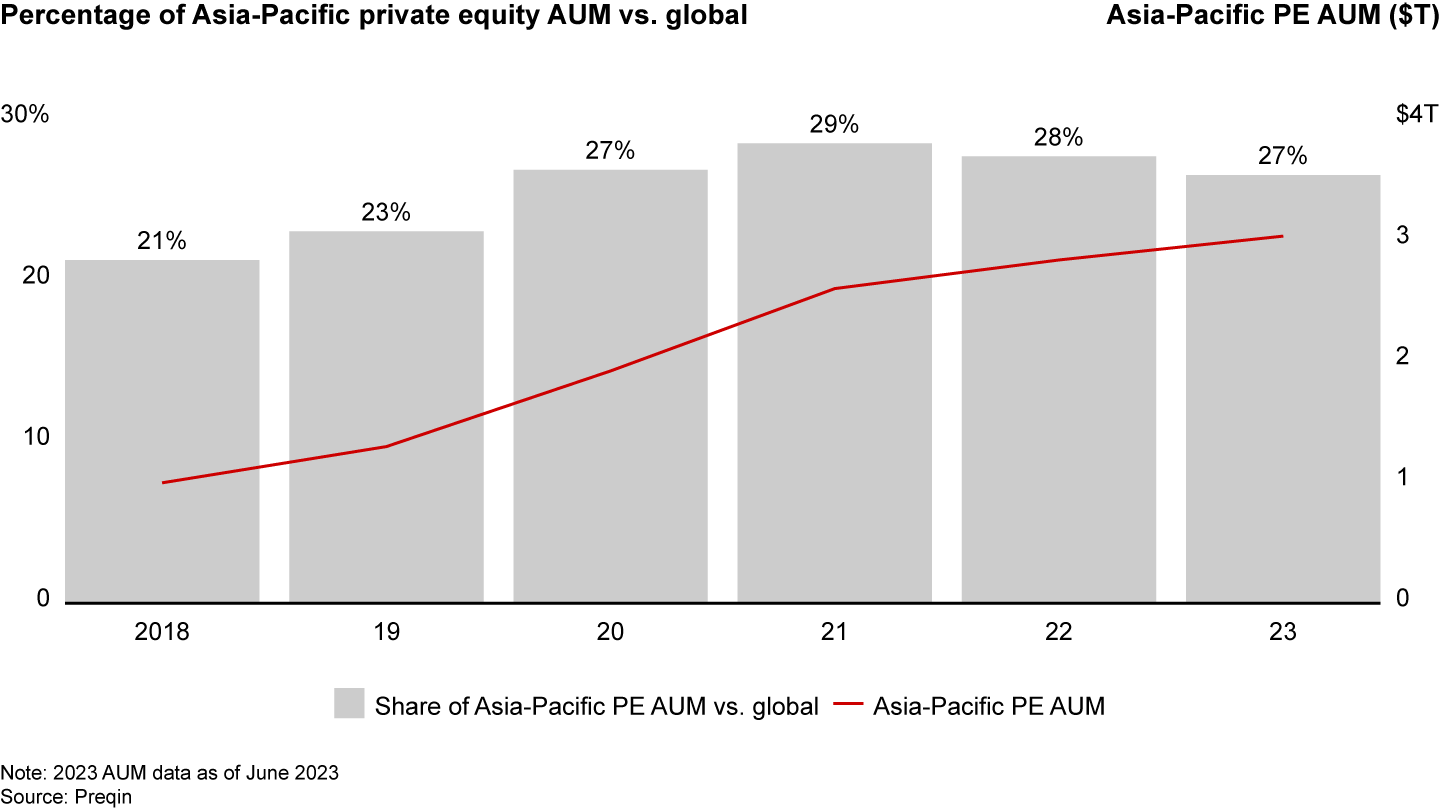
Investors remained especially cautious of buying companies in Greater China, and a murky economic outlook affected the entire region. Global general partners (GPs) reduced their investments in Asia-Pacific countries, and deals and exits declined. Japan was the only market to buck the trend, with a rise in deal activity. Investors found comfort in Japan’s deep pool of target companies with performance improvement potential, its stable regulatory environment, and persistently low interest rates. Technology was again the largest industry sector in terms of deals and exits. The energy and natural resources sector was the only investment area in which deal value and volume grew—a sign that investors are increasingly betting on assets related to the energy transition. Greater China’s exits via initial public offerings (IPOs) were by far the biggest source of exit activity, mostly in technology-related sectors (such as semiconductors) that are typically the domain of government-affiliated funds. Excluding IPOs in Greater China, exit value fell to $65 billion, down 30% from the previous five-year average. Grappling with the sixth year in a row of low or negative net cash flow, limited partners (LPs) put new allocations largely on hold. Many limited fund-raising to funds with demonstrated success, exposure to preferred markets, and differentiated strategies. Asia-Pacific PE assets under management (AUM) dropped to 27% of global AUM, a second year of decline following more than a decade of steady share growth (see Figure 2).
Figure 2

By year-end, several signs of market improvement began to appear, but the timing of a recovery remains unclear. Inflation rates began falling in most markets after spiking in 2022. Interest rates in most Asia-Pacific markets are forecast to decline in late 2024 or 2025. And some currencies that depreciated against the US dollar in 2022 and 2023 started to recover. Finally, stocks ended the year with strong performance in most markets, except China and Southeast Asia. PE returns were a bright spot in 2023, reconfirming that PE is still an attractive investment class, far outperforming public markets over 5-,10-, and 20-year horizons. And at year-end, industry data pointed to consistently high levels of dry powder in the region, ensuring funds have ample capital to do more deals. New sectors hold promise once a recovery takes off. Disruptive innovations like generative AI are creating fresh opportunities. Our research shows most GPs are using generative AI to mitigate risk, enhance operations, and improve the performance of portfolio companies. GPs already are scouting for generative AI assets coming to market and are assessing how generative AI can be useful during diligence on potential targets. LPs are still optimistic about some countries within the region. According to Preqin’s 2023 investor survey, those investing in private equity ranked Japan as one of the top three developed markets for PE investment opportunities over the next 12 months, and India and Southeast Asia as the two best emerging markets for investment opportunities. As GPs faced pressure to exit their investments, return cash to LPs, and raise additional funds, many shifted their focus to portfolio management and exit planning. With multiples declining, successful funds are betting on top-line growth and margin improvement to improve returns. Despite difficult exit conditions, PE funds that developed a pre-sales strategy and compelling equity story for their portfolio companies were able to attract buyers and exit successfully, according to our survey. In a turbulent year for private equity, many leading funds started to explore alternative asset classes, including infrastructure and private credit, as a key source of growth. Both of these asset classes have room to grow in the Asia-Pacific region. In our experience, diversification is challenging. Those who get it right build needed capabilities and invest close to their core business. 
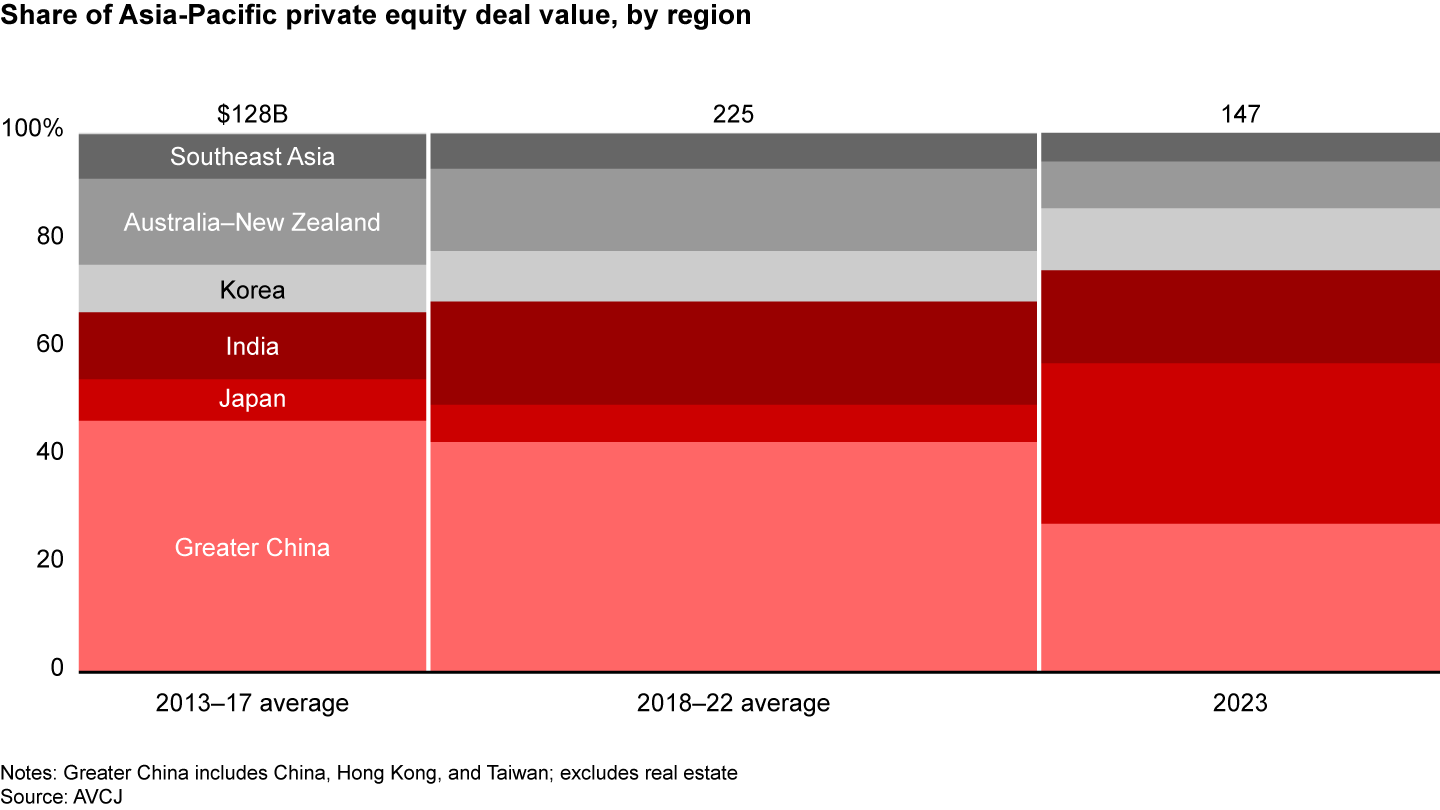
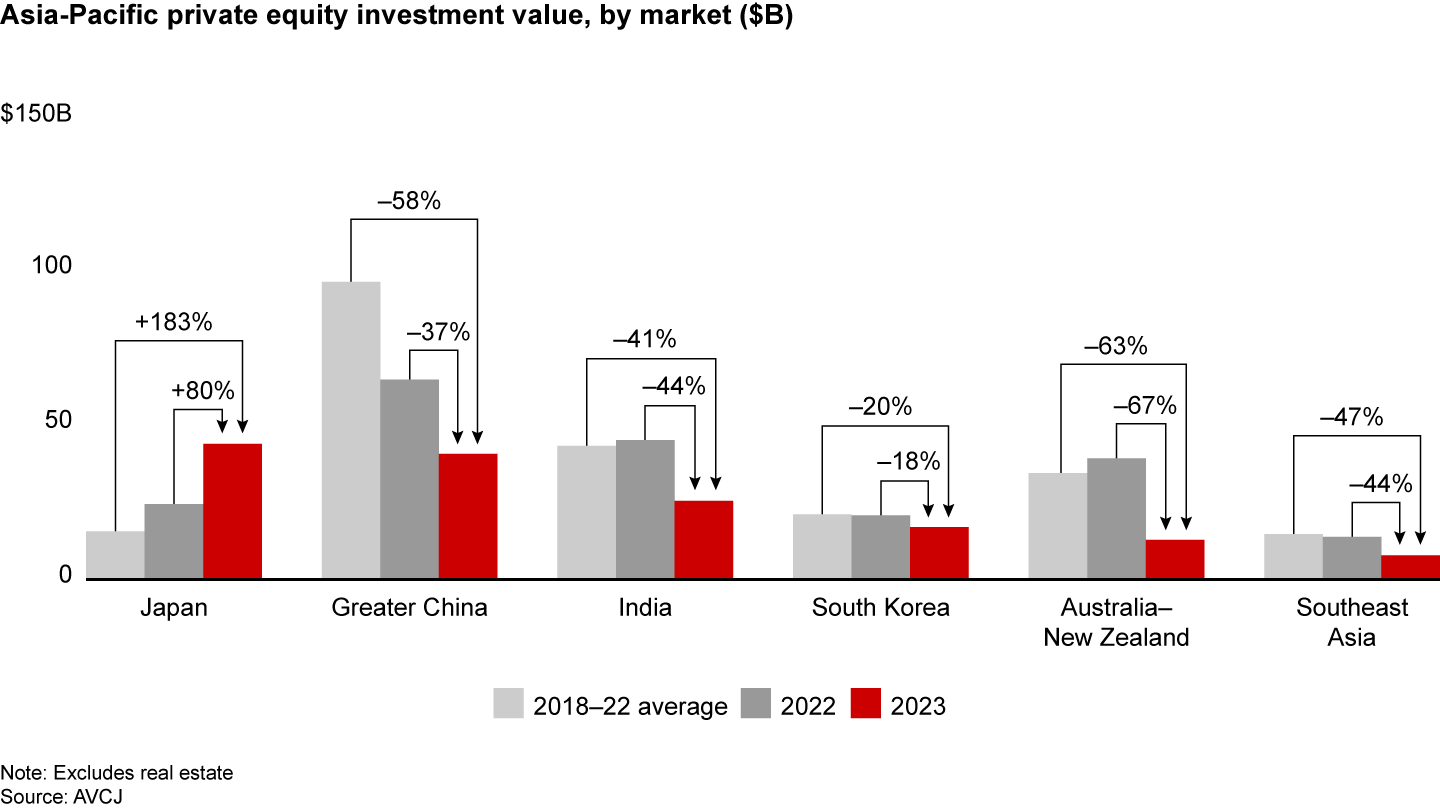
What happened in 2023?Deals all but stoppedIf investors hoped the downturn in dealmaking in 2022 would be a short-term reversal, 2023 dashed those ideas. Despite brief flurries of activity, the market continued to decline. Asia-Pacific deal value fell to $147 billion, 35% below the previous five-year average and 59% below the 2021 high of $359 billion. Deal value slid to the lowest annual level since 2014, and the number of deals dropped under 1,300, 30% lower than the previous five-year average of 1,849 deals. The development in Asia-Pacific’s PE market mirrored global trends. Global buyout deal value dropped 34% vs. the previous five-year average. In China, investors remained cautious. Deal value fell 58% compared with the previous five-year average, reducing China’s share of total Asia-Pacific deal value to 28%, down sharply from the previous five-year average of 43% (see Figure 3).
Figure 3

Economic uncertainty also affected investors in Australia–New Zealand, Southeast Asia, and India, where deal value fell 63%, 47%, and 41%, respectively, vs. the previous five years. Each country’s share of the region’s total deal value declined, and all three reported fewer megadeals than in prior years. South Korea fared slightly better than other Asia-Pacific countries. Deal value fell by only 20% compared with the prior five-year average, increasing the country’s share of deal value. The bright spot in the Asia-Pacific PE market was Japan, where deal value rose 183% over the prior five-year average, making it the region's No. 1 deal market for the first time (see Figure 4). Deals over $1 billion in value (megadeals) were the largest factor behind Japan’s surge in deal value, helping boost the country’s share of total Asia-Pacific deal value to 30%, up from the previous five-year average of 7%. By contrast, Japan’s share of deal count was just 10%, and its number of deals increased only 9% over the previous five-year-average.
Figure 4

Several factors make Japan an attractive market for investors. An important one is the country’s deep pool of target companies with significant potential for performance improvement. Another is corporate governance pressure on leadership teams to dispose of non-core assets, encouraging spin-offs and divestitures. Given its aging population, Japan is also grappling with a lack of succession candidates to lead a growing number of companies, and selling to private equity funds is increasingly seen as an acceptable solution. Finally, Japan boasts a relatively stable regulatory environment and persistently low interest rates. Despite these advantages, Japan is a complex market that requires dedicated local teams. Almost 60% of GPs we surveyed in Japan said that recruiting and retaining talent was their biggest concern. In addition, Japan’s currency is volatile, and the country’s PE industry is relatively small. Historically, Japan has produced only a limited number of deal opportunities. For the first time since 2017, buyouts represented the largest proportion of Asia-Pacific deal value, pushing growth deals to second place. Buyouts accounted for 48% of deal value, up from the prior five-year average of 32% (see Figure 5). Growth deals represented 41% of deal value.
Figure 5
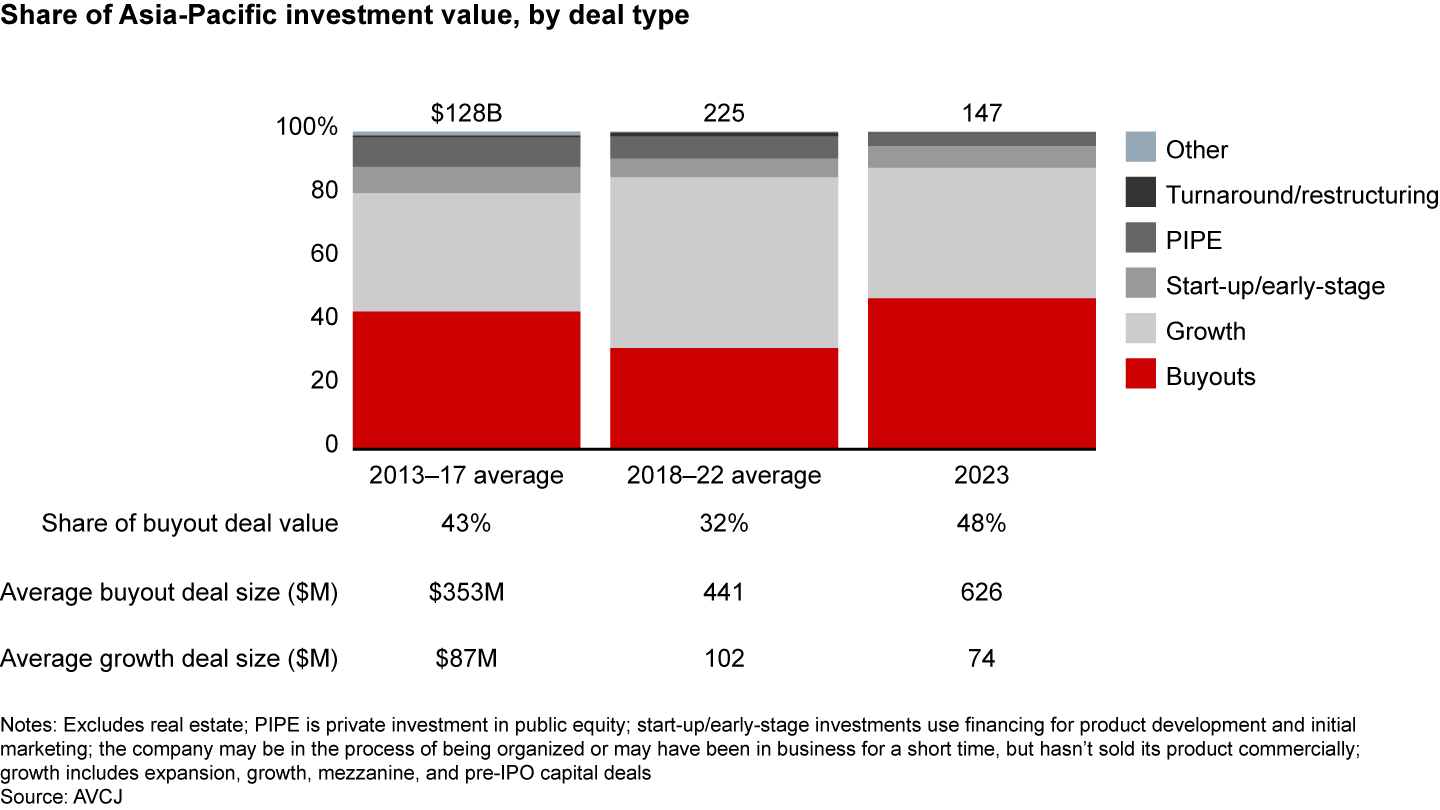

This shift was mainly due to a sharp decline in the value of growth deals, which fell 50% from the prior five-year average. The total share of growth deals dipped only 13% compared with the previous five-year average. Several market factors underpinned this trend, including the geographical mix of deals. The region produced fewer deals in Greater China, India, and Southeast Asia, markets where growth deals are dominant historically. The region also produced fewer technology deals, which typically are growth deals. Another key factor was the decline in the number of growth deals relative to buyouts. A climate of economic uncertainty means GPs can no longer rely on multiple expansion to increase the value of their portfolio companies. Instead, they are betting on operational improvement. That means taking a more active role in portfolio management to ensure successful exits and limit downside risk. Our research shows that when investors select deals, 26% are seeking to exercise more control than they did five years ago. And 36% are actively adjusting their portfolio ownership approach or target structure to increase ownership and control. As LPs strive to mitigate risk, they are allocating more capital to larger funds with established track records, and those tend to be buyout funds. Larger megadeals tended to be buyouts, increasing the share of buyout deal value. Growth deals were smaller on average than in previous years. A higher share of buyout deals helped boost the average deal size 14% compared with 2022. However, the average deal in 2023 was 7% smaller than the prior five-year average. While there were far fewer megadeals, the average was 30% larger than the previous five-year average, and 41% larger than 2022. Japan, buoyed by lower interest rates and a lower cost of capital, generated 63% of the region’s megadeals by value. These megadeals included Japan Industrial Partners' $16 billion (2.1 trillion Japanese yen) purchase of Toshiba, JIC Capital’s $6.9 billion purchase of JSR, and a JIC Capital–led consortium’s $4.7 billion acquisition of Shinko Electric Industries. Greater China generated four megadeals in 2023, a sharp drop from the 14 megadeals it averaged in the previous five years. Two of the largest were Bain Capital’s acquisition of Qinhuai Data for $3.2 billion, and General Atlantic, Mubadala Investment Company, and HongShan’s $2 billion investment in fashion company Shein. South Korea produced three megadeals, including EQT’s $2.3 billion purchase of a majority stake in SK Shieldus; UCK Partners and MBK Partners’ $1.9 billion acquisition of Osstem Implant; and the $1.2 billion sale of a stake in SK On Co to a consortium including MBK Partners, Hillhouse Capital, Qatar Investment Authority, and BlackRock. For the first time since 2016, India generated no megadeals in the technology sector and only three in total, compared with a prior five-year average of seven. India’s 2023 megadeals included Temasek’s $2 billion purchase of Manipal Health Enterprises; EQT and ChrysCapital’s $1.1 billion acquisition of HDFC Credila Financial Services; and Brookfield Renewable and Global Power Synergy’s $1.1 billion investment in Avaada Energy. Australia–New Zealand produced only two megadeals, compared with nine in 2022. These were Advent International’s $1.2 billion acquisition of luxury fashion brand Zimmermann and TPG Capital’s $1.2 billion buyout of InvoCare. For the first time since 2008, Southeast Asia had no megadeals. Spotlight on energy and natural resourcesThe technology revolution had dominated private equity deals for the better part of a decade. But in 2021, investors began shifting away from riskier, more speculative assets to defensive assets, including manufacturing companies and firms linked to the energy transition. The trend accelerated in 2023, resulting in a more balanced mix of deals by sector. While the technology sector still represented the largest share of deals in the Asia-Pacific region in 2023, it made up only 27% of deals, down from the prior five-year average of 41% (see Figure 6). GPs perceive technology companies as riskier than other industries and worry that valuations are likely to fall further.
Figure 6
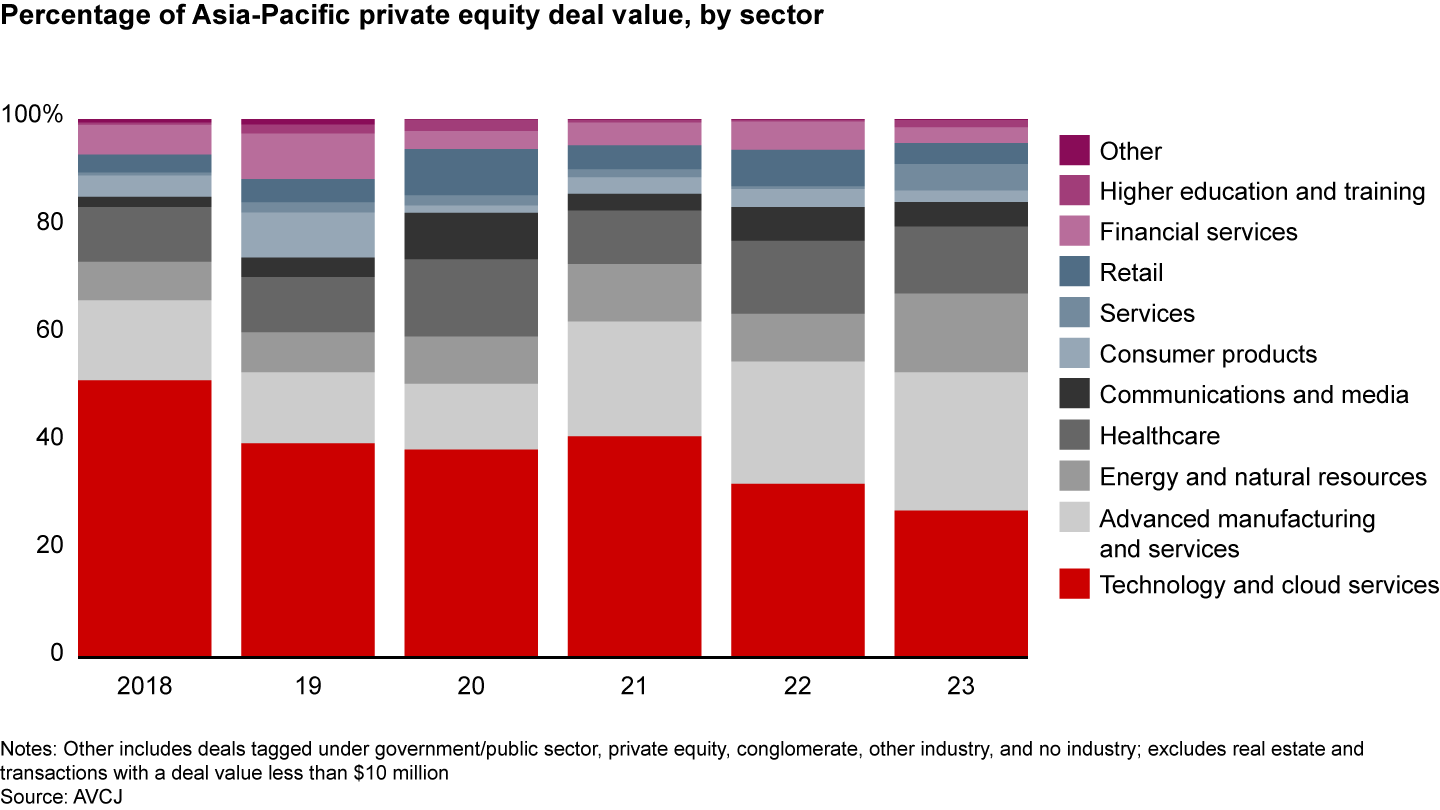

Energy and natural resources was the only sector to record an increase in deal value and deal count. Deal value rose to $22 billion, up 7% vs. the prior five-year average. Energy and natural resources accounted for a 15% share of deal value, up 6% over the previous five-year average. JIC’s $6.9 billion buyout of JSR contributed to that growth. Deal count rose 46% vs. the previous five-year average. LPs and GPs are increasingly focused on energy-transition-related assets as a growing number of organizations make net zero commitments and regulations encourage sustainable practices. GPs also are betting that the energy transition will create a lucrative investment opportunity. Advanced manufacturing and services accounted for 26% of total deal value, up 8% over the previous five-year average. This increase stemmed primarily from the $16 billion (2.1 trillion Japanese yen) buyout of Toshiba. Three megadeals propelled the services sector to a gain in deal value. It was an unusual number of megadeals, given the sector historically has produced only one or two every few years. The largest of these deals was EQT’s $2.3 billion purchase of a majority stake in SK Shieldus in South Korea. The definition of private equity has blurred in recent years as PE funds pursue infrastructure deals and infrastructure funds vie for PE targets. The areas of overlap where both types of funds invest typically exclude the core infrastructure segment, which consists of more traditional assets such as ports and roads that are regulated, low risk, and provide stable returns. The businesses of interest to both types of investors include infrastructure operations that could be defined as “core plus”—somewhat regulated, low cyclicality, medium risk with moderate returns, such as airports, or value-added businesses. PE and infrastructure funds are also interested in medium-to-high-risk businesses with moderate to high returns, such as renewable energy storage or data centers. Both types of funds may go after opportunistic investments that are higher risk and have the potential to generate higher returns. As in past recessions, investors are betting on more resilient sectors, including those historically dominated by non-core infrastructure funds, such as healthcare and services sectors. Deals in these sectors also gained a small amount of share as investors turn away from less resilient sectors such as retail, financial services, and consumer products. Competition shrinksCompetition for PE deals peaked in 2021. The number of active investors in the Asia-Pacific region has now fallen to 2,535, down 25% compared with 2022 (see Figure 7). This trend affected every country, with the drop in active investors ranging from 13% to 45%.
Figure 7
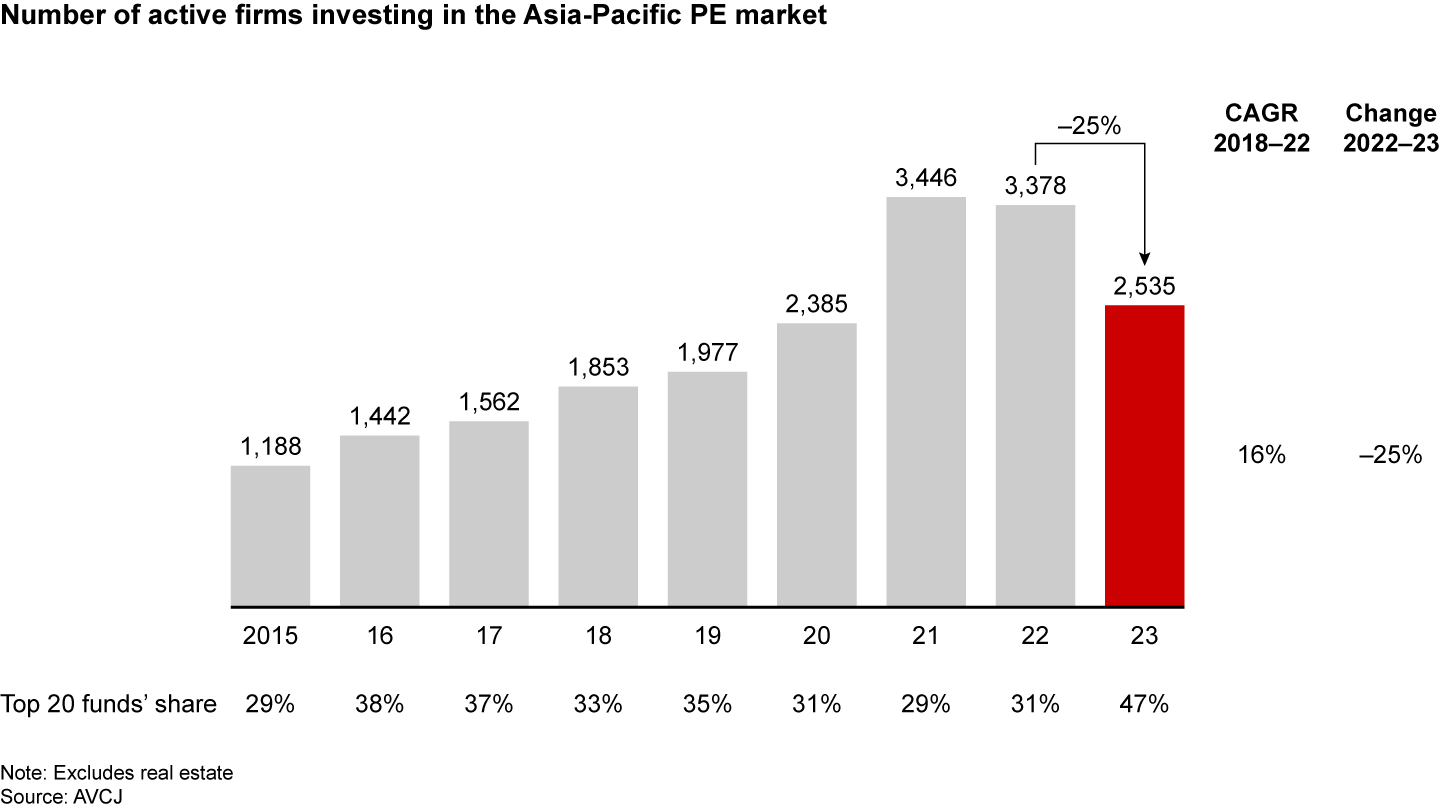

Despite the decline in active investors, nearly 30% of survey participants said they struggled to find enough deal opportunities, compared with 14% a year ago. Fewer deals and a slowdown in fund-raising left a number of underperforming funds unable to compete. By contrast, the largest, most active funds benefited from less competition. The region’s top 20 funds’ share of deal value increased to 47%, up significantly over the prior five-year average of 31%. As in previous years, most of these funds were global GPs. However, their prominence in the top 20 was diluted in 2023 by a handful of government-affiliated funds and domestic GPs that were more active in larger deals than in previous years. Another factor contributing to reduced competition for deals is GPs’ reluctance to invest in a climate of macroeconomic uncertainty. Many are sitting on the sidelines and waiting for improved market conditions to deploy capital. Investors continued teaming up to make the most of their complementary expertise and resources, while reducing risk. The average number of investors per deal was 3.8, similar to the previous two years, but an increase from pre-2021 levels. Global and domestic GPs were again the largest investor groups based on share of deal value (see Figure 8). More than half of the GPs we surveyed expect local and regional firms and large global PE firms to be the biggest competitive threat over the next 12 months. Nearly 20% said that alternative asset classes such as infrastructure and credit were a big competitive threat.
Figure 8
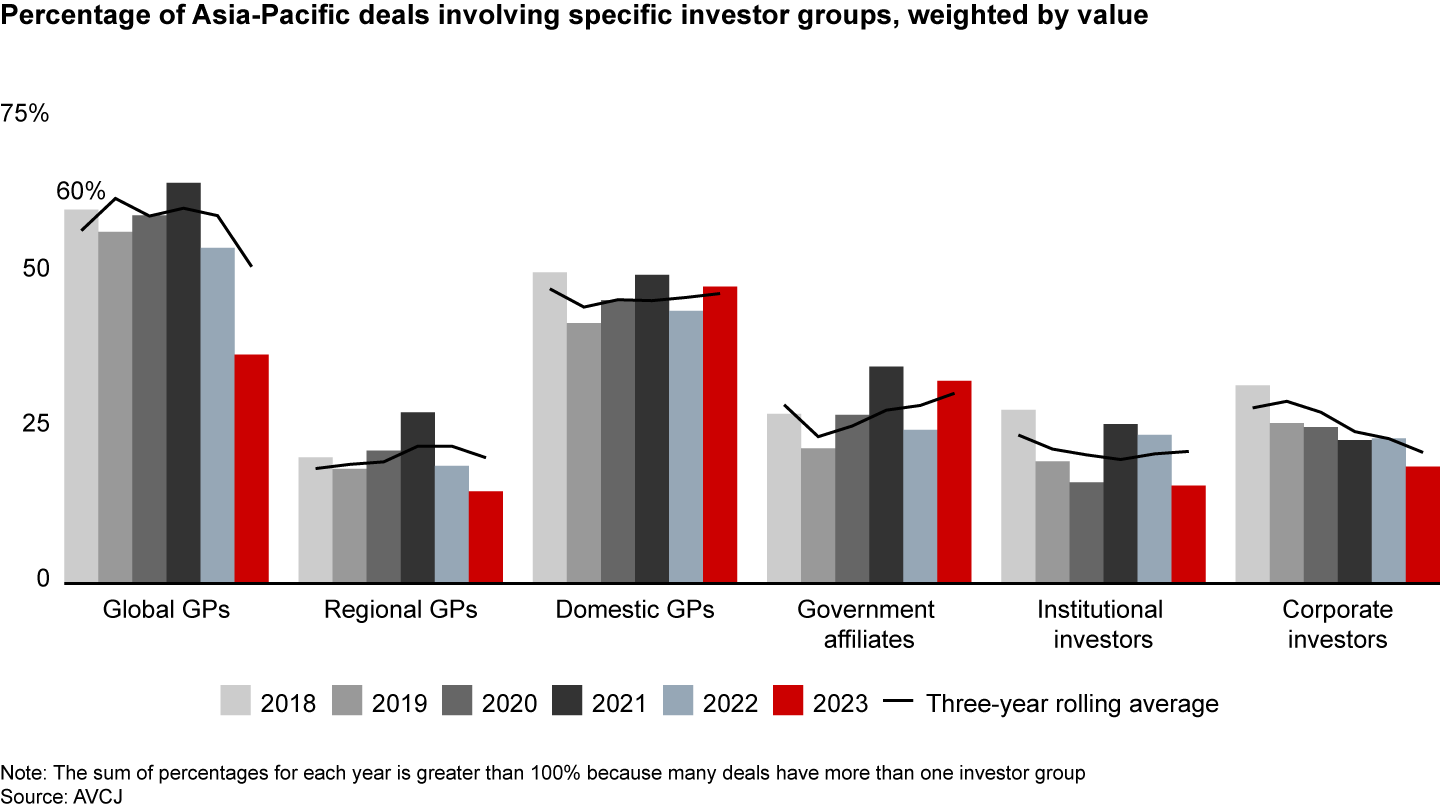

Investor activity largely declined across the region, with global GPs experiencing the sharpest drop in share of total deal value. However, the trend varied in each individual market. In Greater China, domestic GPs participated in deals totaling 72% of deal value, roughly consistent with the previous five-year average. Global GPs, historically one of the most active groups in Greater China, turned cautious. Their share of deal value fell to 30%—less than half the level of 2018 and down from a previous five-year average of 52%. Similarly, dealmaking by regional GPs fell to its lowest level of activity in recent years. Government affiliates stepped in to fill some of the gap, increasing their share of deal value to 47% from an average of 25% over the last five years. Domestic GPs dominated deal activity in Japan. Buoyed by the Toshiba deal, domestic GPs’ share of deal value rose to 56%, up from a prior five-year average of 37%. By count, domestic GPs’ share was on par with previous years. Government affiliates’ share of deal value and deal count rose sharply from typically low levels. Most of their activity involved coinvestments in smaller deals and a few investments in megadeals. Global GPs were relatively inactive in Japan, given they did not participate in most of the megadeals. Global GPs also were less active in India, where their share of deal value dropped 19% compared with the previous five-year average. Dealmaking by other types of investors was roughly consistent with previous years. Global GPs were more active in Southeast Asia during the last two years, while all other types of investors reduced their share of activity. South Korea experienced no dramatic shifts; however, government affiliates were more active than usual. In Australia and New Zealand, regional and domestic GPs’ share of deal activity rose; government-affiliated funds were nearly absent from the market. Multiples plungeDeal multiples—the ratio of enterprise value to EBIDTA—fell sharply in 2023 to 10.1 from 14.8 a year earlier, according to data reported at year-end (see Figure 9). Key factors contributing to lower multiples include general market uncertainty, the unpredictable business outlook for potential target companies, and the declining valuation of comparable companies sold on public markets. Also, the share of technology deals, with their historically high multiples, was lower. Finally, buyers are pushing harder for better prices. Our survey showed 41% of GPs are now seeking attractive entry multiples more than they were five years ago. Most investors (62%) believe valuations will fall further over the next two years.
Figure 9
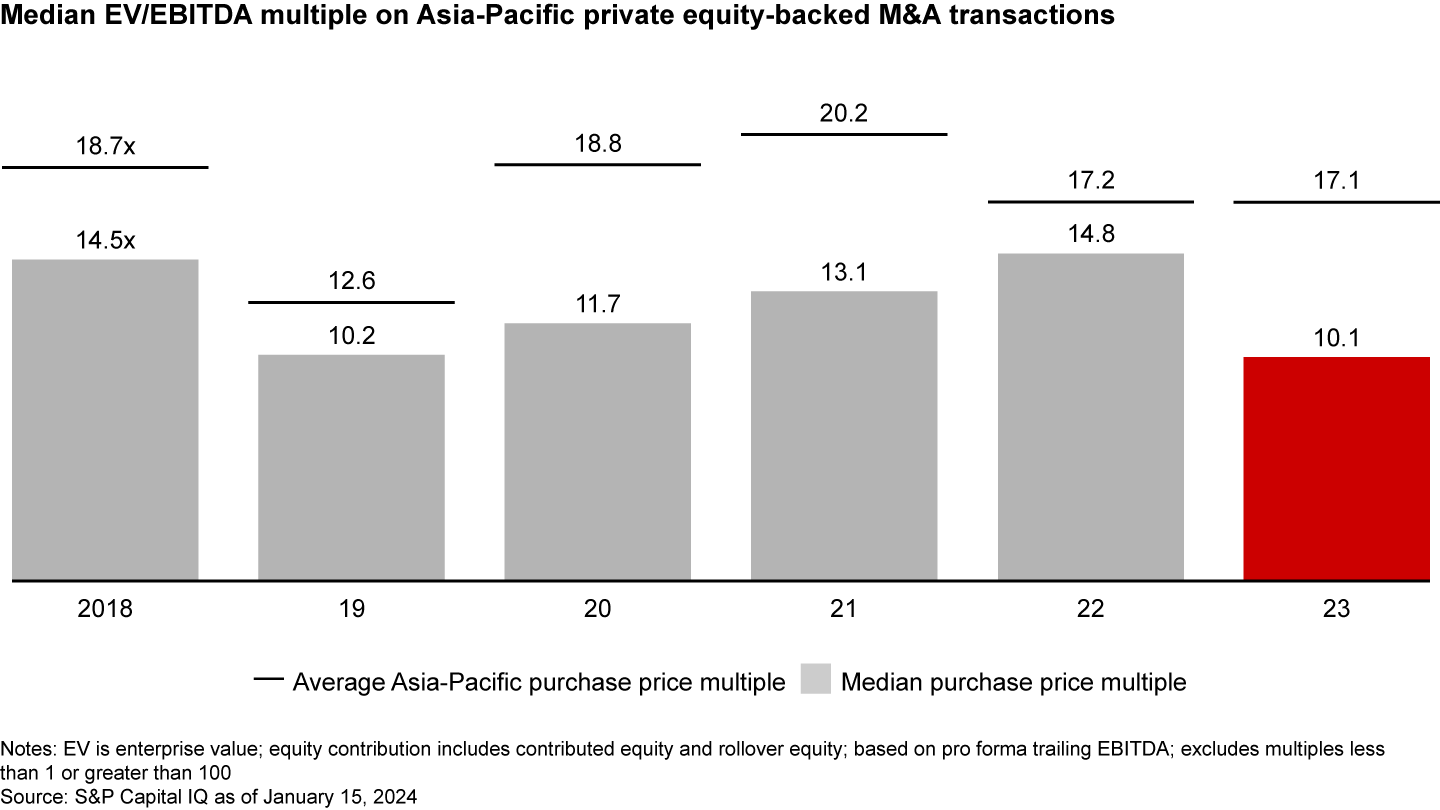

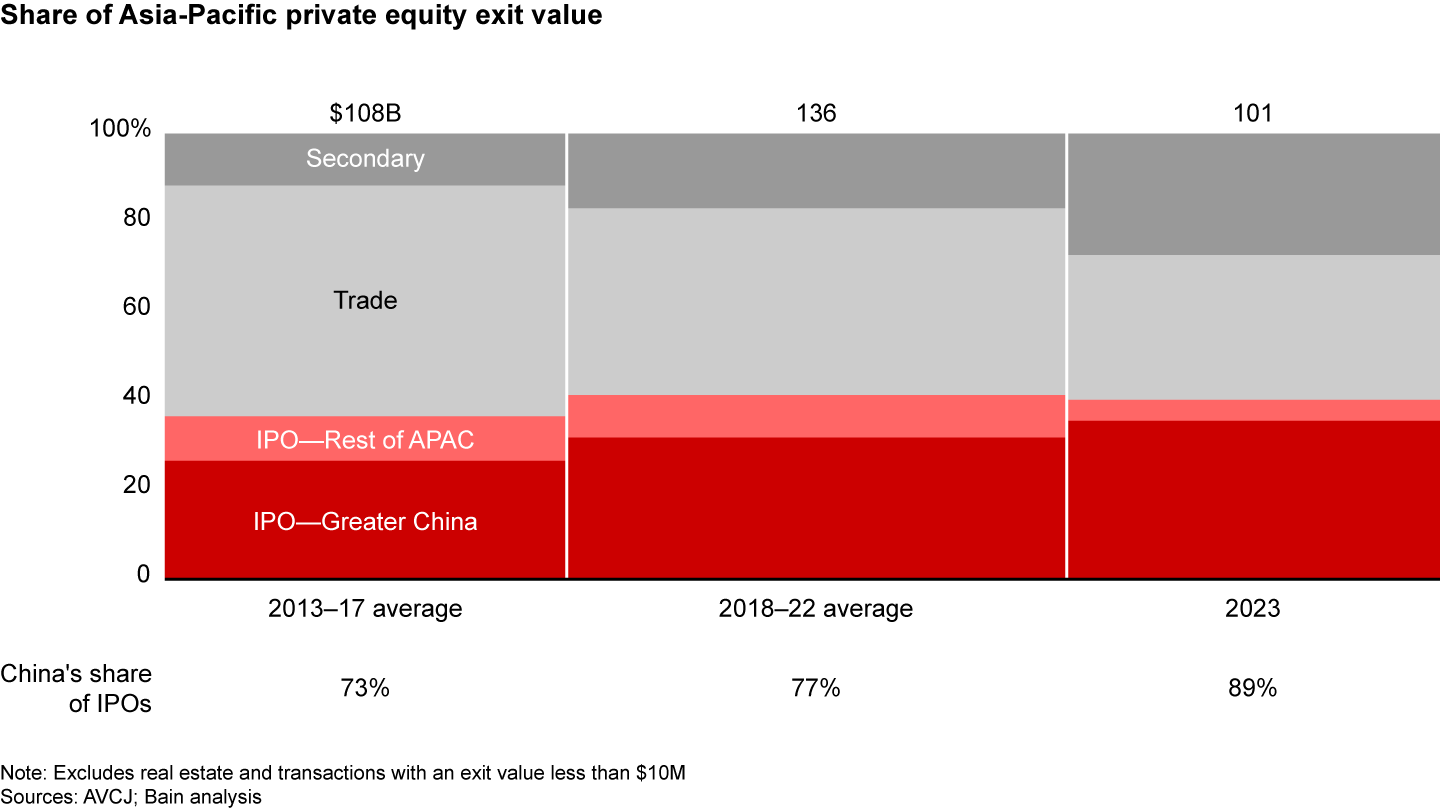
Fewer tech transactions may prompt additional reductions in deal valuations. However, as demand for other types of assets picks up, selected valuations in real estate, resilient sectors, or energy transition assets may spike. Exits drop againExits plunged to $101 billion, falling 26% vs. the previous five-year average, and declining 51% from the record-breaking level in 2021. Nearly 80% of GPs said conditions were somewhat or far more challenging than 2022, and only 22% made successful exits as planned. Thirty percent made no exits at all. Three-quarters of GPs blamed troubled macroeconomic conditions for the tough exit environment. A second factor was underperforming and unpredictable IPO markets, according to 62% of GPs. In most countries, public markets had a limited appetite for IPOs. Overall, the channel accounted for 40% of exit value, roughly on a par with the previous five-year average. Greater China accounted for 89% of exit value by IPO, up from the previous five-year average of 77% (see Figure 10). Eighty percent of Greater China IPOs by count were done on the Shanghai Stock Exchange or the Shenzhen Stock Exchange. And the majority of these IPOs were owned or invested in by government-affiliated funds and RMB funds.
Figure 10

Excluding Greater China IPOs, the total exit value for the region was $65 billion, a 30% decline from the previous five-year average (also excluding IPOs in Greater China). The IPO channel (without China) accounted for only 7%, or $4.5 billion, of total exit value, down 65% from the previous five-year average of $13 billion. IPOs declined in the rest of the Asia-Pacific region for several reasons. Lackluster public market performance and low valuations convinced many GPs to put IPOs on hold. Given the limited opportunity for IPOs, GPs turned to secondary exits, which made up 27% of exit value, up 10% vs. the previous five-year average. The large number of megaexits and large exits fueled the rise in secondary exits’ share of exit value. Trade exits' share fell to 33% (down 9% vs. the previous five-year average) as trade buyers focused more on their core business. Exit performance was mixed across markets (see Figure 11). Japan’s exit value rose 144% over the previous year, buoyed by megaexits, including three by Bain Capital: the $2.7 billion sale of a 50% stake in Works Human Intelligence to GIC, the $1.4 billion acquisition of Nichii Holdings by Nippon Life Insurance, and the $1.4 billion purchase of Japan Wind Development by Infroneer Holdings.
Figure 11
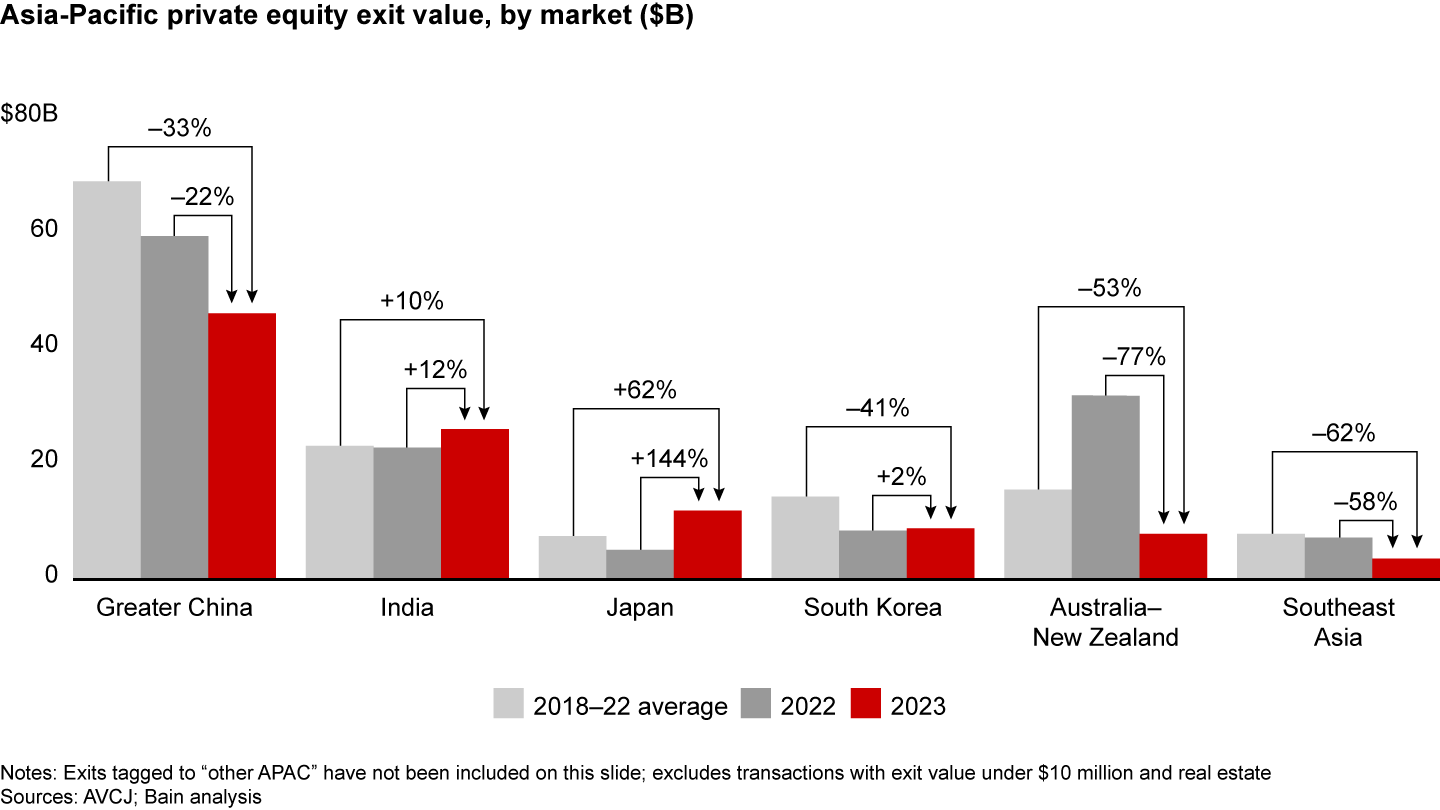

India’s exit value rose 12% compared with the previous year, spurred predominantly by open market sales after a spike in IPOs in recent years. Korea’s exit value increased slightly in 2023 but was down 41% compared with the previous five-year average. Greater China remained the region’s largest exit market, accounting for 45% of 2023 exits; however, exit value fell 22% compared with the previous year. Exit value in Australia–New Zealand and Southeast Asia fell sharply from 2022 levels (77% and 58%, respectively). More than half of GPs surveyed in these markets believe that exit conditions will improve if they wait to sell companies in their portfolios. Technology and industrial-related companies again dominated the exit market, increasing their share of the region’s total exit value (see Figure 12). IPOs in Greater China accounted for 42% of the technology sector’s exit value, and most of those sales were semiconductor firms. Megaexits included Bain Capital’s $2.7 billion sale of a 50% stake in Works Human Intelligence to GIC (Japan) and Tiger Global and Accel's $1.8 billion sales of their stakes in Indian e-commerce firm Flipkart to Walmart. IPOs in China also made up the bulk of industrial-related exits.
Figure 12


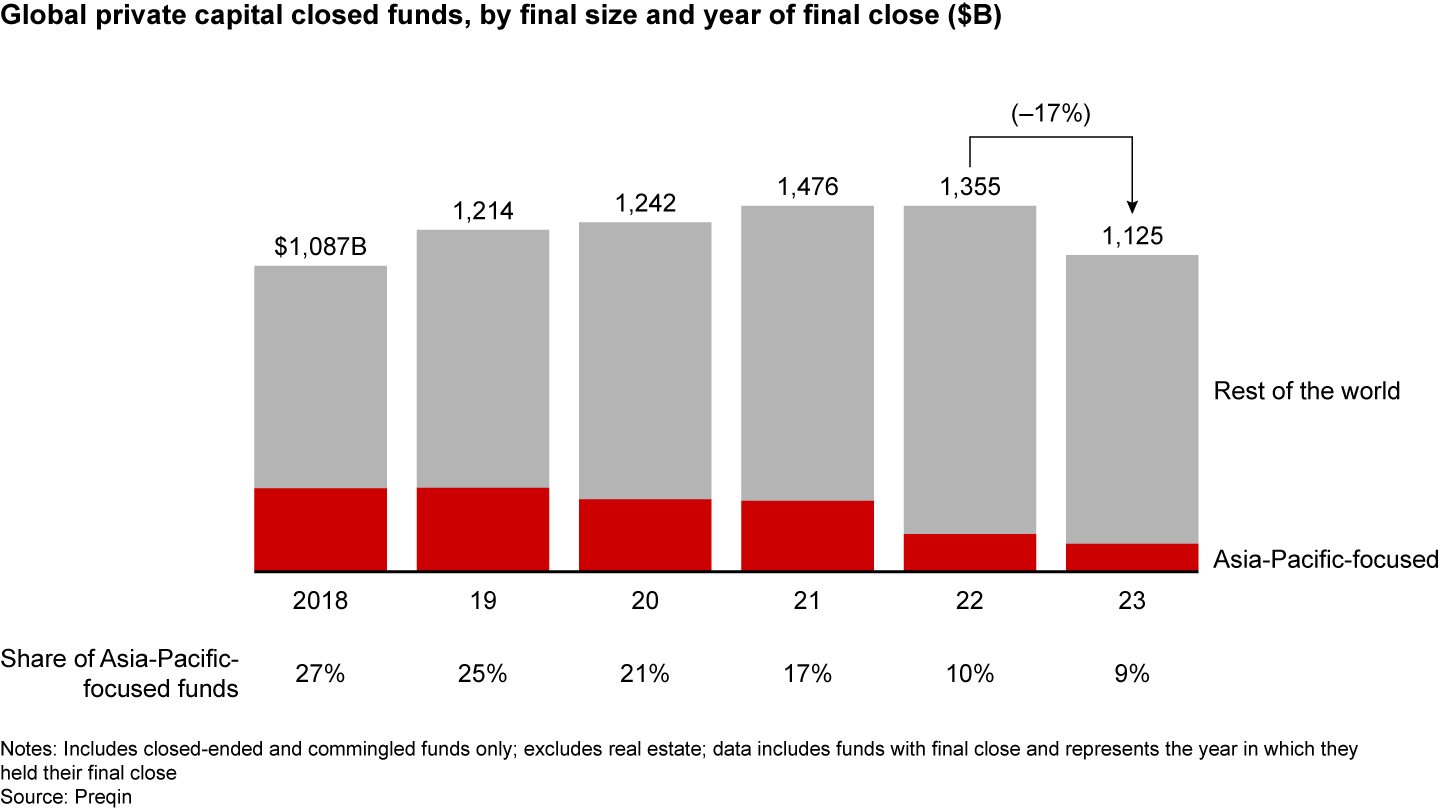
Exits were smaller as average exit value declined for the second year in a row to $182 million, down 25% from 2022. Fewer large exits dominated the market in 2023. There were only 16 megaexits, down from a five-year average of 26, as many investors held out for better exit conditions and higher valuations. Nearly half (46%) of GPs we surveyed said successful exits were characterized by very strong management, while 44% and 34% cited strong market growth and keen buyers, respectively. Fund-raising plummetsInvestors raising new funds continued to shift their focus away from the Asia-Pacific region. The global share of Asia-Pacific-focused private capital funds fell to 9%, down sharply from an average 23% over the last decade (see Figure 13).
Figure 13

Global fund-raising fared better than Asia-Pacific-focused funds. Global capital raised was down just 17% over 2022. Asia-Pacific-focused funds raised $100 billion, a 26% fall vs. 2022 and a 60% drop vs. the prior five-year average of $248 billion. Investors continued to shift capital raised to pan-Asia-Pacific funds, as LPs sought exposure to a wider range of markets in an effort to limit risk (see Figure 14). In terms of value, 27% of Asia-Pacific-focused funds raised were regional, up significantly from the previous five-year average of 13%.
Figure 14
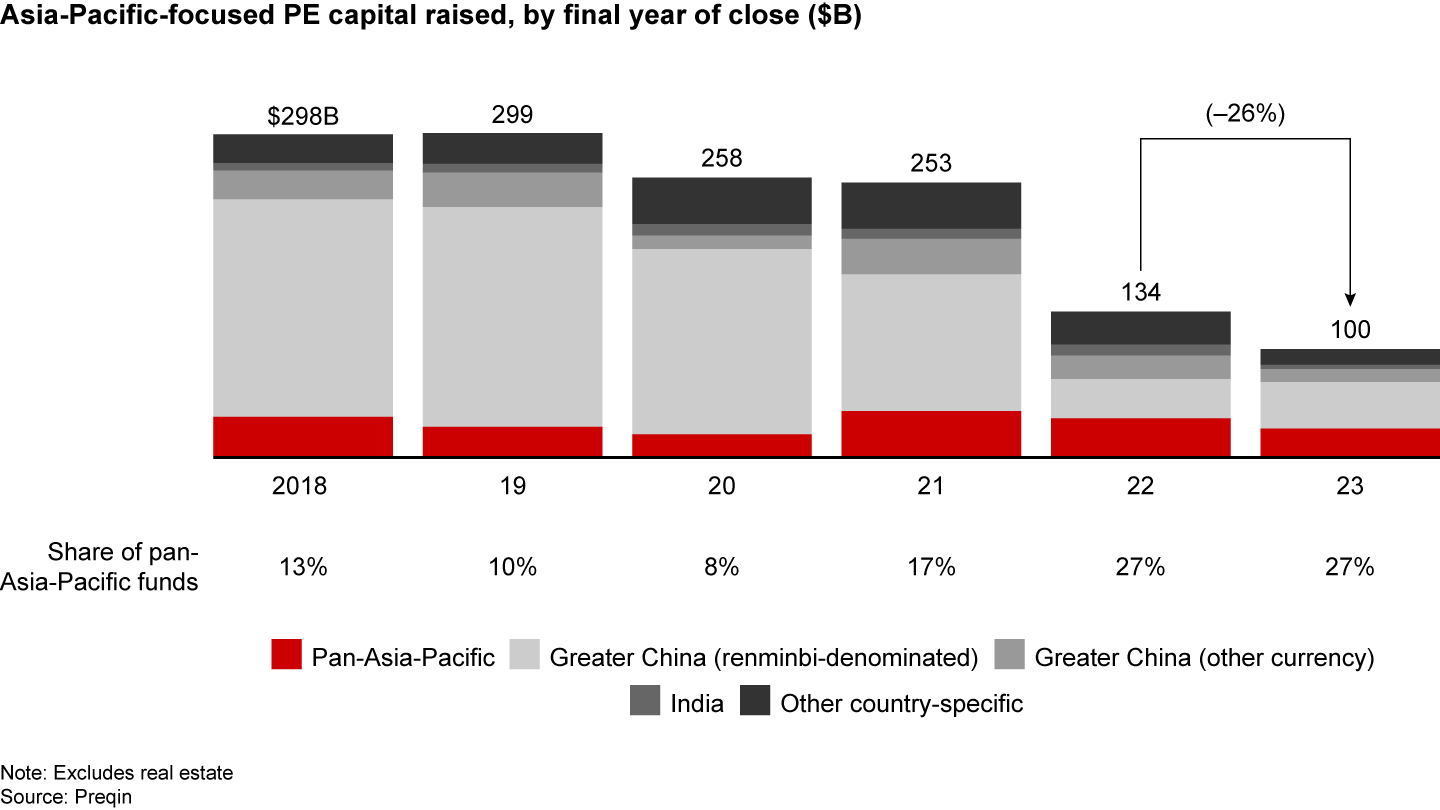

At the country level, Japan and Korea buyout funds were popular. Of the 34 buyout funds raised, 15 were Japan-focused and nine were Korea-focused funds. RMB funds accounted for a larger share of the market at 43%, up from a 27% share in 2022 but still well below the previous five-year average share of 59%. Several mega government-affiliated funds closed, contributing to the increase. These included the $22 billion Guangzhou Industry Fund of Funds and $7 billion Guangzhou Venture Capital Fund of Funds. The number of non-government-affiliated RMB funds closed continued to decline. The number of funds closed in the Asia-Pacific region fell to 308, the lowest level since 2009 and a sharp contrast to 2017 when well over 2,000 funds closed (see Figure 15). The vast majority of GPs we surveyed (86%) said that 2023 was more challenging than 2022, and 89% believe 2024 will be the same or worse.
Figure 15
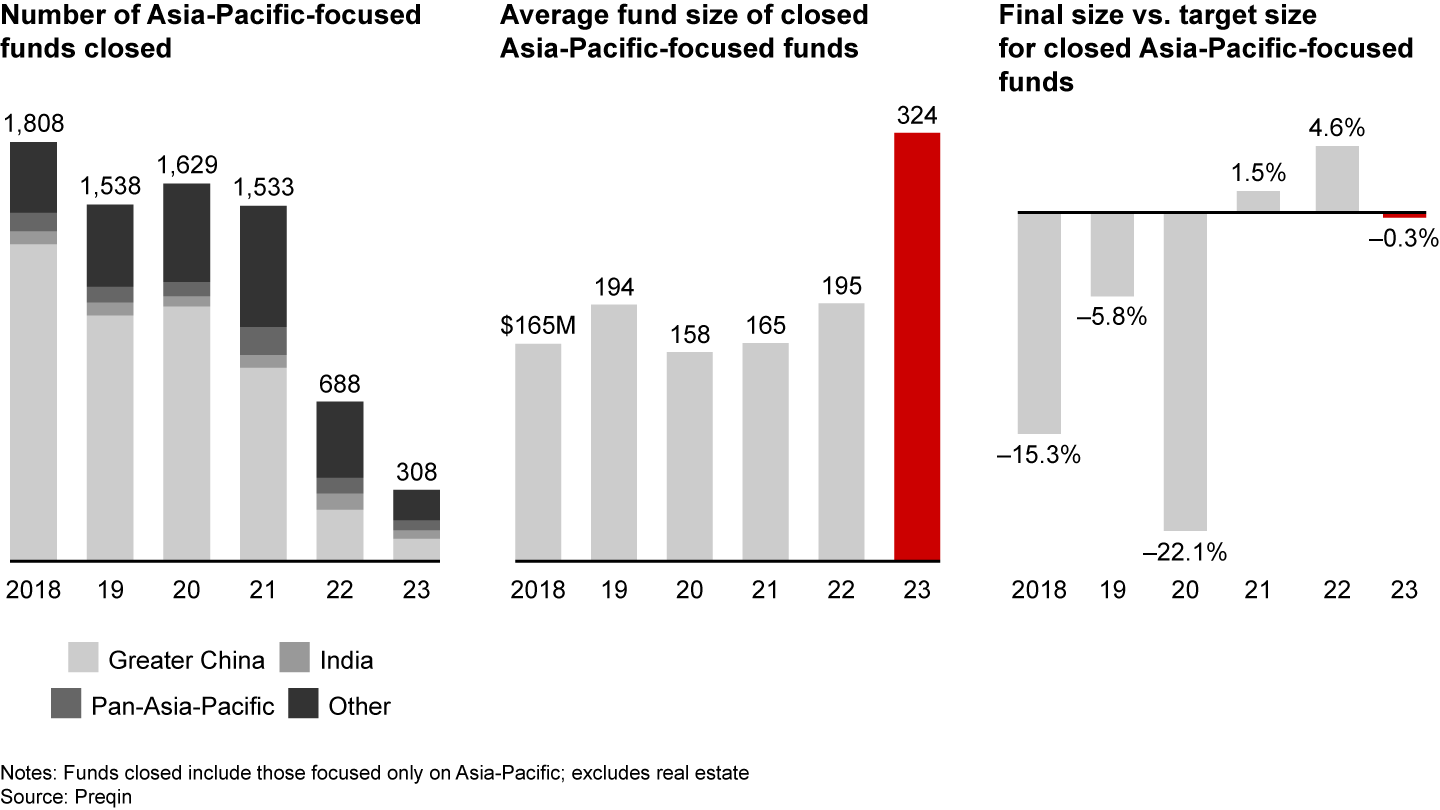

The average size of closed funds was $324 million, up sharply from the previous five-year average of $173 million. The increase was fueled by a shift to buyout funds: The share of buyout funds rose to 41% vs. a 14% average over the last five years. Buyout funds were also larger in size, on average. The move toward larger funds underscores investors’ flight to quality, a trend that emerged several years ago but became particularly important in 2023 as LPs sought to diversify their exposure and selected funds with a proven ability to generate strong returns and control risk. Despite the shift to larger buyout funds, only 10 funds over $1 billion closed, compared with 26 in 2022. The largest non-RMB funds included Bain Capital’s $7.1 billion Asia Fund V and Primavera’s $4.1 billion Capital Fund IV. It took longer to close funds regardless of fund size and experience. The average time was 24 months, up from 17 months between 2020 and 2022. The few funds that managed to close were at or near target size. A key reason for the difficulty in raising funds is that LPs have tightened their purse strings. Forty percent of GPs say LPs are reducing their allocation of capital to the Asia-Pacific region, and 39% say they’re allocating more to other non-PE asset classes. At the same time, LPs are raising the bar for performance. More than one-third of GPs say as competition increases for capital, LPs are requiring a stronger fund track record. Several additional factors depressed fund-raising. A dearth of exits and limited distribution of capital back to LPs have stemmed the flow of fresh capital to PE funds. LPs are overallocated, and distributed-to-paid-in capital (DPI) ratios are low after six years of low or negative net cash flow. Most will only start to allocate capital on a broader basis when net cash flow turns positive. Contributing to the shortfall, foreign LPs have continued to pull away from China, deterred by ongoing tensions and economic uncertainties. Currency fluctuations in some markets have added to LPs’ reluctance to invest. The denominator effect—a situation in which the public holdings portion of a portfolio decline in value while private asset values remain stable—partly subsided as public markets around the world began to recover. But LPs’ allocation restrictions are still limiting their ability to channel capital to private equity. It’s also important to consider that fund-raising data is a lagging indicator. The situation today may be even worse than it looks, since many funds that closed recently were launched (and committed to) under better market conditions in 2021 or 2022. A more forward-looking data set supports that assessment. Asia-Pacific private capital funds on the road were seeking $400 billion in new capital in 2023, but only $68 billion in LP allocations was available, according to Preqin. In other words, for every $6 of capital that funds were seeking to raise, there was just $1 of supply available from LPs. This imbalance has intensified since 2022, when there was a 2-to-1 ratio of demand vs. supply. And it contrasts sharply with the 10-year trend of LPs having more capital available on aggregate than demanded by funds. More than one-third of GPs said the competition for funding was fierce. PE funds that have successfully closed new funds typically have a strong track record of generating returns. Bain Capital delivered strong returns and cash flow back to LPs with its earlier funds Asia III (vintage 2016, 20% IRR) and Asia IV (vintage 2018, 42% IRR), according to Preqin. Those results helped Bain Capital’s $7 billion Asia Fund V exceed its fund-raising goal by $2 billion. GPs that led in closing new funds also tended to have differentiated strategies, including exposure to favorable geographies, attractive sectors, and less competitive market segments. Based on Preqin’s 2023 global LP survey, Japan ranked No. 3 among the top developed markets for PE investment opportunities, after the US and Western Europe (excluding the UK), and Australia–New Zealand ranked No. 6. Among emerging markets, India ranked No. 1 for investment opportunities, and Southeast Asia ranked No. 2. With the benefit of an experienced team on the ground in Japan, Advantage Partners closed its Japan-only buyout fund, Fund VII, at 130 billion Japanese yen, above its target of 120 billion Japanese yen. Five V Capital, based in Australia and New Zealand, raised its A$770 million buyout fund, Fund V, after just three months of fund-raising. The fund will focus on mid-market growth investments, including minority transactions, which draw fewer bidders. Despite the difficulty in fund-raising, the estimated level of dry powder, or total unspent private equity capital, remained consistently high (see Figure 16). However, the total for confirmed funds raised in 2022 declined from an almost uninterrupted growth streak, including 2021’s new high. About one-third of undeployed capital in the region has been committed for four years or longer, putting GPs under pressure to deploy it.
Figure 16


Returns remain attractiveFor vintages in which most portfolio companies have been sold (2015–2017), top-quartile funds have achieved attractive returns, with IRR ranging from 19.9% to 26.5% (see Figure 17). The strong returns of top-quartile funds, roughly on par with the performance of older vintages, underscores the multi-year trend of LPs preferring the larger, more experienced funds. The performance gap between top quartile and third-quartile funds has largely widened for vintages since 2013.
Figure 17
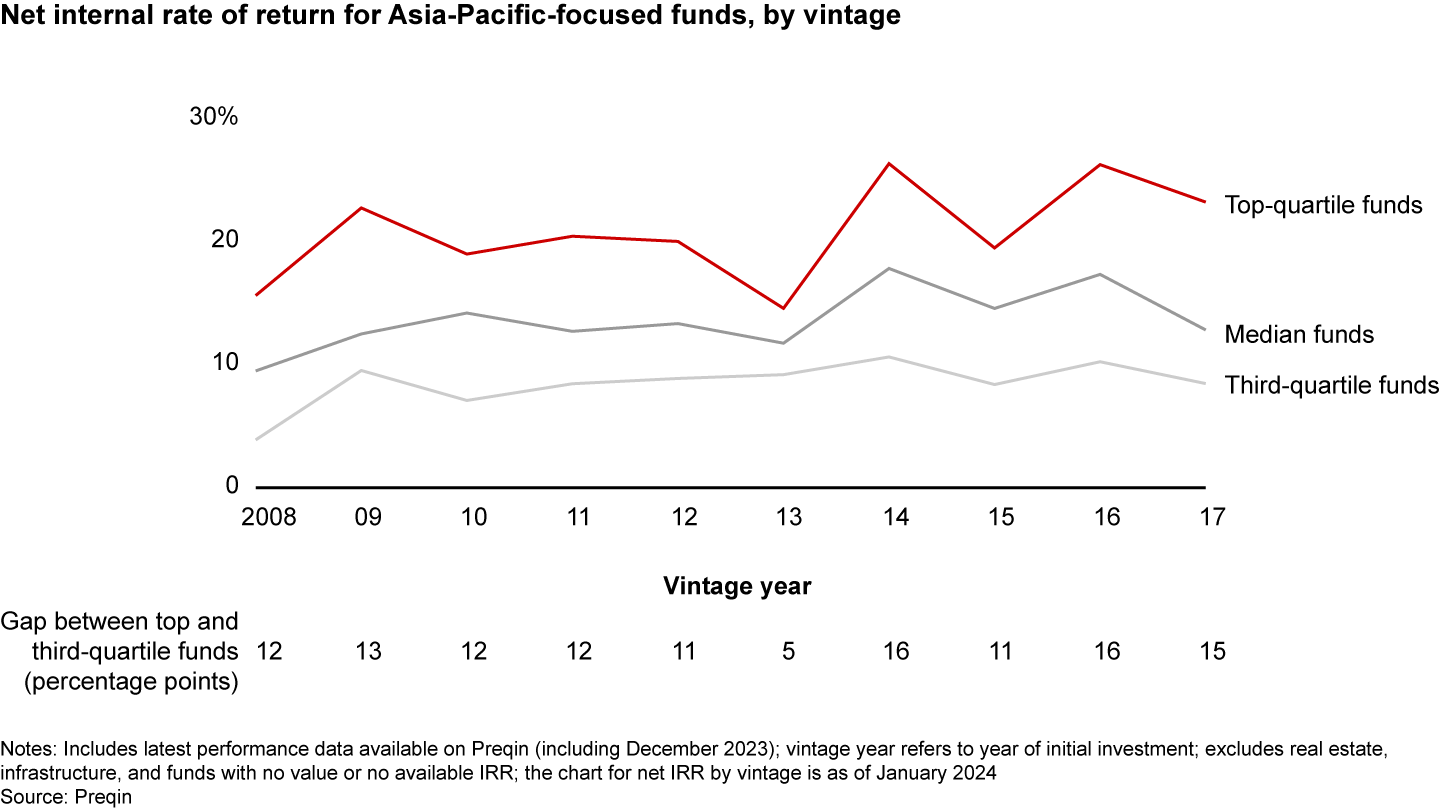

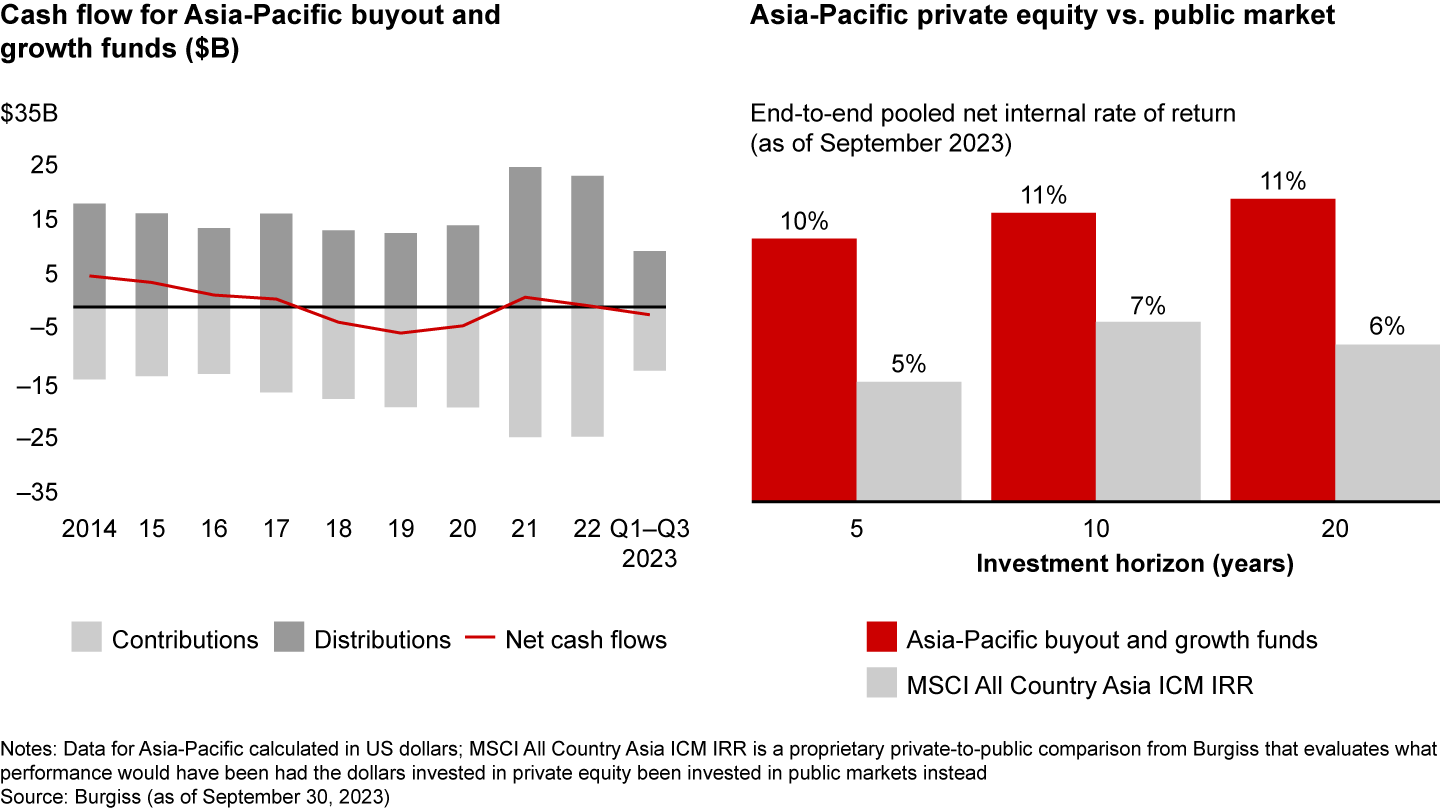
Median returns remained stable, with an overall median IRR for 2015–17 vintages ranging from 13% to 17.5%. Despite economic turmoil and uncertainty, this level of return is roughly aligned with that of previous years. According to Burgiss’s proprietary market index MSCI All Country Asia ICM, private equity continued to outperform public markets by 4% to 6% across 5-, 10-, and 20-year time periods. GPs had mixed expectations for returns in the next three to five years, with no clear consensus. However, 39% expect worse returns—a noticeable increase over 27% last year. Given PE funds’ dismal exit performance, Asia-Pacific funds’ net distribution to LPs dipped back into the red. Over the last six years, LPs have only seen two years of positive net cash flow from private equity investments in the Asia-Pacific region, both of which were relatively low (see Figure 18). That result steps up pressure on GPs to get cash distributed and moving again.
Figure 18

To adapt to a challenging market, GPs are changing how they work. More than two-thirds of the GPs we surveyed said they’ve been increasing their focus on portfolio management, and more than half are working harder on exit planning. It’s a smart approach, since top-line growth has been the most important factor fueling returns on deals exited, according to 71% of GPs we surveyed, followed by cost improvement and capital efficiency (70%) and M&A (48%). All three will be critical to deal success in the coming five years. 
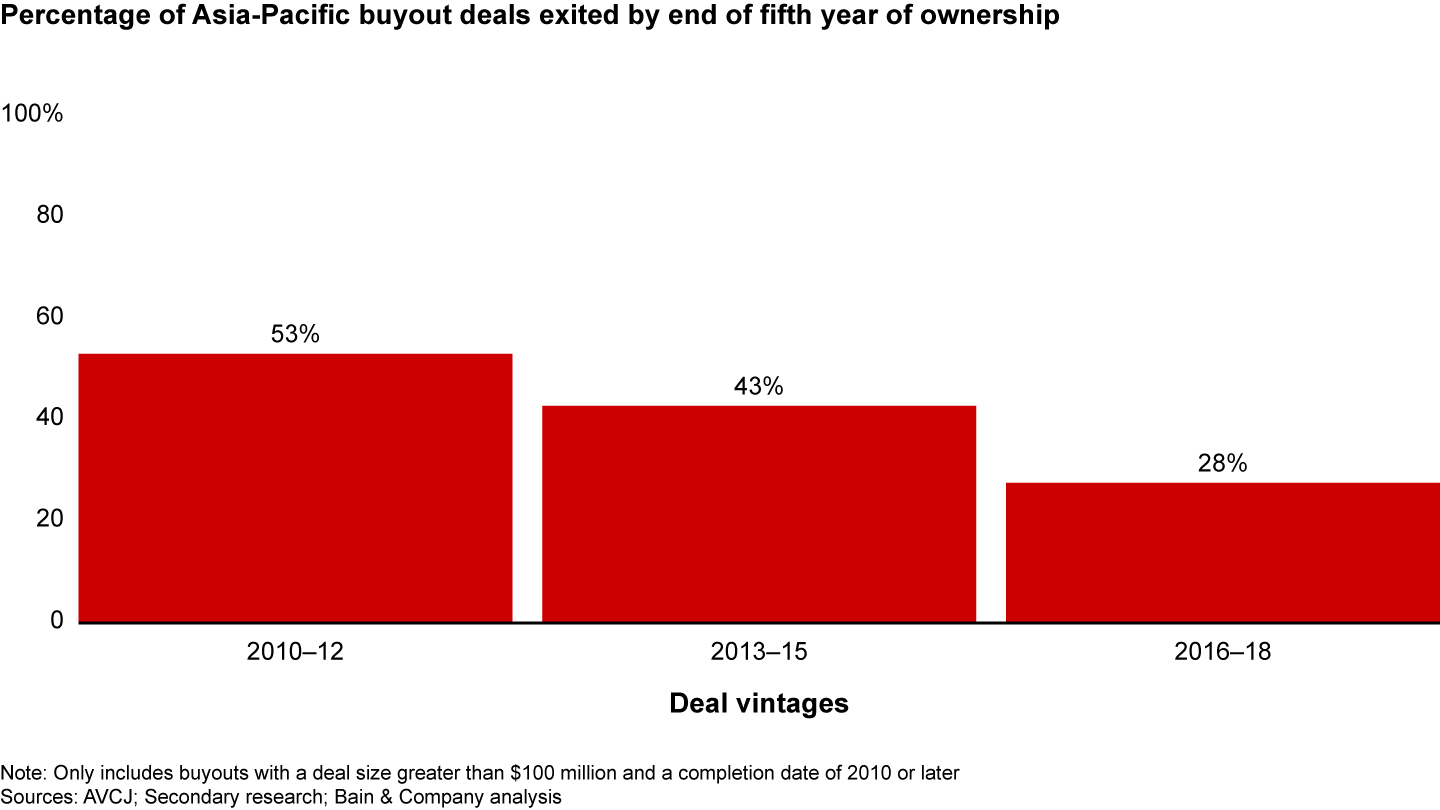
Improving portfolio exit valueAchieving exits in 2023 was a serious problem for Asia-Pacific PE funds. A sharp drop in the number of exits after years of vigorous dealmaking has left portfolios with an unprecedented number of aging investments (see Figure 19).
Figure 19

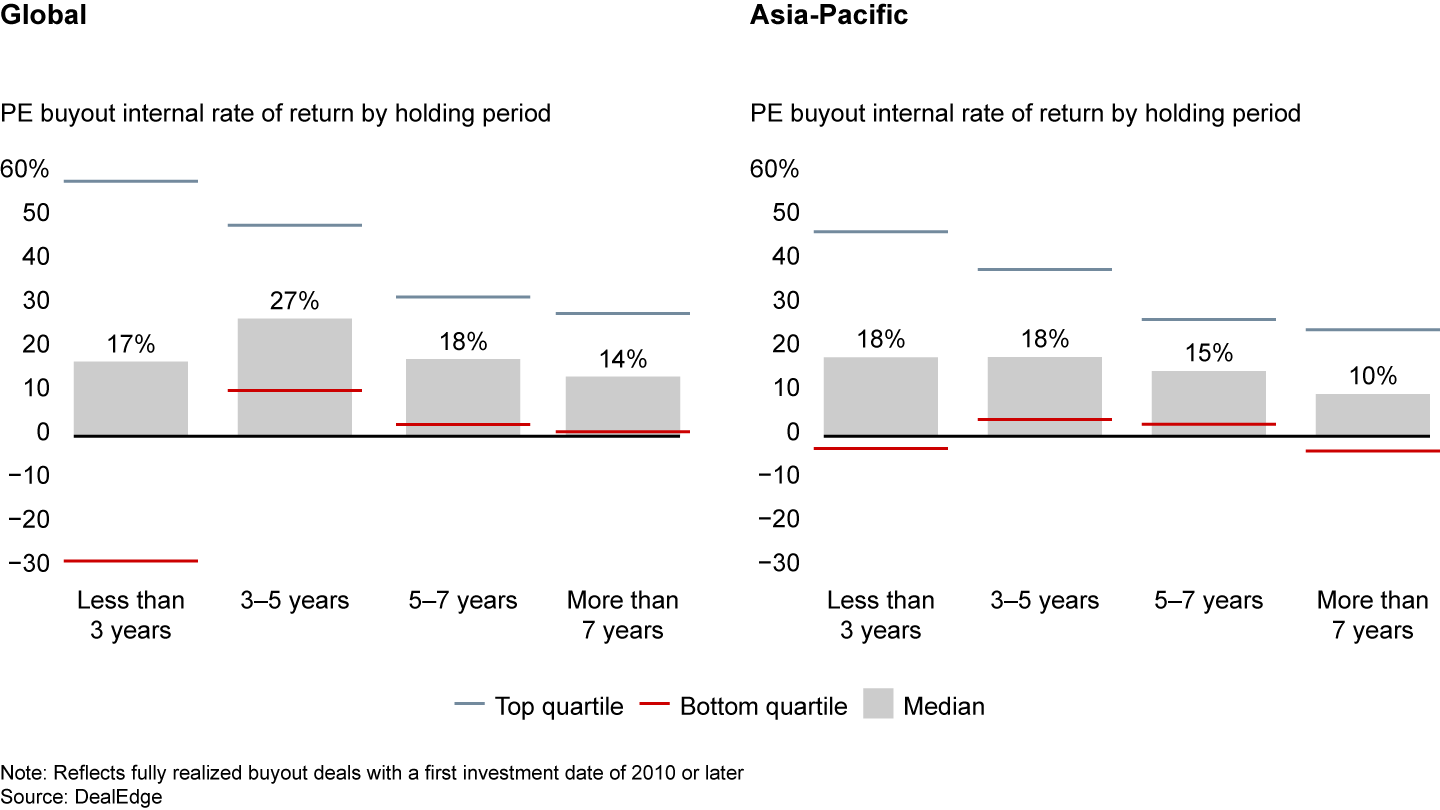
Longer holding periods present two challenges for PE fund managers. The first is a declining internal rate of return (IRR). Global and Asia-Pacific data show the longer the holding period, the lower the IRR (see Figure 20). But even more critical is the sharply reduced distributed to paid-in capital ratio (DPI)—the level of total cash distributed to investors relative to the level of capital contributed. LPs are becoming more cautious about allocating capital to private equity. GPs that have returned lower levels of capital to investors from older funds in recent years are finding it difficult to raise new funds, even if their aging funds show strong unrealized returns.
Figure 20

The average holding period for private equity portfolios has increased since 2015 despite GPs’ best efforts to pursue exits. According to our survey, investors tried to sell half of the assets they have held for more than five years. The most common reason these efforts failed was that the buyer and the seller could not agree on the valuation (see Figure 21). In this changed landscape, the ability to exit successfully has become a key factor distinguishing winning funds.
Figure 21


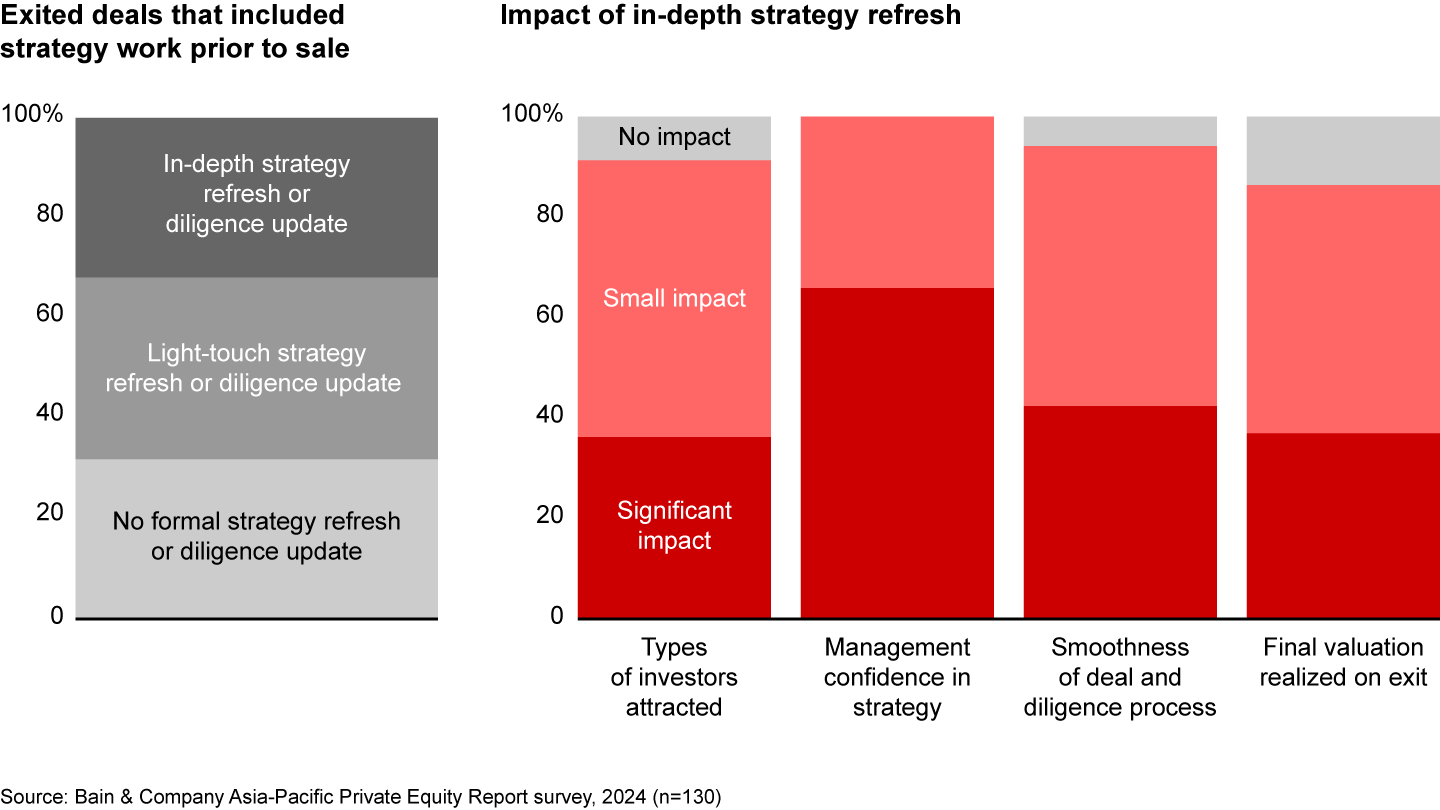
Top-performing GPs have found exit opportunities for assets with distinct characteristics in specific geographies. IPO markets in Japan and India began to rebound in 2023, and PE-backed companies in both countries pursued successful public listings, especially in the second half of the year. Many corporate acquirers may have tightened their M&A purse strings, but GPs that position their companies to appeal to a wider range of bidders, especially international buyers, have had more success. And while macroeconomic uncertainty has made it more difficult for private equity funds to sell to one another, core-plus infrastructure funds, which have a lower cost of capital than traditional private equity but accept somewhat greater risk than classic infrastructure funds, have stepped in to fill the gap. The number of Asia-focused infrastructure funds has grown in recent years, creating a broader group of potential buyers for PE firms. Some GPs have helped clinch deals by agreeing to maintain a minority stake in the company they are selling to demonstrate confidence in the value of the company. Finding a good fitFunds that achieve successful exits in today’s tough conditions share a few key characteristics. They plan their exit strategy carefully and refresh the plan when needed. They also articulate the sources of value for prospective new owners more effectively than their peers. Our survey shows that in 68% of sales, GPs conducted a new diligence effort or refreshed their pre-sales strategy to highlight the equity story for potential buyers. Those that conducted an in-depth review reported that their effort contributed most to the portfolio company management’s confidence and conviction in their strategy. It also made the deal process smoother, broadened the range of interested investors, and increased the sale valuation (see Figure 22).
Figure 22

Pre-sales strategies and diligence reviews are most effective when they help GPs highlight the growth opportunity and value creation potential for an investor. This effort may include identifying a strategic fit with the buyer, the ability to unlock value for a new investor, or defensive benefits and limited downside risk. To help spotlight future growth opportunities, the PE owners of an Asia-Pacific consumer pharmaceutical company initiated a strategic review prior to launching the sales process. The review highlighted the specific product categories and regions within the company’s diverse portfolio that were well positioned for rapid growth. The PE owners also took key actions to bolster the pharma company’s product pipeline, introducing new offerings of its strongest brands. At the same time, they conducted due diligence on a large potential acquisition so the company could be purchased quickly once the pharma sale closed. To affirm its confidence in the company’s outlook, one of the funds agreed to reinvest in a substantial minority stake alongside the new owners. These efforts helped attract a buyer and secure a multiple that was higher than that of most publicly traded peers. Identifying a good strategic fit with a potential buyer can also help GPs increase the chances of selling portfolio companies at a price that meets their return target. Take the case of an Asia-Pacific-focused PE fund that was looking to sell a manufacturer of clothing materials with a wide footprint across Asia following a period of strong growth. Several investors expressed interest in the portfolio company, but the fund realized the strongest strategic fit was a European corporate buyer with a similar but mostly non-overlapping portfolio of products. The buyer identified more than $5 million in synergies and outbid the competition at a healthy multiple. In response to concerns about the firm’s ESG profile, the seller was able to point to a growing portfolio of eco-friendly products as well as progress on plans to become a zero-waste business. PE fund managers can also attract potential buyers by demonstrating a deal’s limited downside risk. A PE fund that owned an industrial gases company in the Asia-Pacific region achieved a successful partial exit thanks to a strategy review it initiated several months before launching a formal sales process. Its review included an assessment of business risks, which showed that although the customers’ end markets were relatively volatile, market swings were linked to price changes rather than a shift in volume. The analysis also affirmed that the sale of industrial gases was unlikely to fall significantly in any future downturn. Finally, to help the buyer correctly evaluate the investment risk, the PE fund highlighted how the industrial gas market functioned in the company’s domestic market compared with industrial gas markets in the US and European markets. Interviews with customers and industry stakeholders revealed the high barriers to entry for new suppliers and provided confidence that the company would be able to maintain its market share. The company’s strong market position helped attract interest from infrastructure funds both within the region and globally, even though these funds had not previously included the industrial gas sector in their mandate. The winning bid came from a US-based infrastructure fund, and provided the seller with a healthy multiple that met its target return. The PE fund maintained a significant stake in the firm, demonstrating its confidence in the quality of the business. The outlook for exits in 2024 in the Asia-Pacific region remains uncertain, but successful funds are not waiting for markets to bounce back. They are paving the way for sales that meet their target returns by using strategy reviews to highlight the potential value of deals to buyers. That approach can help reduce the inventory of aging assets and return cash to LPs through the coming year, even if the overall exit market remains depressed. 
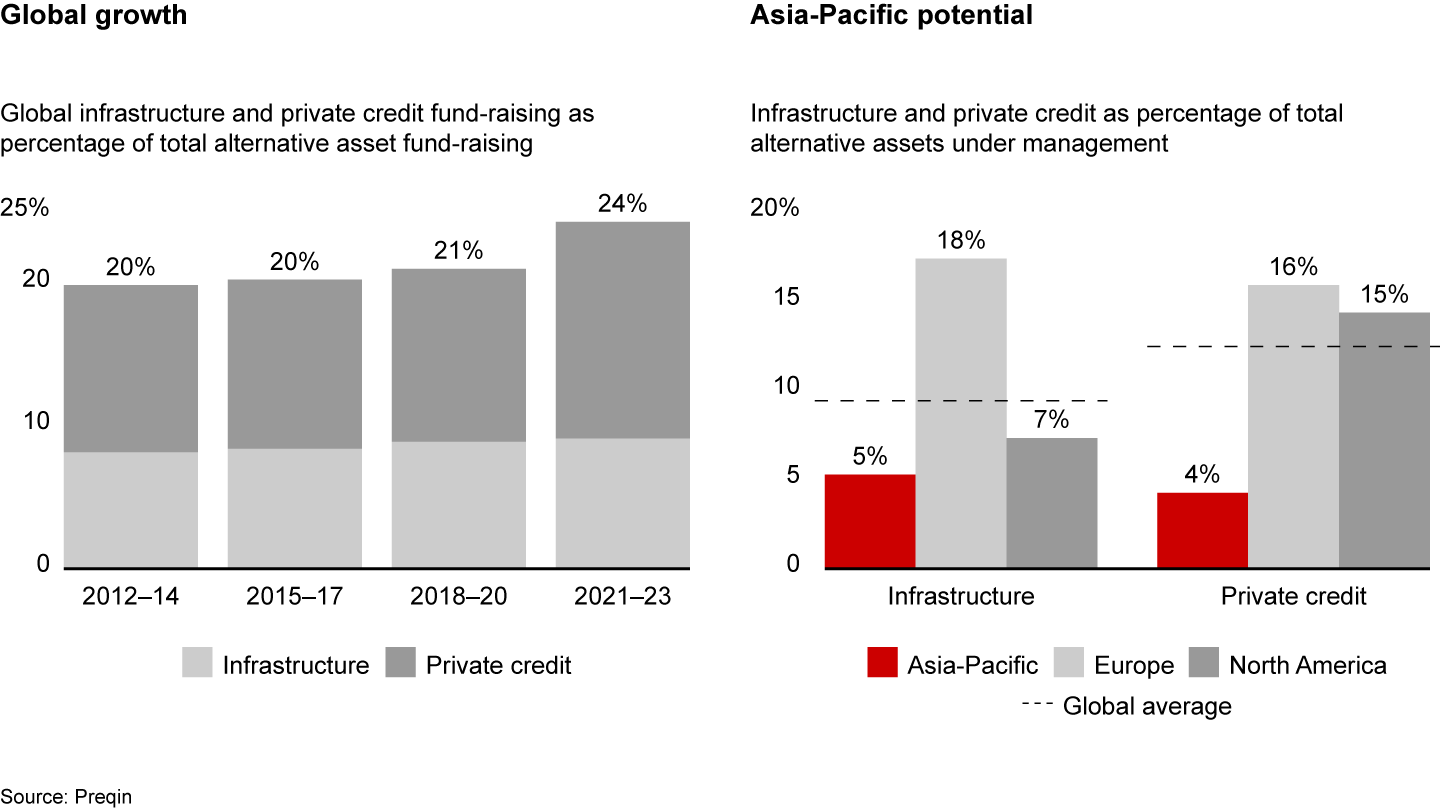
A smart approach to asset class diversificationPrivate equity firms have an incentive to grow: Most charge management fees based on total assets under management (AUM). Alternative asset classes such as infrastructure funds and private credit offer an obvious path to growth, and many PE firms have begun to expand into these sectors. Rising interest rates and government policy changes have increased the allure of private credit and infrastructure funds, and LPs are planning to allocate more capital to these asset classes (see Figure 23). For investors, the opportunity in the Asia-Pacific region is particularly attractive since infrastructure funds and private credit have been slower to develop compared with other regions (see Figure 24).
Figure 23
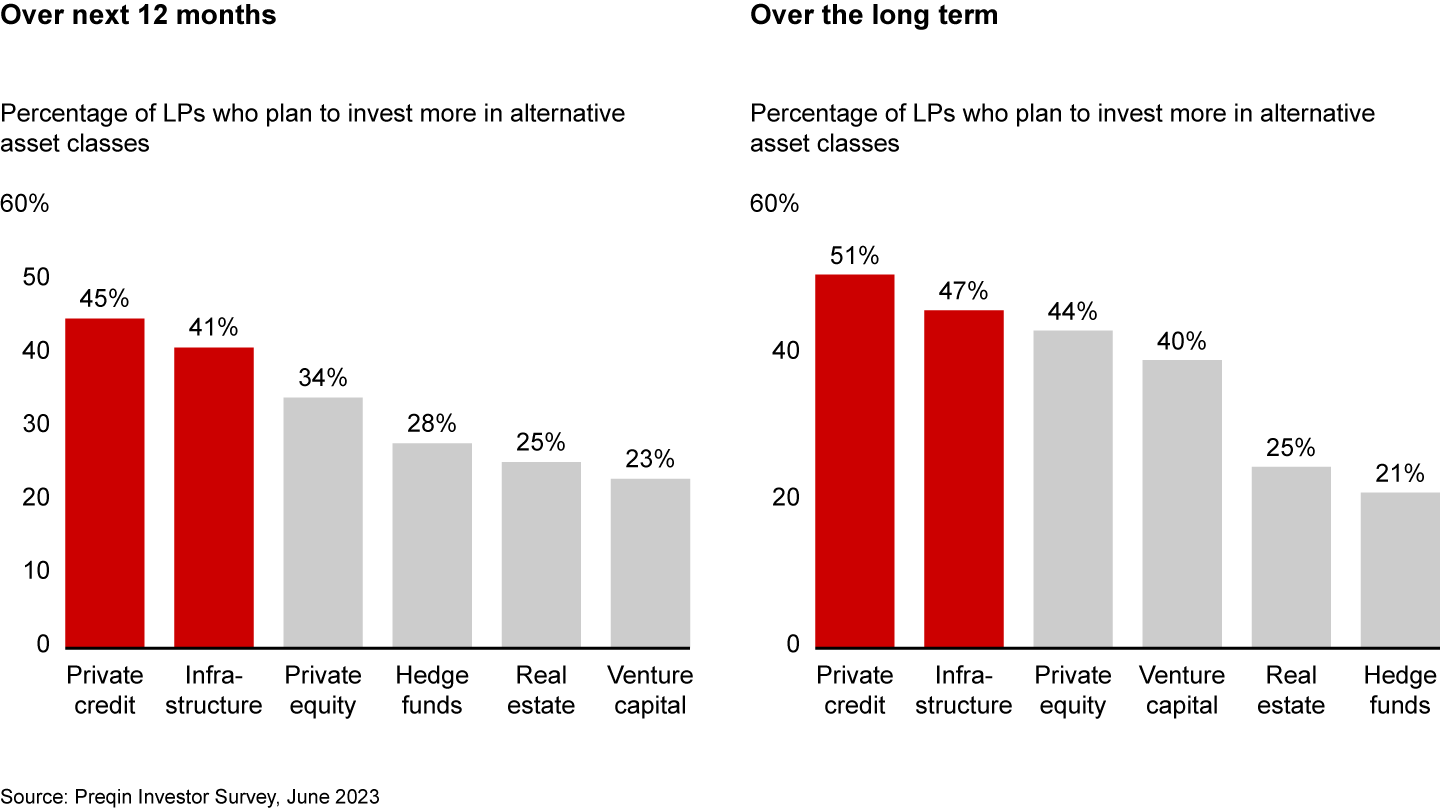

Figure 24

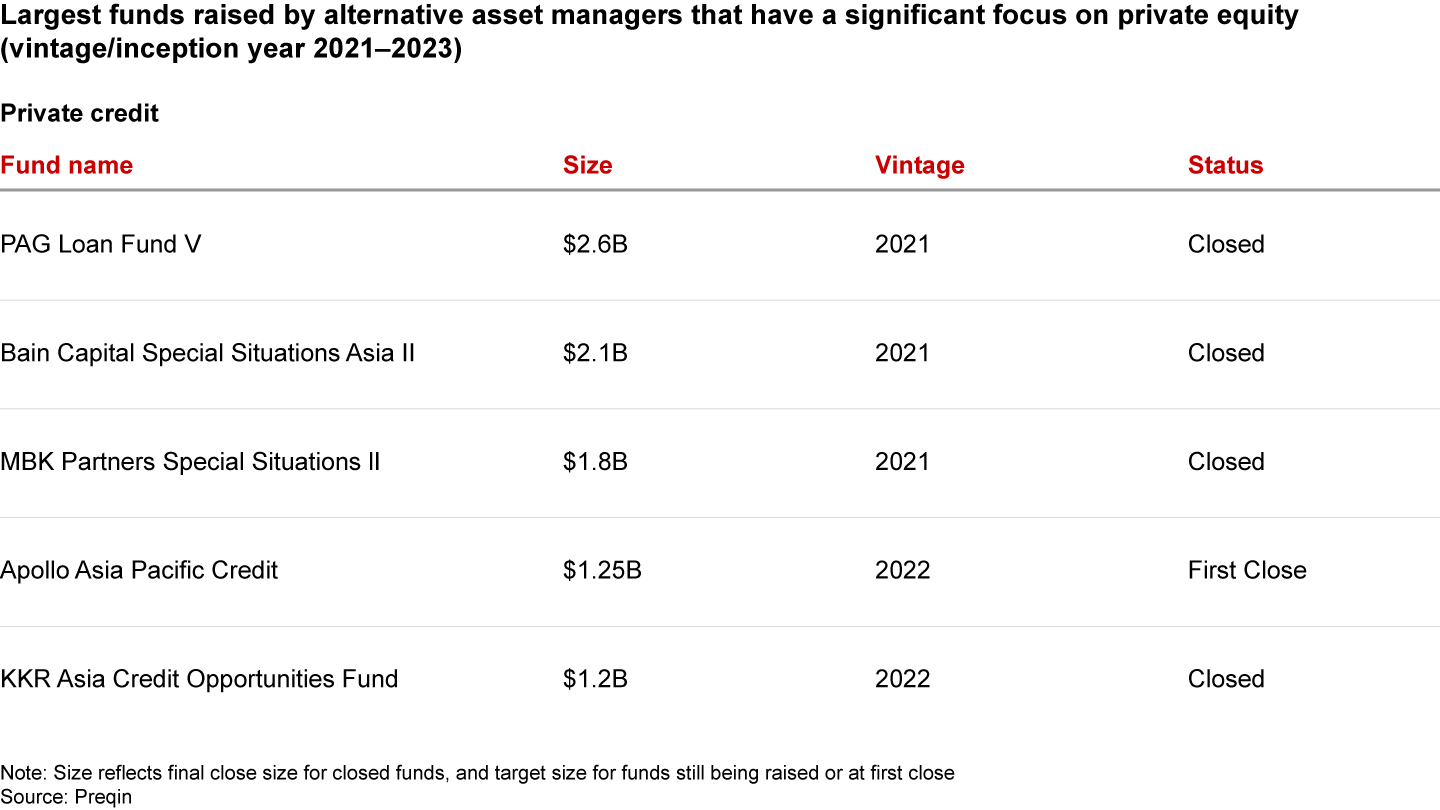
However, asset class expansion is often more difficult and riskier than many PE investors expect. Different asset classes require different capabilities from deal sourcing and structuring through exits. A Bain & Company analysis shows that over 60% of firms that pursue asset class expansion will retreat from at least one of those pursuits over time. That doesn’t mean GPs should avoid asset class diversification. But smart fund managers proceed with caution. In our experience, funds that move successfully into adjacent areas do the hard work in advance to make sure the asset class is as attractive as it seems. They also ensure that they have the talent, resources, and commitment to take on a new business. The best funds understand that they can only grow AUM sustainably by outperforming competitors in the asset classes they choose to enter. Private credit and infrastructureMany large alternative asset managers, such as KKR and Bain Capital, that once focused primarily on PE have already expanded into alternative asset classes, raising sizable Asia-Pacific-focused funds (see Figure 25). Private credit, infrastructure funds, and special situation funds (which seek to invest in companies that are undervalued due to special situations such as financial distress or restructuring) represent a growing share of alternative asset funds raised in the Asia-Pacific region. And leaders see additional room to expand in these asset classes.
Figure 25
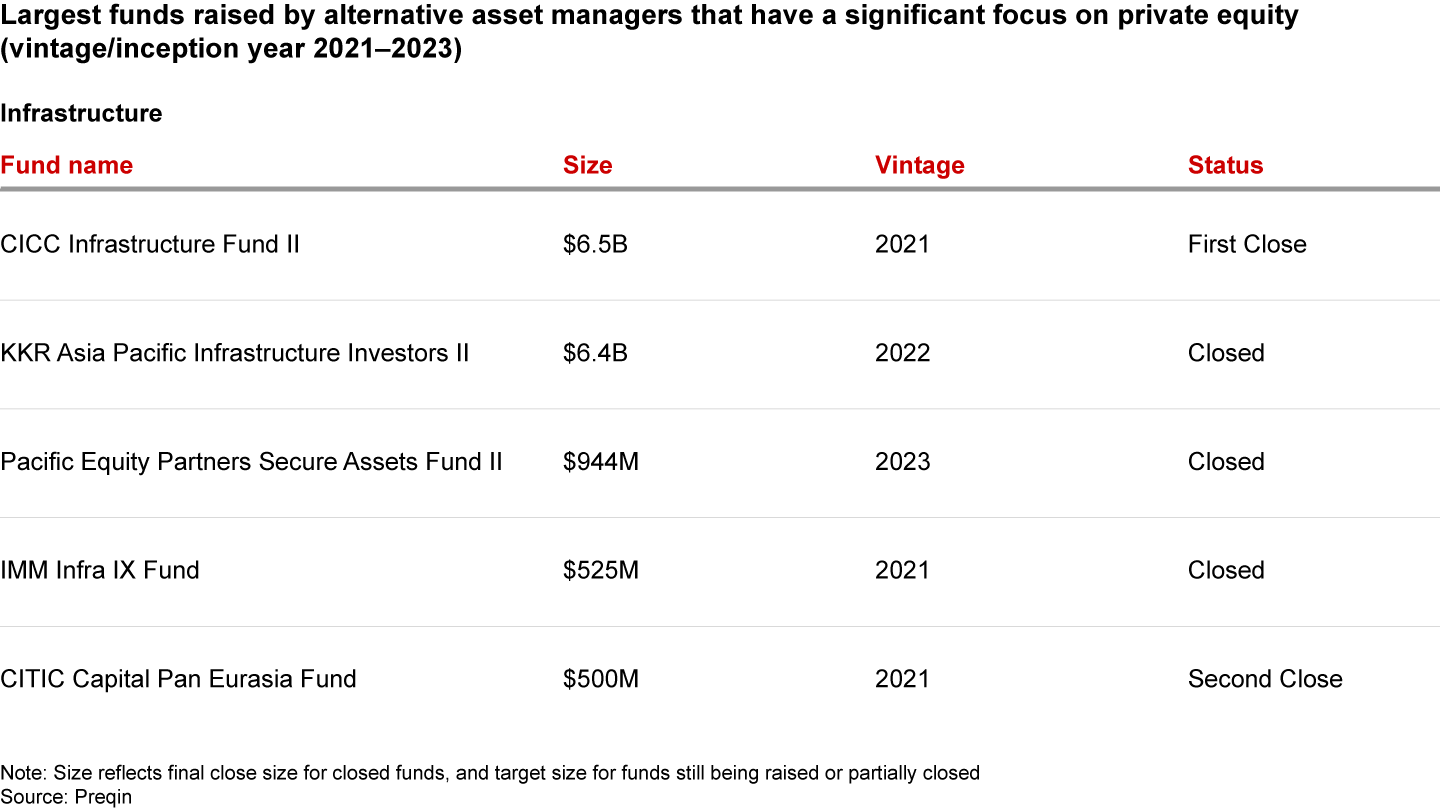

Figure 25

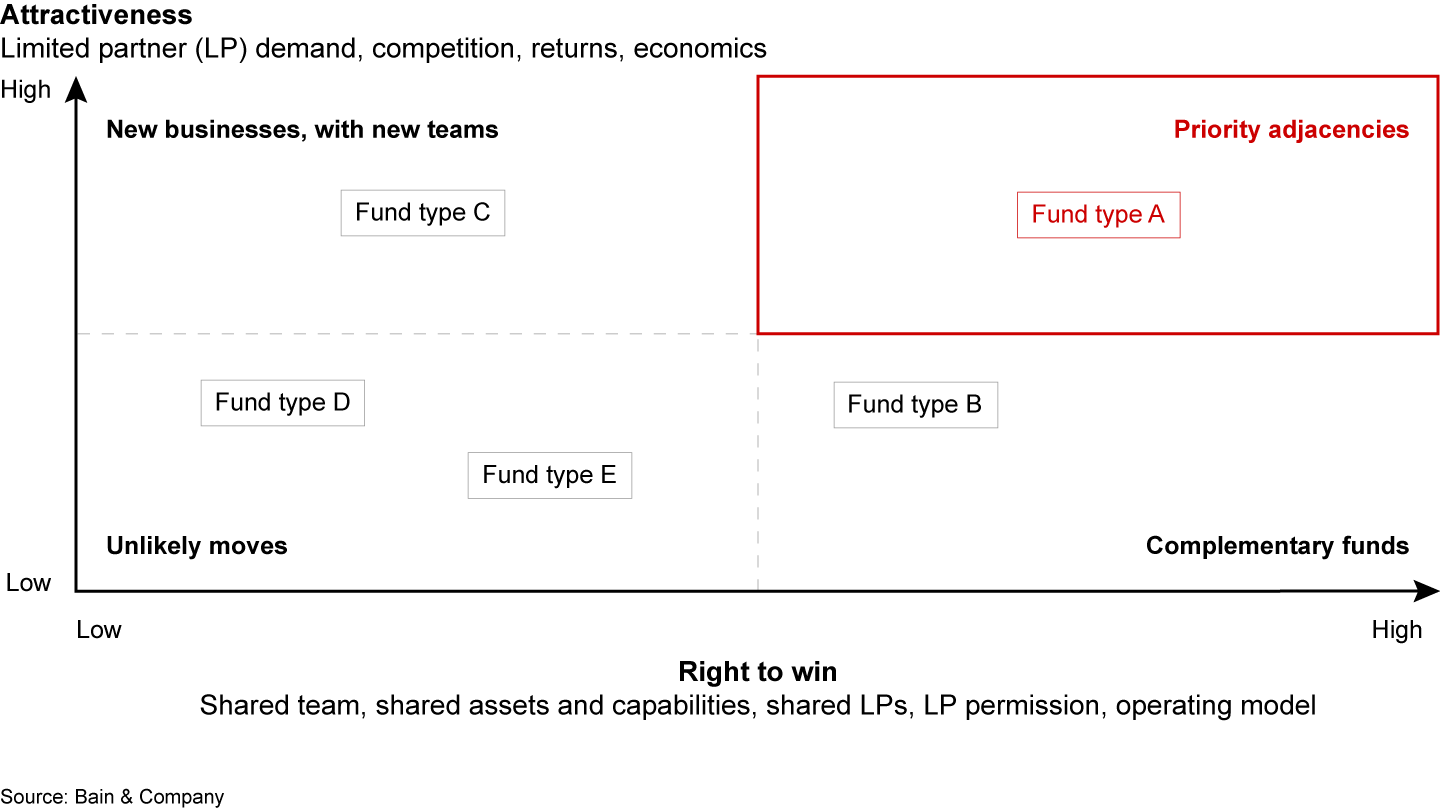
Higher interest rates have increased the appeal of private credit investments, while government funding and regulation have supported the growth of infrastructure funds. Both asset classes have historically provided attractive returns—not as high as private equity but with a lower level of risk and less variability between funds. The Asia-Pacific private credit market, though still nascent at $115 billion in 2022, has grown at 24% per annum in the past five years. Private credit now represents 4% of total alternative assets under management in the Asia-Pacific region vs. 16% in Europe and 15% in the US. The private credit sector holds significant growth potential because banks are reluctant to lend to mid-market companies or businesses that are more complicated to evaluate, including those that lack traditional assets or have atypical free cash flow. As a result, many companies face a serious funding gap. However, PE fund managers need to take their time evaluating these opportunities. Asia-Pacific markets have different regulations, and competitive landscapes. For example, bankruptcy laws in Japan, Korea, and Singapore are more in line with international best practices, while those in some other Asia-Pacific markets are comparatively less rigorous and sophisticated. In Asia-Pacific countries with less developed financial markets, private credit funds focus primarily on direct lending. These markets are not yet mature enough for sophisticated strategies such as distressed debt and hybrid debt. Infrastructure accounts for only 5% of alternative assets under management in the Asia-Pacific region, despite having an average annual growth rate of 20% from 2012 to 2022. Several factors are fueling infrastructure investing in the Asia-Pacific region, including government and policy initiatives such as China’s Belt and Road Initiative, carbon neutral commitments, the energy transition, and plans to increase competition in sectors dominated by oligopolies, such as utilities. Upgrades to financial infrastructure, telecommunications, and IT connectivity are also boosting infrastructure spending. Finally, increasing urban density, especially in developing markets, and population movements are prompting the redesign and extension of existing infrastructure, including transportation, utilities, and healthcare facilities. In recent years, infrastructure investing has expanded to include value-added sectors such as transport and logistics services, facility management, and healthcare, which are closer to private equity investments but with infrastructure characteristics of predictable free cash flow and high barriers to entry. Given their lower target returns, infrastructure funds are often able to outbid PE funds in these sectors. For PE-focused GPs, expanding asset classes not only provides a strategic path to growth, but opens opportunities that would not otherwise be available within the investment mandates of their PE funds. For example, some infrastructure deals may be fundamentally attractive with limited downside, but a higher cost of capital makes it difficult for a PE fund to bid competitively. Infrastructure funds are more likely to be able to submit winning bids, given their target returns and risk profile. This is increasingly important as infrastructure funds start to expand the scope of their investments. Having both PE and private credit funds under the same manager can also provide a competitive edge. When Bain Capital faced strong bidding competition for Virgin Australia during the pandemic, it was able to put together a deal with investments from both its private equity and credit funds. Without access to both vehicles, it may have been impossible to structure such a large investment. Aim to outperformIn our experience, successful asset class expansion starts with two questions. First, is the asset class as attractive as it seems given the likely returns, fee economics, and competition? Second, does the fund have a strong competitive position or “right to win” based on its talent, capabilities, operating model, and support from existing LPs (see Figure 26)?
Figure 26

These questions help frame several practical considerations for investing. For instance, each asset class requires a distinct set of relationships, and the basis of competition varies widely from one asset class to another. PE-focused GPs that have successfully expanded into other asset classes usually start by staying close to their core business. They target attractive niches where they can leverage their existing strengths and, if necessary, build new capabilities. But maintaining a long-term competitive edge in some asset classes requires enormous scale. Take the example of KKR, which launched a strategy in 2019 to move into new asset classes in the Asia-Pacific region based on its relative strengths. As the fund prepared to launch its $3.9 billion Asia-Pacific-focused infrastructure fund, it also moved quickly to fill capability gaps in infrastructure fund management, target attractive geographies and sectors, and use its relationships to access attractive deals. KKR aimed first at a limited number of geographies and sectors for infrastructure investments, judging India, Japan, the Philippines, and Korea as the most attractive markets. In those countries, it focused on a few core sectors such as renewable energy in India, and more value-added sectors such as waste management in Korea. To source initial investments, the management team tapped its existing network of local relationships, which allowed it to complete the first six deals without entering traditional auction processes. Over time, the fund looked at a broader set of opportunities, including deals in markets such as Greater China and Australia–New Zealand. Having deployed capital for infrastructure deals quickly, KKR has since been able to raise a second, larger infrastructure fund. Pacific Equity Partners’ (PEP’s) expansion in 2018 into infrastructure through its Secure Assets Fund represents a different approach. As a successful PE investor focused solely on the Australia and New Zealand markets, PEP targeted the same geographic area for its infrastructure fund and looked to invest in niche areas where it could rely on its existing capabilities instead of hiring new talent. PEP focused on its ability to work with management teams to improve operational performance. Since global and local infrastructure funds were mostly competing for larger deals, PEP targeted an attractive niche—mid-market companies in the value-added segments of the infrastructure spectrum. And because its LPs were looking for sizable coinvestment opportunities, PEP aimed to raise a $750 million fund, less than half that of its previous PE fund. That target size was large enough for six to eight deals and offered LPs sufficient room to coinvest. Having secured in 2022 a successful partial exit from its maiden infrastructure investment, Intellihub, with an IRR of 83%, PEP was able to close a second, larger infrastructure fund in 2023, with a remit to invest in a broader array of infrastructure sub-sectors, including logistics, waste management, and digital infrastructure. Many Asia-Pacific PE investors are keen to tap the growth opportunity offered by infrastructure, private credit, and other alternative asset classes. Those that succeed understand the risks and pressure test the investment economics for new markets across the complex Asia-Pacific region. Before charging ahead, these winners do the hard work to ensure they have a competitive edge to outperform. |