Brief

Executive Summary
- While China’s GDP growth slowed, spending on fast-moving consumer goods continued to grow steadily, rising in overall value by 5.7% in the third quarter of 2019.
- As urban consumers’ incomes rise, they pursue products they view as improving their health and lifestyle, while shunning those they consider unhealthy—continuing the two-speed growth trend for different product categories.
- Imports now account for 18% of all FMCG sales and consistently outpace category growth.
What slowdown?
In the third quarter of 2019, China’s GDP growth rate dipped to 6.0%, the lowest level in 27 years, but you couldn’t tell that from the activity in the shampoo, fabric softener or pet food aisles. Amid the slowing economy, China’s consumers still have a growing appetite for fast-moving consumer goods (FMCG). In the first three quarters of 2019, total FMCG sales rose by 2.7%, 6.9% and 5.7%, maintaining the same pace as 2018. But as we’ve seen in previous years, that stable growth follows a regular pattern, with the “macro” product categories accelerating at two distinct speeds: fast and slow. Personal care and home care categories maintained their high speed, growing by 11.8% in the third quarter of 2019, the strongest performance in three years. Food and beverage categories grew at the relatively slow rate of 2.3% (see Figure 1).
Growth is stable for overall FMCGs, fast for personal and home care, and slow for food and beverage

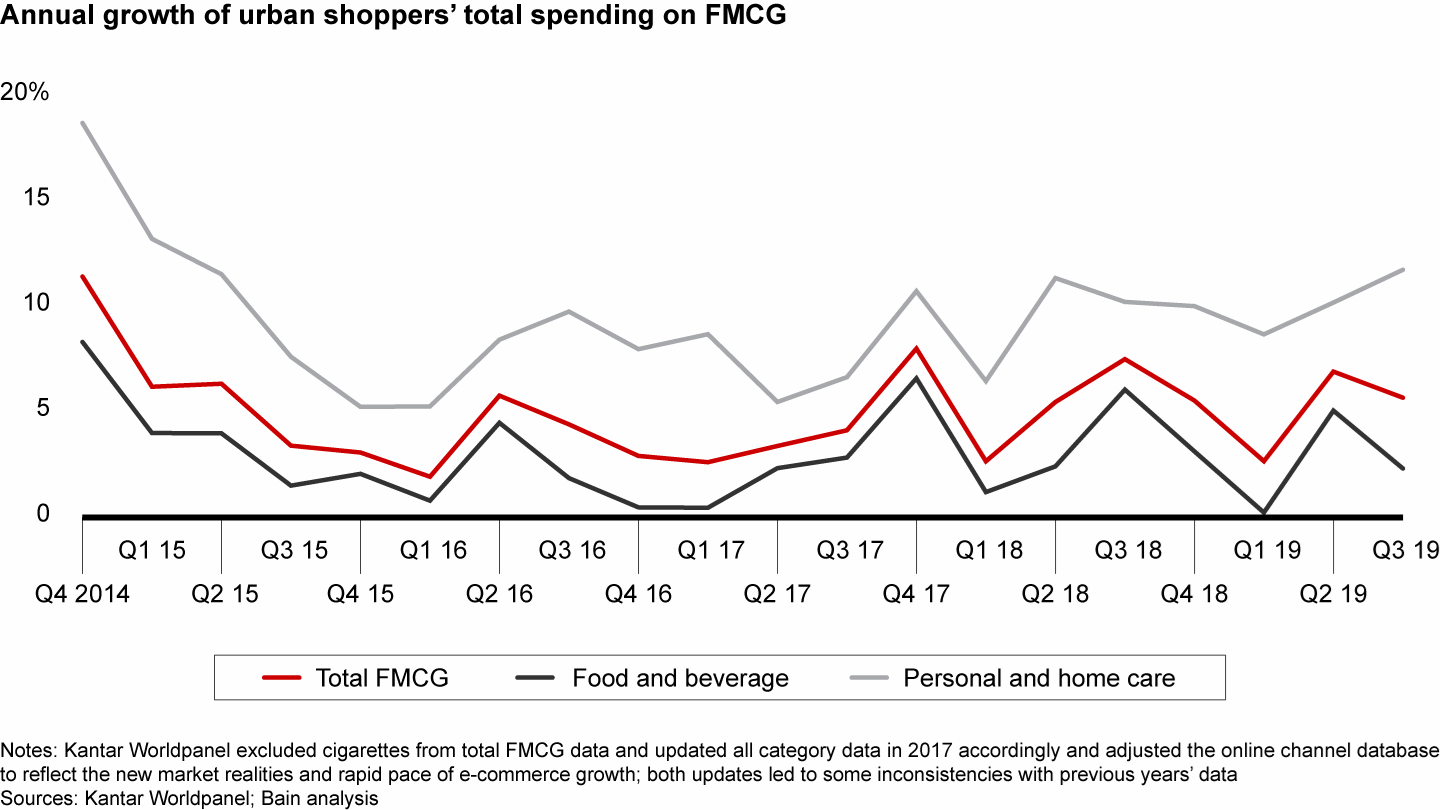
As in each of the past seven years, we studied 106 FMCG categories purchased for home consumption in China, thoroughly analyzing the key 26 categories that span the four largest consumer goods macrocategories: packaged food, beverages, personal care and home care.1 Combined, these sectors represent 80% of China’s FMCG purchases. Each year, Kantar adds new categories to its analysis to accommodate changing consumer purchasing trends. This report, which updates the findings from China Shopper Report 2019, Vol. 1, Premium Products, Small Brands and New Retail, includes Kantar Worldpanel shopper behavior data for the first three quarters of 2019.
Written in collaboration with
Written in collaboration with

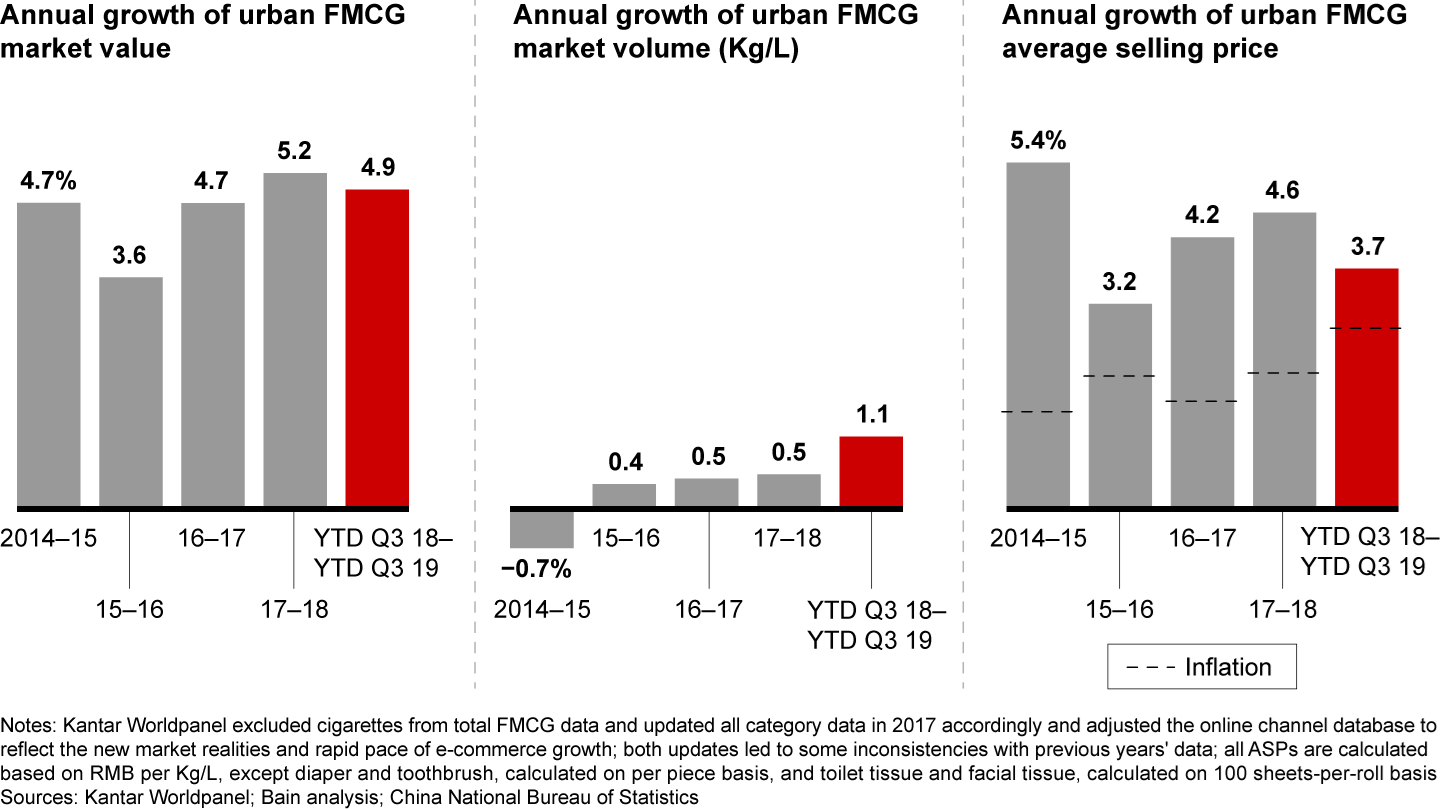
Overall, FMCG value grew 4.9% in the first three quarters of 2019, not far from the 5.2% achieved in 2018, as rising volume growth could not offset slower growth in average selling prices. FMCG volume growth in the first three quarters of 2019 more than doubled from the rate of those quarters in 2018, but growth in average selling prices dropped from 4.6% to 3.7%, only slightly above the inflation rate (see Figure 2).
Overall, FMCG value growth was slightly lower due to rising volume growth but a slower rate of average selling price growth

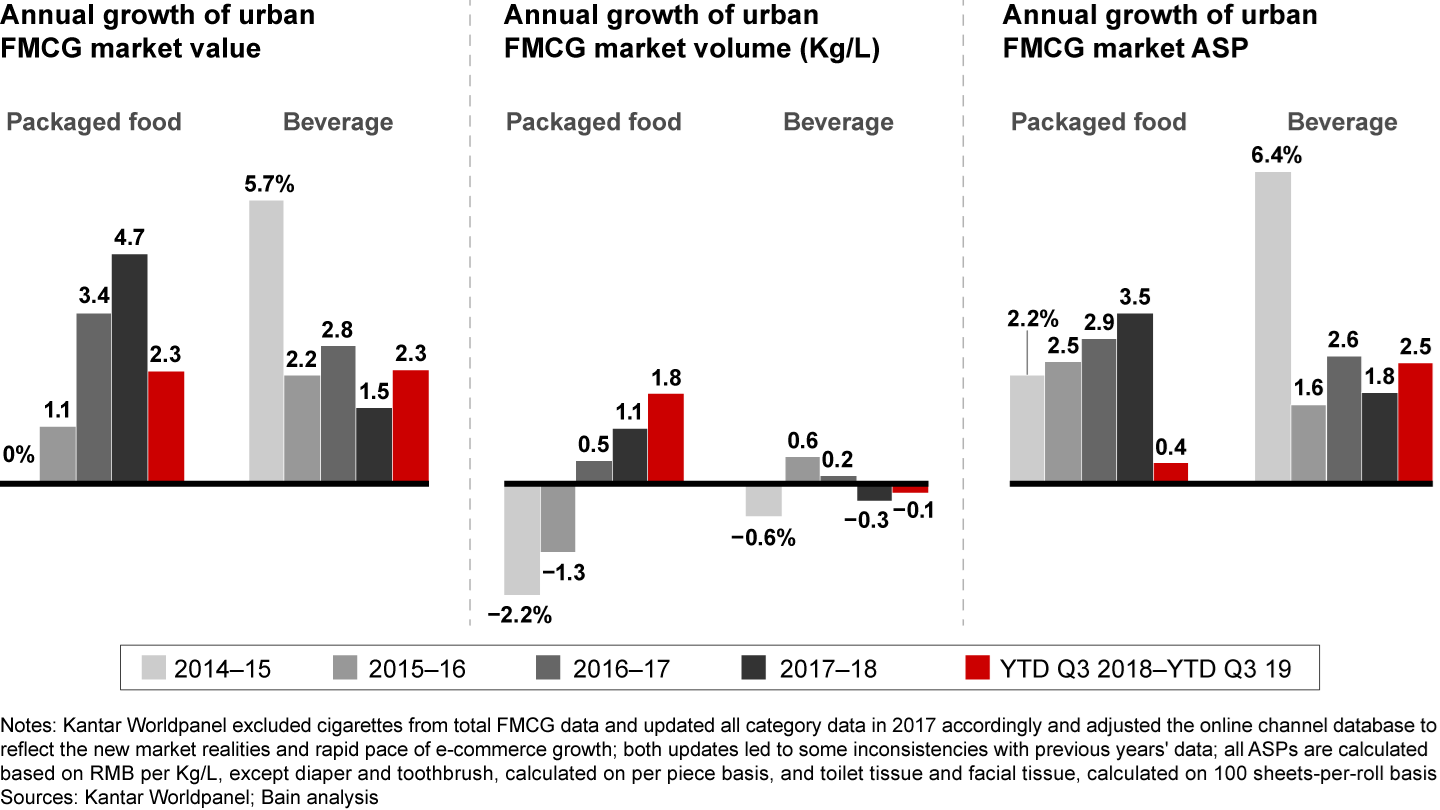
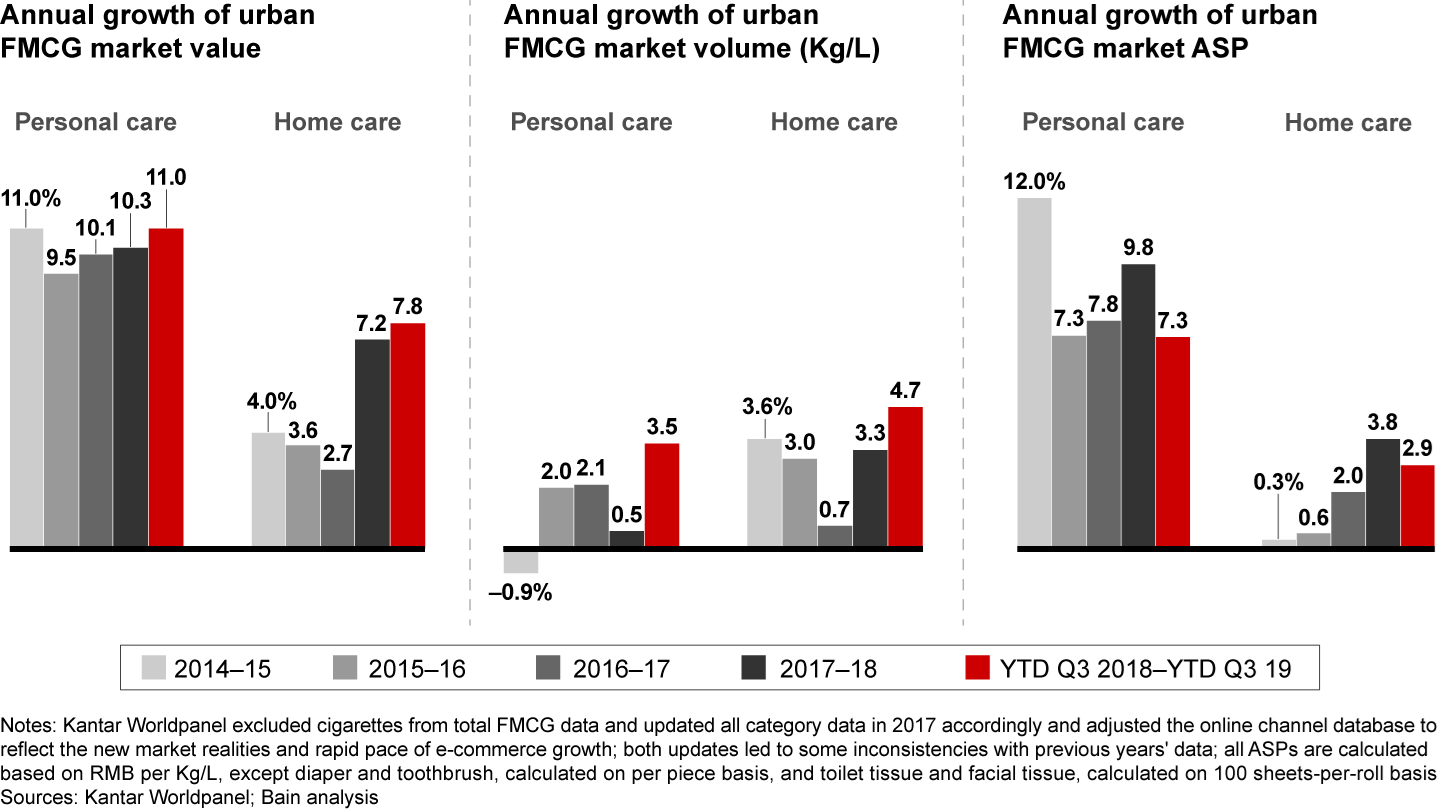
Both the packaged food and beverage categories grew 2.3% in value, but the contributors to that growth were different. Volume grew for packaged food categories, but sluggish growth in average selling prices led to only 2.3% value growth—a drop from 4.7% in 2018. In beverages, rising prices helped compensate for a slight decline in volume growth to boost value growth (see Figure 3). Differing factors also were at play in the performance of personal care and home care, the two other macrocategories. Personal care value grew 11% in the first three quarters of 2019 from a year earlier, getting a lift from a 7.3% increase in average selling prices (see Figure 4). Home care value gained 7.8% over the period, helped by volume growth of 4.7%; it was the macrocategory that had the fastest volume growth.
Slower growth in average selling prices led to slower value growth for packaged foods, but rising prices lifted value growth for beverages

Average selling prices contributed to the gains in personal care, while volume growth boosted growth in home care

Two-speed growth endures
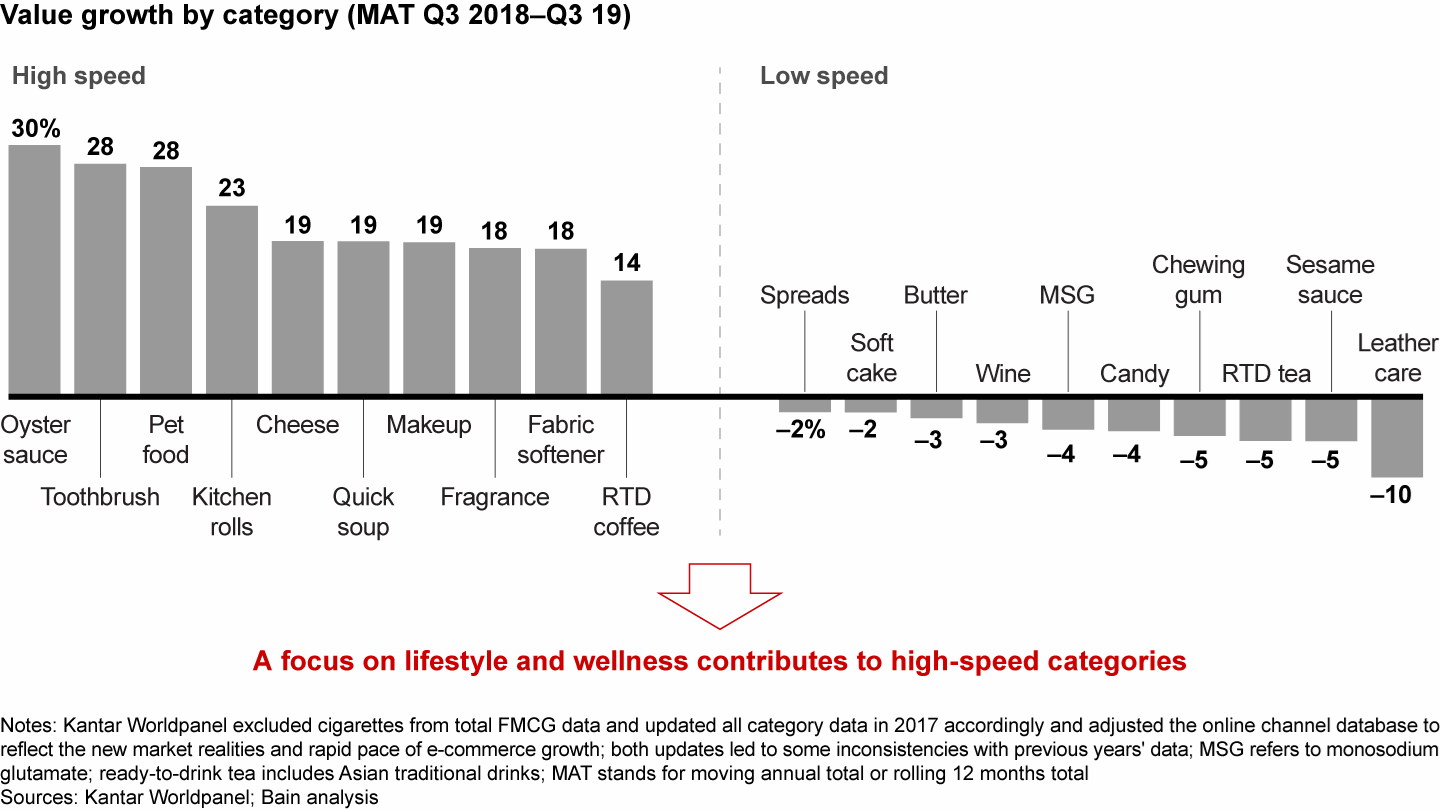
As urban Chinese consumers’ incomes rise, so does their pursuit of better health and a better quality of life. Indeed, product categories associated with healthier lifestyles grew fast, while those perceived as being unhealthy saw declines over the 12 months to September 2019 (see Figure 5). This trend has been steadily picking up steam each year. Consumers view oyster sauce as a healthier alternative to MSG. As a result, oyster sauce value has grown by 30% this year, the highest rate of any category, while MSG value declined by 4%. Stronger distribution is expanding oyster sauce from the North and South into inland provinces, and manufacturers are educating consumers through promotions and packaging about new uses for oyster sauce. The toothbrush category rose by 28% in value, and cheese (associated with the Western lifestyle) increased by 19%. Children’s cheese snacks represent more than half of the category’s sales; even as kids snacks gain traction, brands are innovating cheese snacks for adults. Meanwhile, categories viewed as unhealthy—soft cake, butter, candy and chewing gum, for example—all experienced declining value.
The value of product categories associated with healthier lifestyles grew at high speed, while those perceived as being unhealthy declined

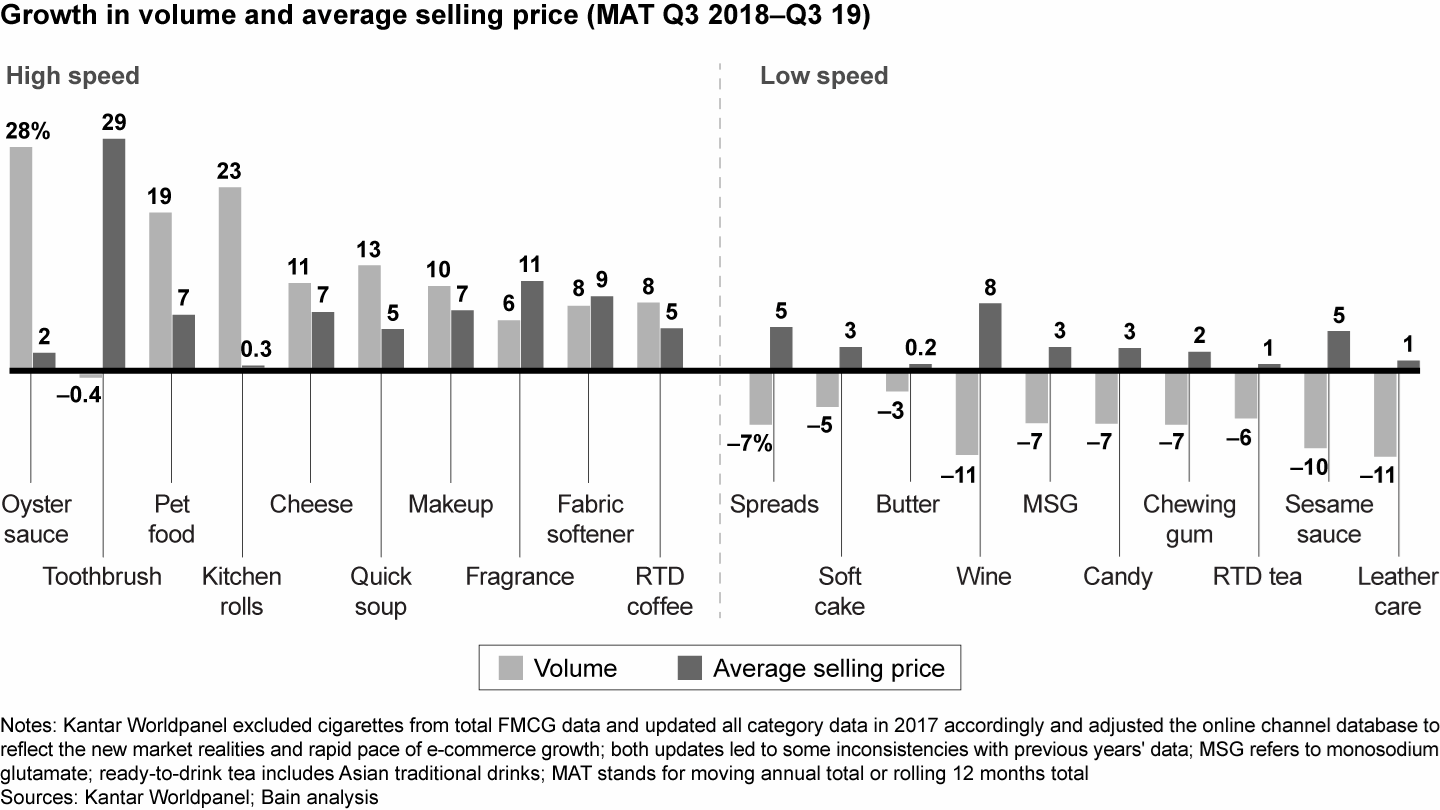
Evaluating the overall FMCG market, it would appear that increases in average selling price would play the biggest role in growing value. However, when you analyze it on a category-by-category basis, a different picture emerges: It’s all about the volume. The fastest-growing categories, such as pet food and kitchen rolls, are overperforming in volume growth, while low-speed categories such as wine and leather care are underperforming in volume (see Figure 6).
Volume growth explains why some categories are growing quickly and others slowly

Import fever
Participants attending the massive second annual China International Import Expo (CIIE) in Shanghai in early November saw thousands of products that were making their first appearance on Chinese soil. Representatives from more than 3,000 companies from 150 countries attended, hoping to interest Chinese buyers in their products. Unilever brought more than 25 brands to the show, everything from Zendium toothpaste to The Good Stuff shampoo. AmorePacific had no fewer than 400 SKUs on display, including such newly launched products as its 3-D printing mask from IOPE. L’Oreal brought 1,000 SKUs—the company has made China a priority market, introducing new SKUs at a rate of nearly one a day and more than trebling its revenues in the country over the past eight years.
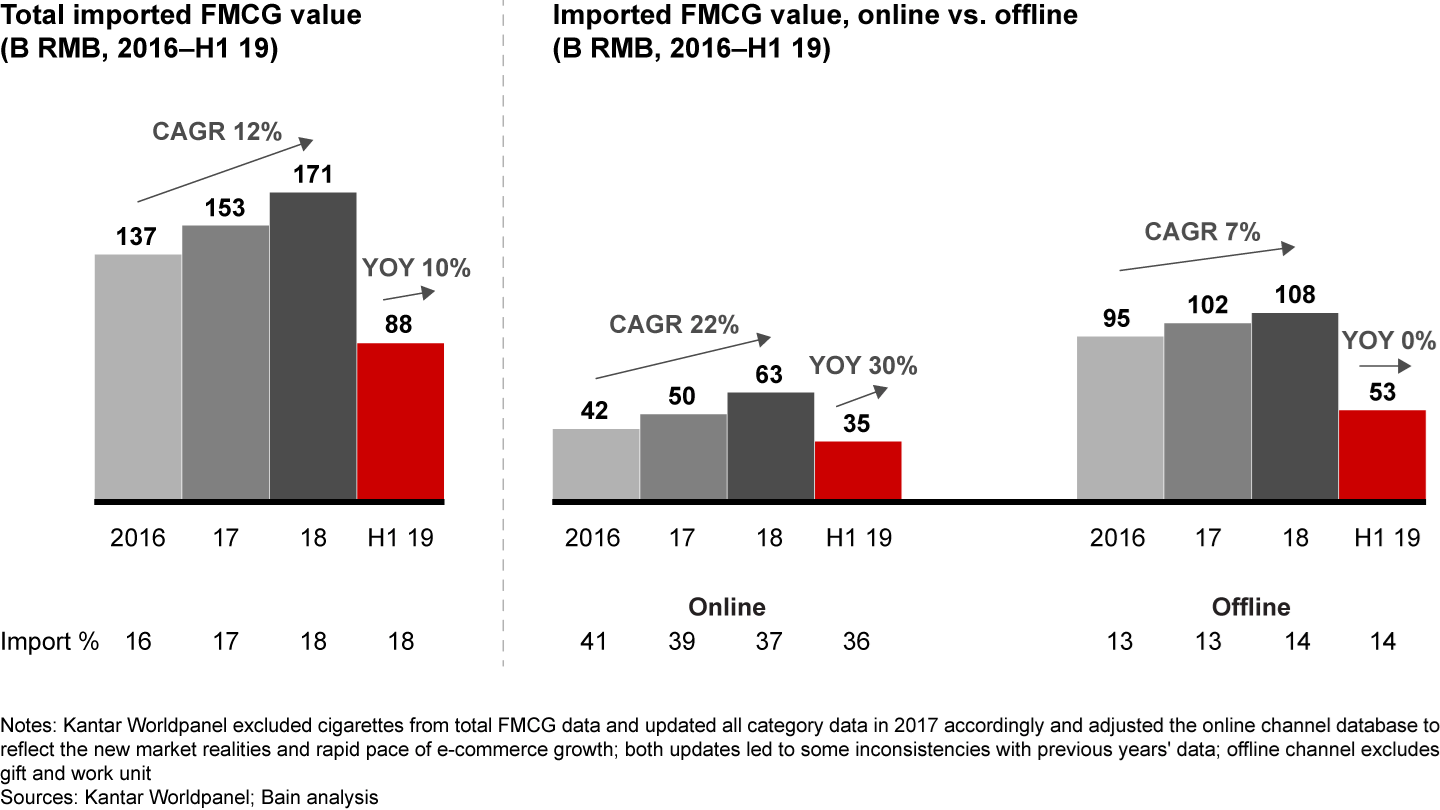
Even as homegrown products dominate their categories in China, consumers have an enduring desire for imports, especially in product categories where they can satisfy their aspirations for a more diversified lifestyle and quality of life. In the first six months of 2019, imports represented 18% of China’s total FMCG consumption and grew 10%, close to twice the rate of overall FMCG growth (see Figure 7). This was driven mostly by the online channels: Online sales of imports jumped by 30% in the first half of 2019, with imports accounting for 35% of all online sales in China.
Imports now represent 18% of China’s total FMCG consumption, with online sales of imported goods growing by 30%

By concentrating on selling online, foreign FMCG companies gain traction in China without having to build a complex physical route-to-market model. In 2017, Spanish cosmeceutical brand Sesderma opened its first Tmall International Store. Within one year, sales exceeded RMB 100 million. In 2018, three Italian cosmetics brands—KIKO, Diego dalla Palma Milano and RVB LAB—entered China via cross-border e-commerce on Tmall International. Rihanna’s beauty brand Fenty Beauty, backed by LVMH Group, made a high-profile Chinese launch in July, using the group’s digital marketing resources on Weibo, WeChat and Little Red Book. The large Chinese digital platforms are eager to support foreign brands as they enter China.
An important finding is that while the impact of global trade tensions has been felt in such areas as commodities and heavy machines, it has not put a dent in Chinese consumers’ desire for imported goods from the US and elsewhere. Sales of American makeup in the 12 months ending in the second quarter of 2019 rose 54% from the same period in 2018, for example. And Chinese consumers are expanding the number of countries from which they buy. Toothpaste sales from the Netherlands more than doubled in that time frame. Sales of nutritional supplements from South Korea increased by 35%, while those from Thailand rose 29%. The value of biscuits from Singapore and Indonesia grew by 22% and 17%, respectively. More than half of all imported milk powder in China was purchased from two countries: New Zealand and the Netherlands.
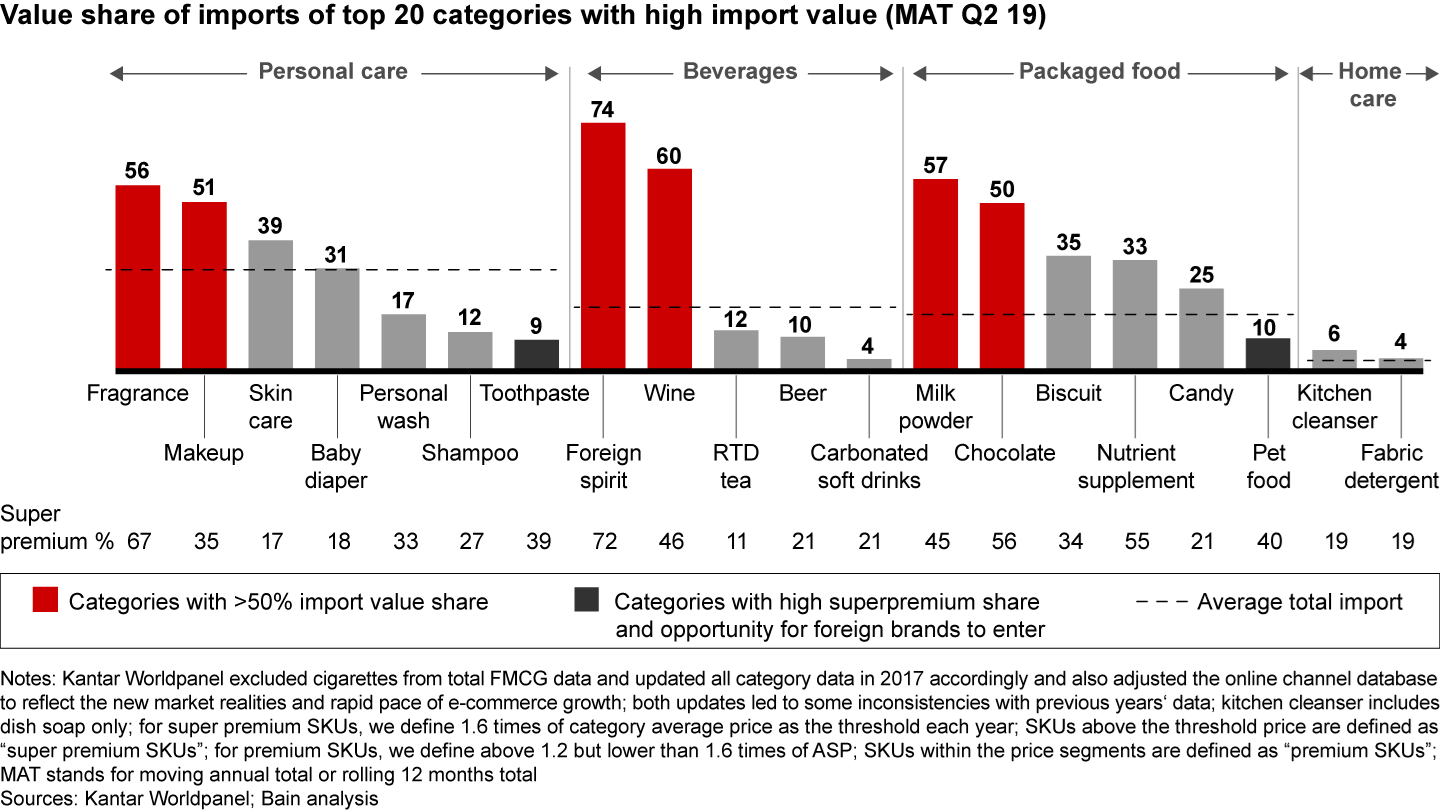
Imports account for a particularly high share of value in premium categories and categories with a higher percentage of premium brands. To see the direct correlation between import value share and premiumness, compare chocolates and biscuits. Imports represent half of the total category value in chocolates (see Figure 8). In that category, fully 56% of the products are in the superpremium segment. In the biscuit category, 35% of the value is generated by imports, and only 34% of biscuit products are superpremium. The more premium the category, the bigger the margin that brands typically have available to compensate for the costs of importing goods.
The value share of imports is highest in premium categories and categories with a higher percentage of premium brands

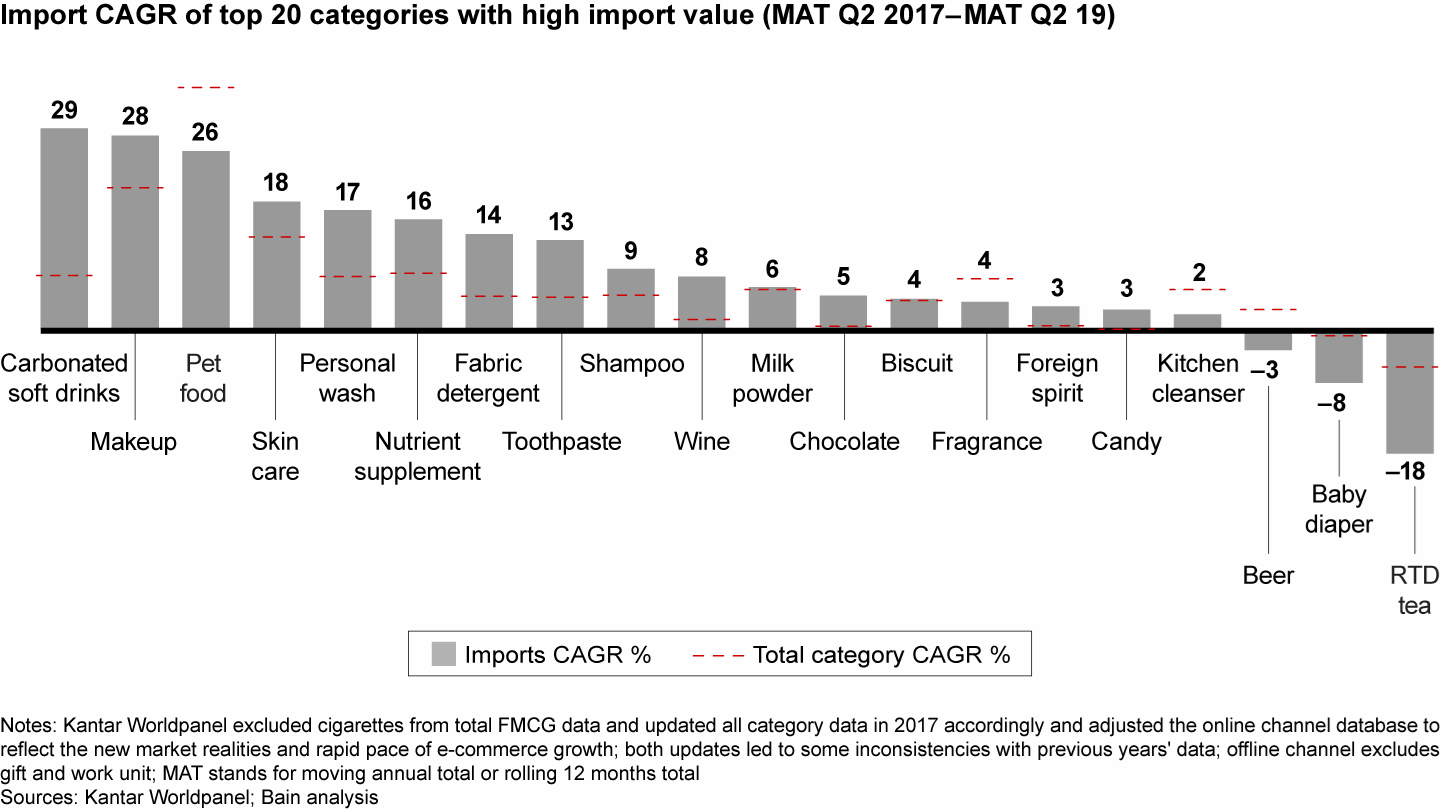
In many categories, imports consistently outpace category growth, sometimes by a wide margin (see Figure 9). Consider that imported carbonated soft drinks are growing nearly four times faster than the category average, and imported toothpaste is growing nearly three times the category average.
In fast-moving consumer goods, imports consistently outpace category growth

Implications for brands
Increasingly sophisticated Chinese consumers continue to buy imported goods in record numbers. For brands that are not yet in China—or just getting started—there is a path to success, one that is increasingly valuable given the importance of digital platforms as a channel and brand-building tool. It requires adopting the insurgent brand playbook that we described last year (see China Shopper Report 2018, Vol. 2, Local Insurgents Shake Up China’s “Two-Speed” Market).
The insurgents’ playbook is built around what we call the Founder’s Mentality®: an insurgent mission, a frontline obsession and an owner’s mindset. This presents itself in three important areas. Insurgents rely on customer-focused innovation in product, branding and assortment. They take a localized approach to route-to-market and marketing, particularly with digital platforms. And they create a nimble and Agile operating model.
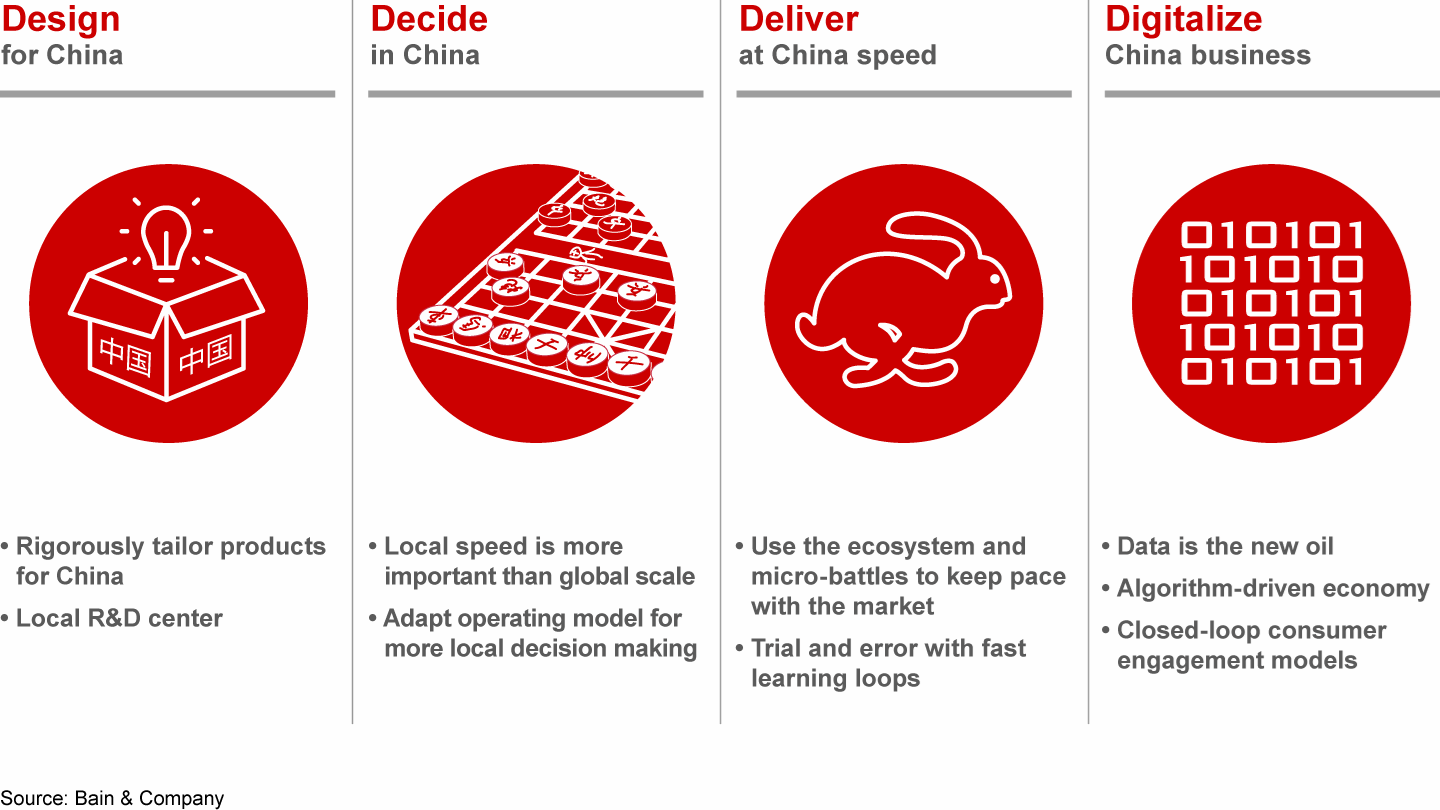
Larger brands that already have a significant presence in China—in cosmetics, infant formula, wines and spirits, for example—need to adopt a different approach, one derived from the “4D” model (see the Bain Brief “Consumer Products: Now’s the Time to Double Down on China”). This situation does not require all four elements, as brands will rarely design imports specifically for Chinese consumers (see Figure 10). However, the other 4D elements apply: They decide in China by adapting their operating model. They deliver at China speed with such methods as rapid testing, and they digitalize the China business by partnering with leading online platforms on innovation and data-driven insights, for example, and by effectively managing digital channels. This approach is gaining importance as competition intensifies from Chinese insurgents. In fact, multinationals also can boost their odds of success by taking lessons from those newly successful young companies.
China continues to be one of the biggest consumer stories in the world, and multinationals win by adopting a “4D” approach

China continues to be the biggest consumer story in the world, and growing along with those consumers means making thoughtful and aggressive moves. With so many players and so much at stake, winning here isn’t a matter of chance.
About the authors and acknowledgments
Bruno Lannes is a partner with Bain & Company’s Consumer Products practice, and is based in Shanghai. You may contact him by email at bruno.lannes@bain.com.
Derek Deng is a partner with Bain & Company’s Consumer Products practice, and is based in Shanghai. You may contact him by email at derek.deng@bain.com.
Marcy Kou is CEO of Kantar Asia’s Worldpanel division. You may contact her by email at marcy.kou@kantarworldpanel.com.
Jason Yu is managing director at Kantar Worldpanel Greater China. You may contact him by email at jason.yu@ctrchina.cn.
Acknowledgments
This report is a joint effort between Bain & Company and Kantar Worldpanel. The authors extend gratitude to all who contributed to it, especially Yanhong Ding and Lesley Li from Bain, and Tina Qin, Robin Qiao and Lorna Peng from Kantar Worldpanel.
Founder’s Mentality® is a registered trademark of Bain & Company, Inc.
Kantar Worldpanel—Inspiring Successful Decisions, a CTR service in China
Kantar Worldpanel is the global expert in shoppers’ behavior.
Through continuous monitoring, advanced analytics and tailored solutions, Kantar Worldpanel inspires successful decisions by brand owners, retailers, market analysts and government organizations globally. With more than 60 years’ experience, a team of 3,500 and services covering 60 countries directly or through partners, Kantar Worldpanel turns purchase behavior into competitive advantage in markets as diverse as FMCG, impulse products, fashion, baby, telecommunications and entertainment, among many others.
Notes
- These 26 categories are (a) packaged food: biscuits, chocolate, instant noodles, candy, chewing gum and infant formula; (b) beverages: milk, yogurt, juice, beer, ready-to-drink (RTD) tea, carbonated soft drinks (CSD) and packaged water; (c) personal care: skin care, shampoo, personal wash, toothpaste, makeup, hair conditioner, diaper and toothbrush; and (d) home care: toilet tissue, fabric detergent, facial tissue, kitchen cleanser and fabric softener.