Retail Holiday Newsletter

Executive Summary
- Bain & Company is forecasting 4.8% to 5.2% growth in US retail sales this holiday season. This is shy of last year’s 5.3% growth but significantly above the 10-year average of 2.9%.
- Our optimism stems from positive macroeconomic indicators, including historically low unemployment, rising wages and high consumer confidence.
- Growth year-to-date is another positive indicator: Foot traffic in stores is up, and e-commerce continues its aggressive upward trajectory.
- Still, we caution that this holiday season is likely a bright spot before more challenging times in 2019.
Unwrapping the forecast
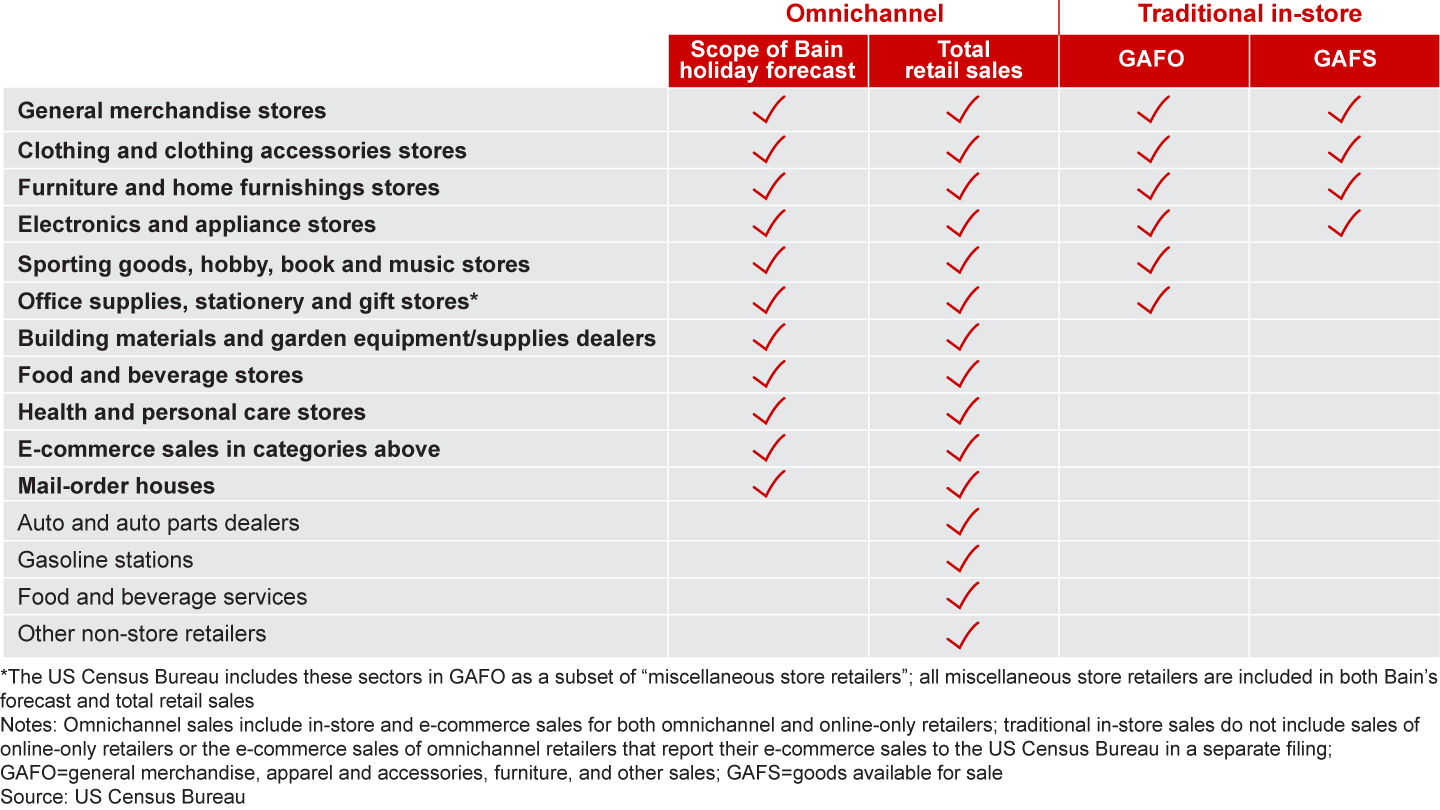
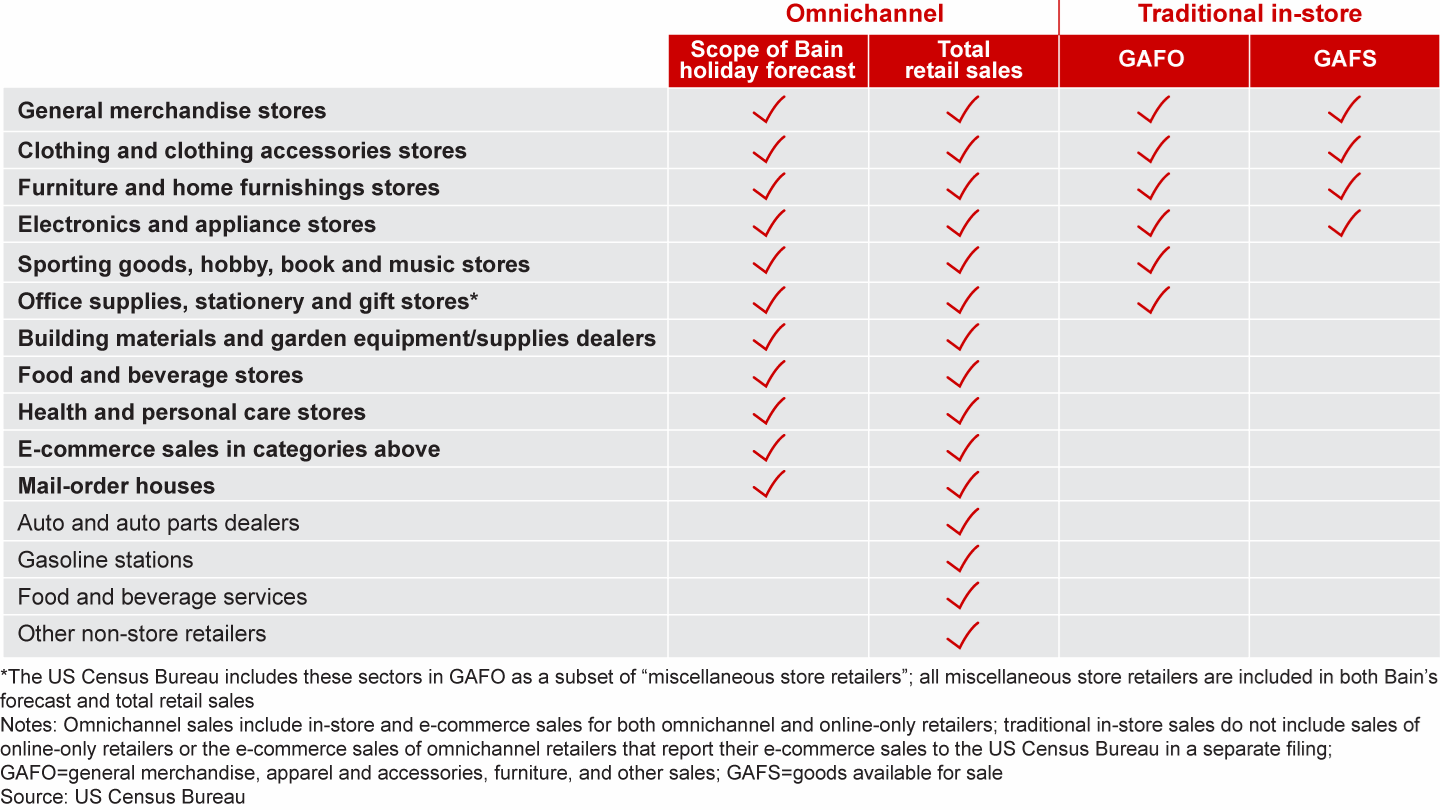
Bain expects total US retail sales to grow 4.8% to 5.2% this holiday season, shy of last year's 5.3% growth but significantly above the 10-year average of 2.9% (see Figure 1). We define holiday retail sales as in-store and nonstore (e-commerce and mail order) sales during November and December, excluding sales by auto and auto parts dealers, gas stations and restaurants (see Exhibit 1 in the Appendix).
Growth in holiday retail sales, 2001–18F
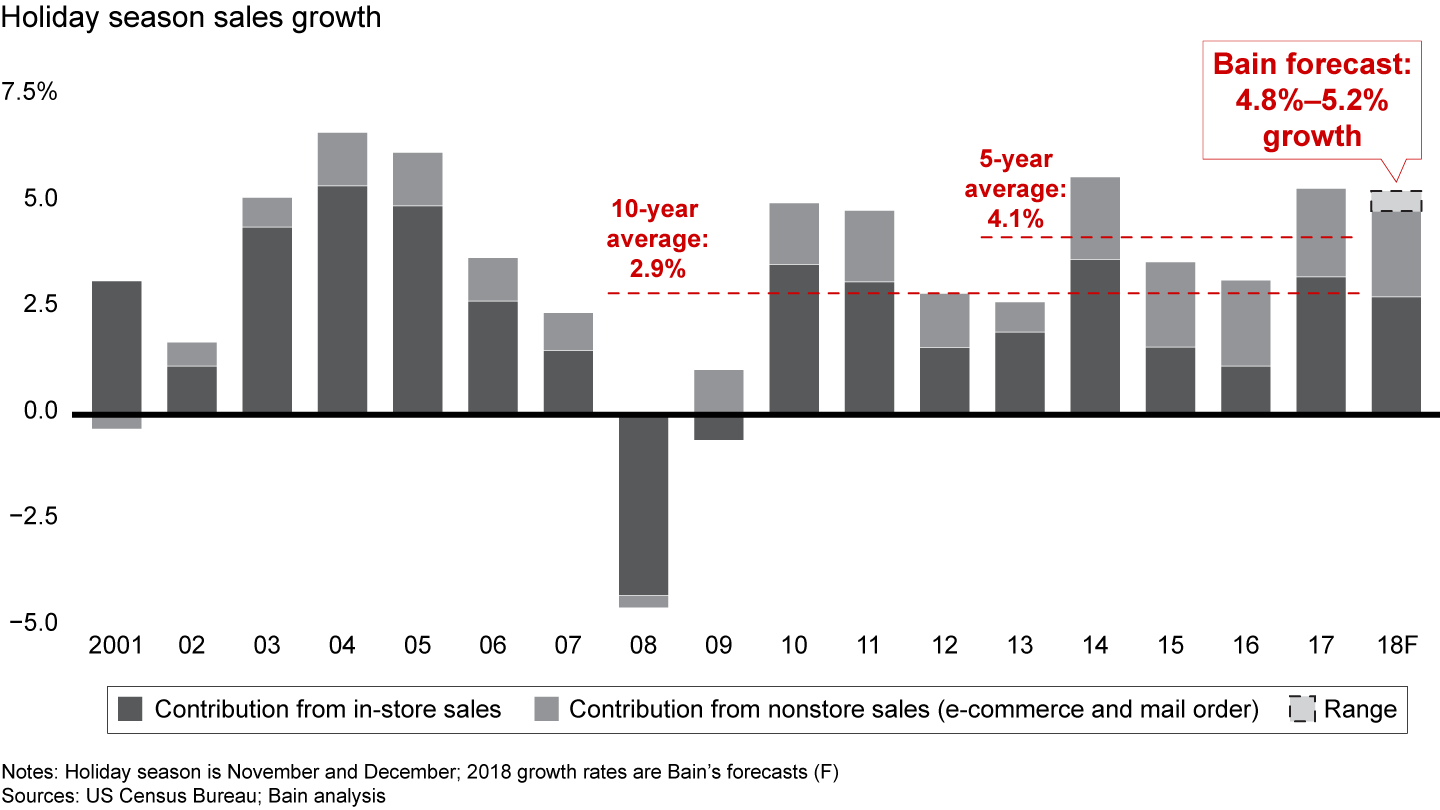
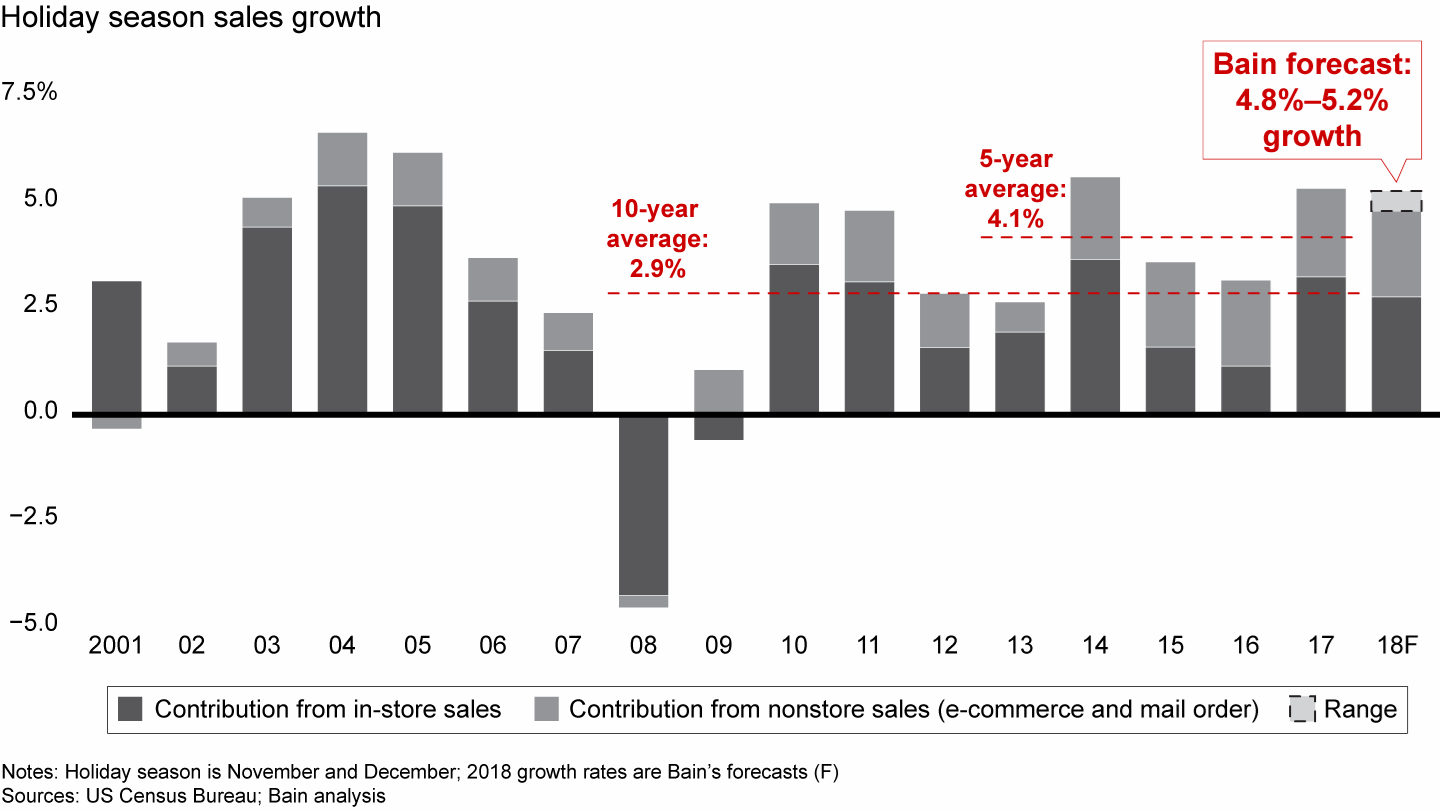
In-store sales will remain vital to the holiday season, as they represent more than 80% of total retail sales. This year stores have provided much reason for cheer: In-store sales were up 3.9% through August (vs. 2.0% growth last year). We forecast in-store holiday sales growth of 3.5% to 3.7% (vs. 4.0% last year). Though the fundamentals remain strong, last year's robust holiday growth will be difficult to top.
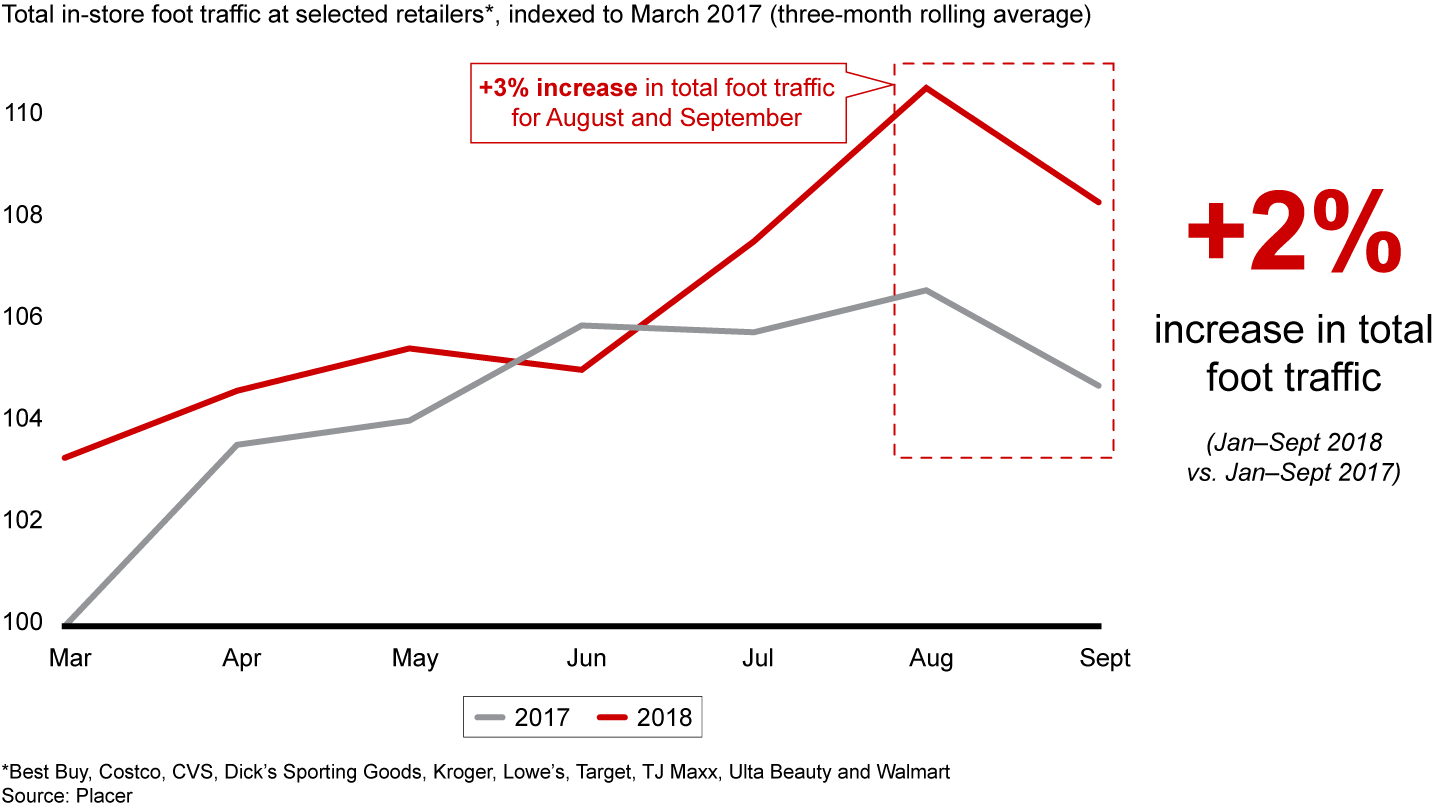
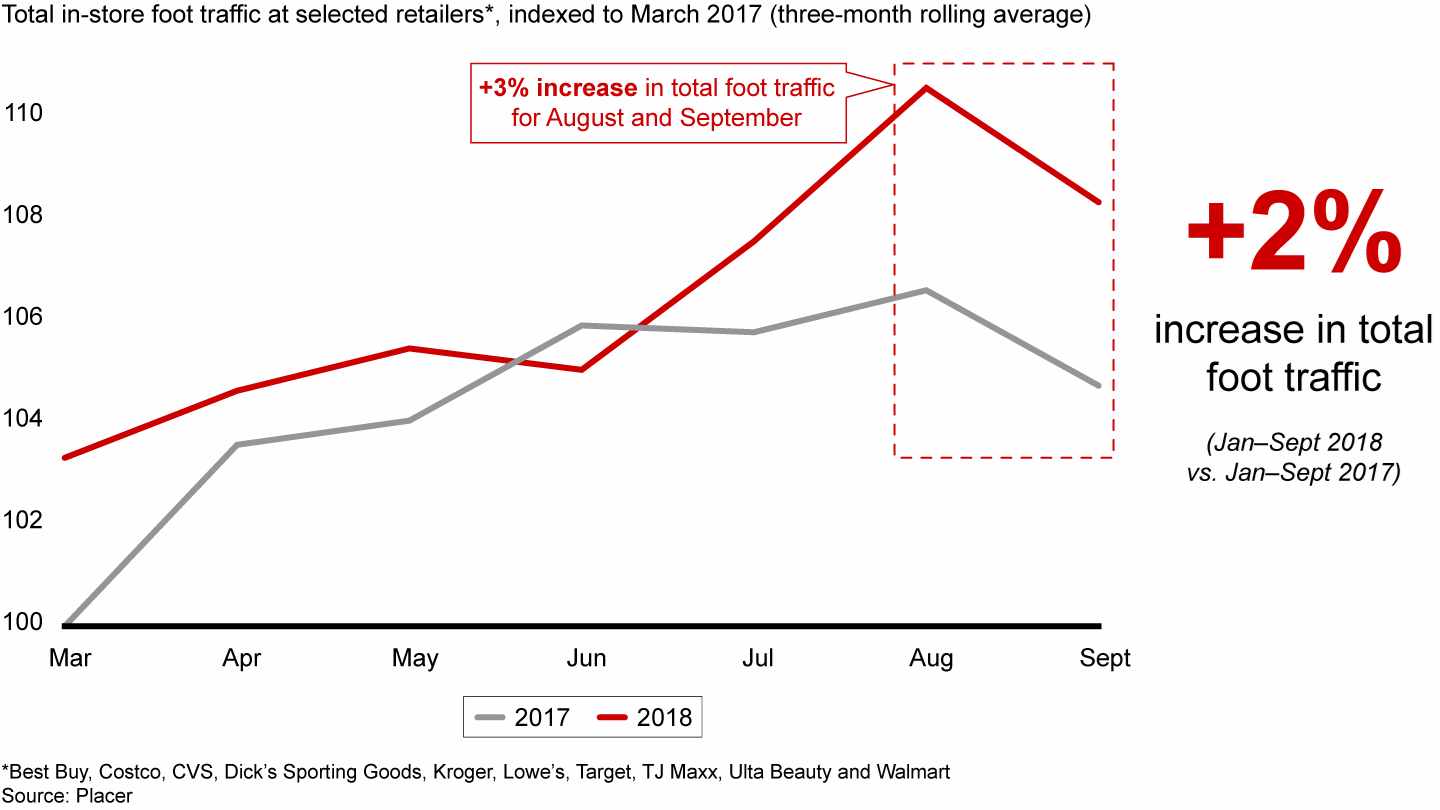
Contrary to reports in the popular press, traffic in physical stores is quite healthy. Working with Placer.ai, we analyzed recent changes in foot traffic for 10 major retailers (see Figure 2). Across our sample, foot traffic is up 2% through September and up 3% over the most recent two months. As we enter the holiday season, we expect consumers to continue shopping in stores as well as online.
In-store foot traffic across key retailers
Nonstore sales include both e-commerce and mail-order channels. E-commerce continues to show strong momentum, with roughly 15% growth over the first half of 2018. We expect that momentum to continue into the fourth quarter and therefore forecast 15% growth in e-commerce over the holidays. Mitigating that growth is an anticipated 11% to 15% drop in mail-order sales, which represent 17% of nonstore sales. Overall, we forecast that nonstore sales will land in the 11% to 12% range.
Many factors are driving sales growth this year (see Figure 3). Key among them are macroeconomic metrics that have reached historic levels, including:
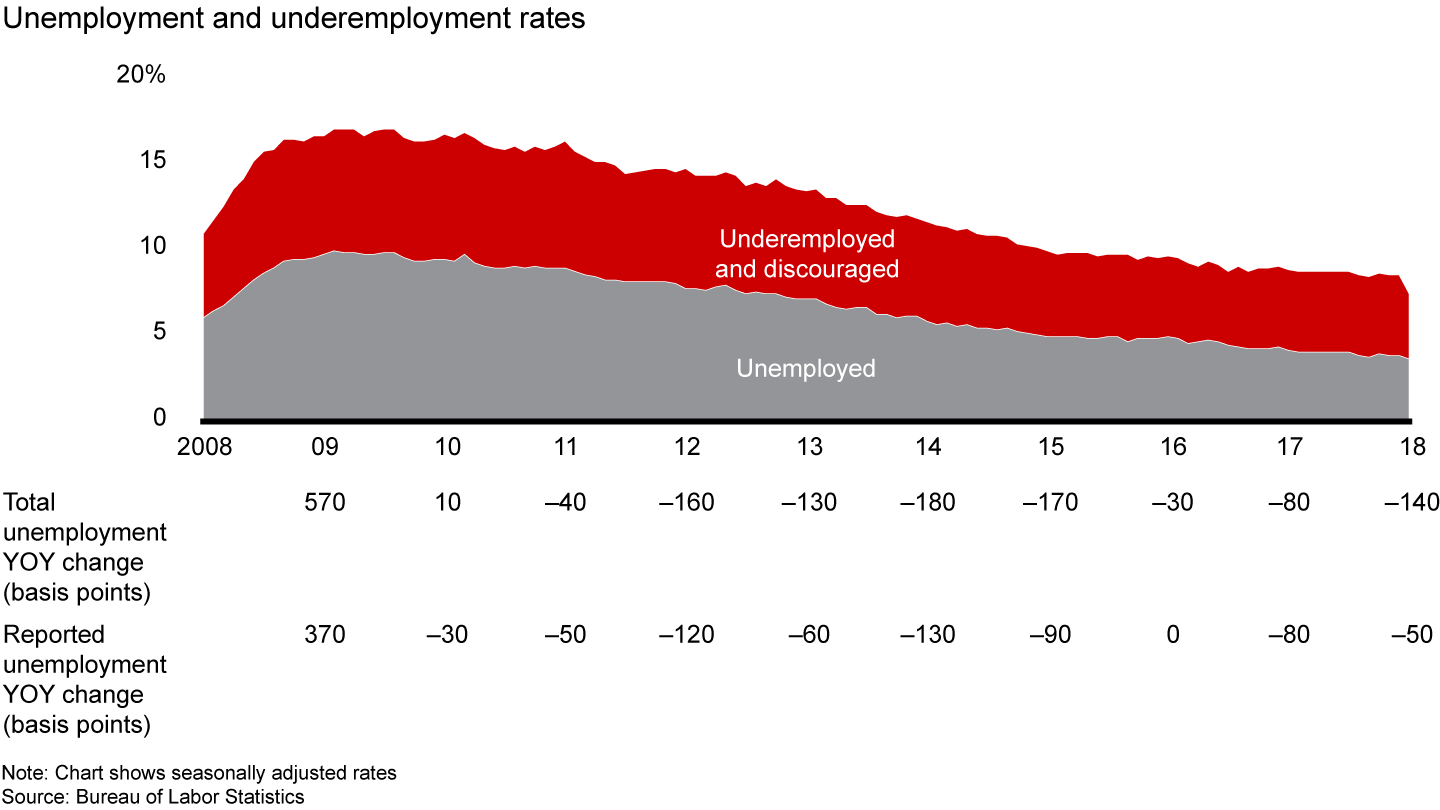
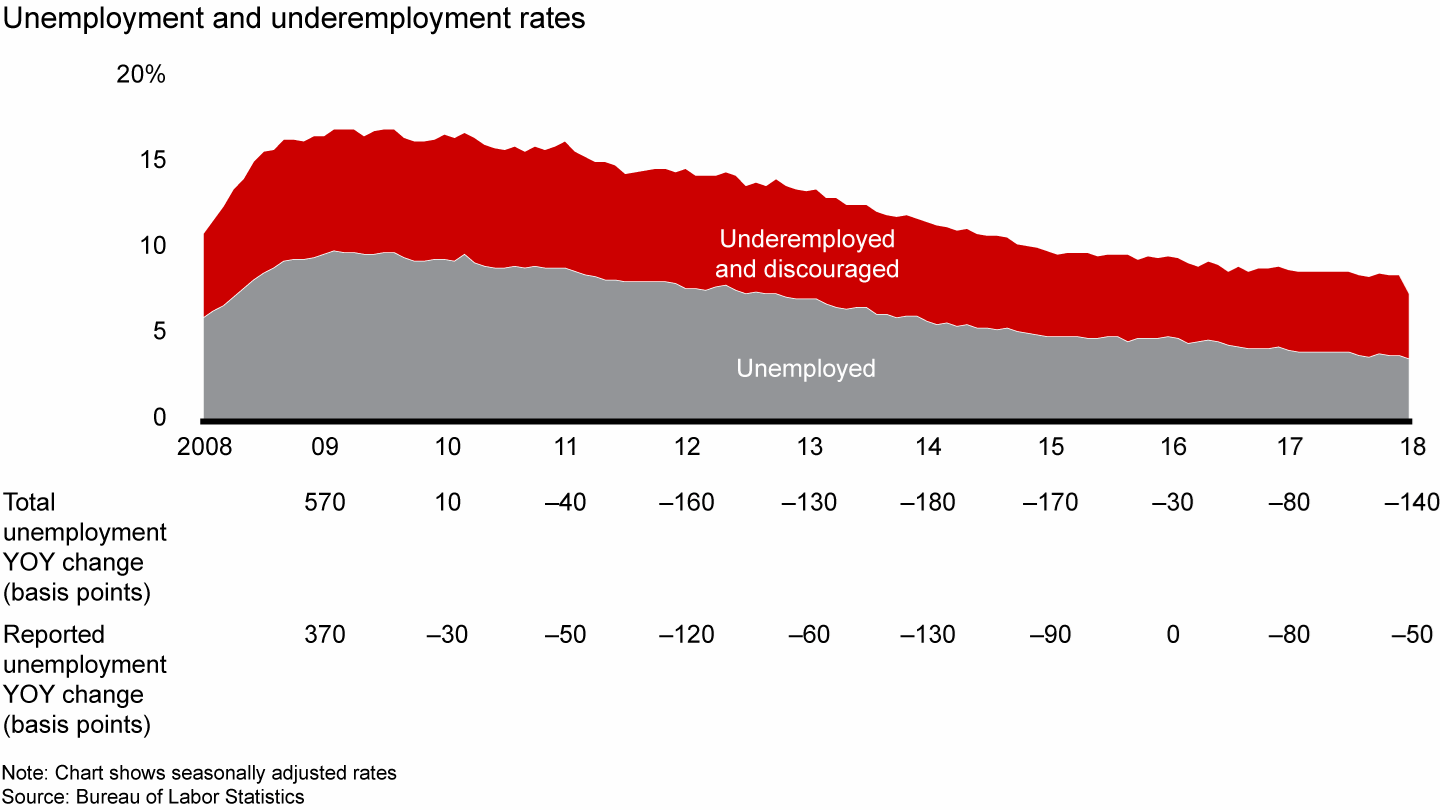
Unemployment is at its lowest rate since 1969. The September jobs report, released October 5, showed that the jobless rate fell to 3.7%, a level not reached since the Vietnam War. The Federal Reserve expects jobless rates to continue at this level or lower over the next two to three years. This trend, coupled with solid wage growth (2.9% year-over-year), means more consumers will have more money to spend this holiday season.
Consumer confidence remains high. Consumer confidence, as measured by both the Consumer Confidence Index and the Michigan Consumer Sentiment Index, has reached near-record highs. The Michigan Consumer Sentiment Index hit 100.1 in September, well above the three-year average of 94.9. In partnership with Research Now SSI, we discovered that Gen Xers (born between 1964 and 1980) are significantly less optimistic about future economic conditions entering the holiday season compared with other demographics. However, consumers are generally optimistic, which we expect to translate into robust spending this holiday shopping season.
Indicators of holiday sales growth
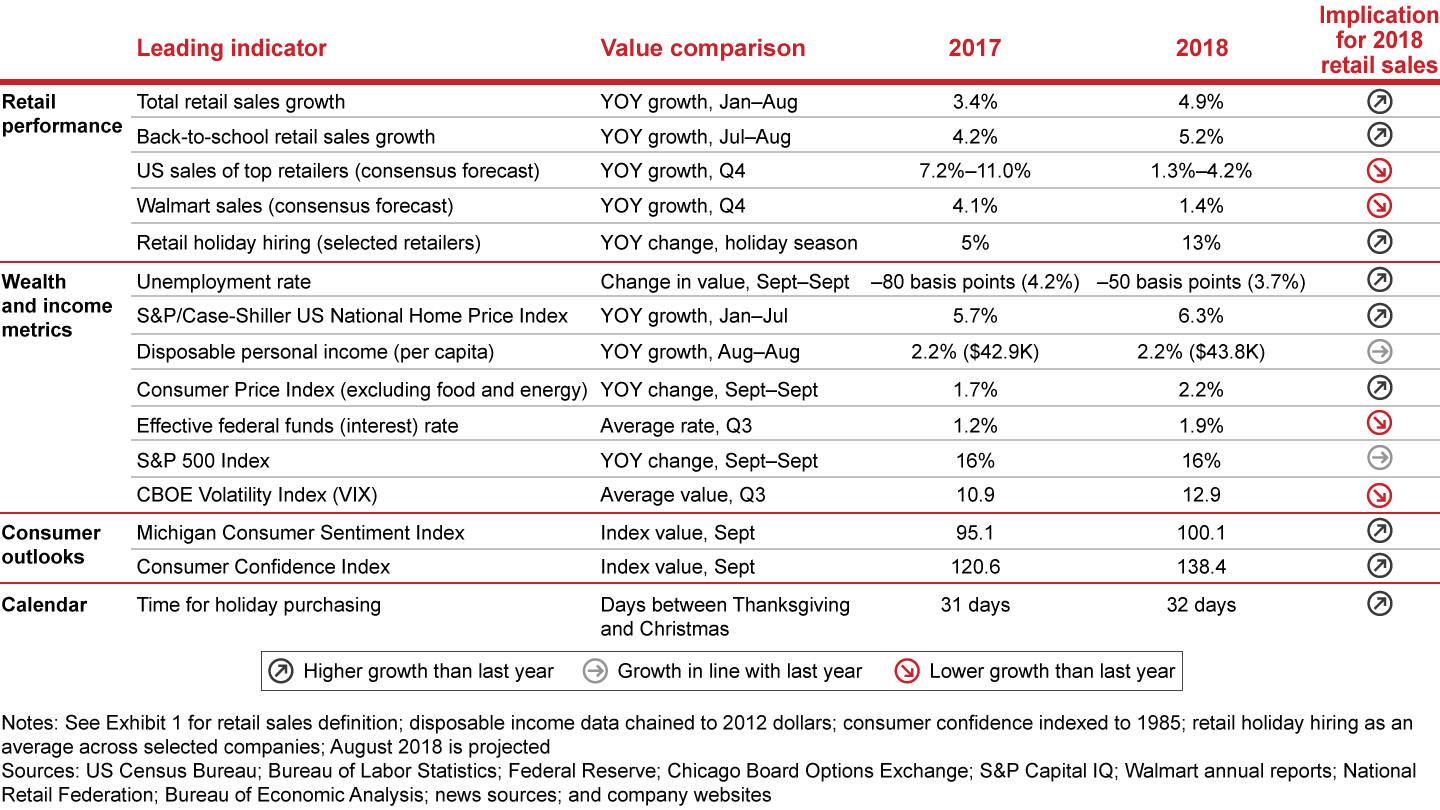
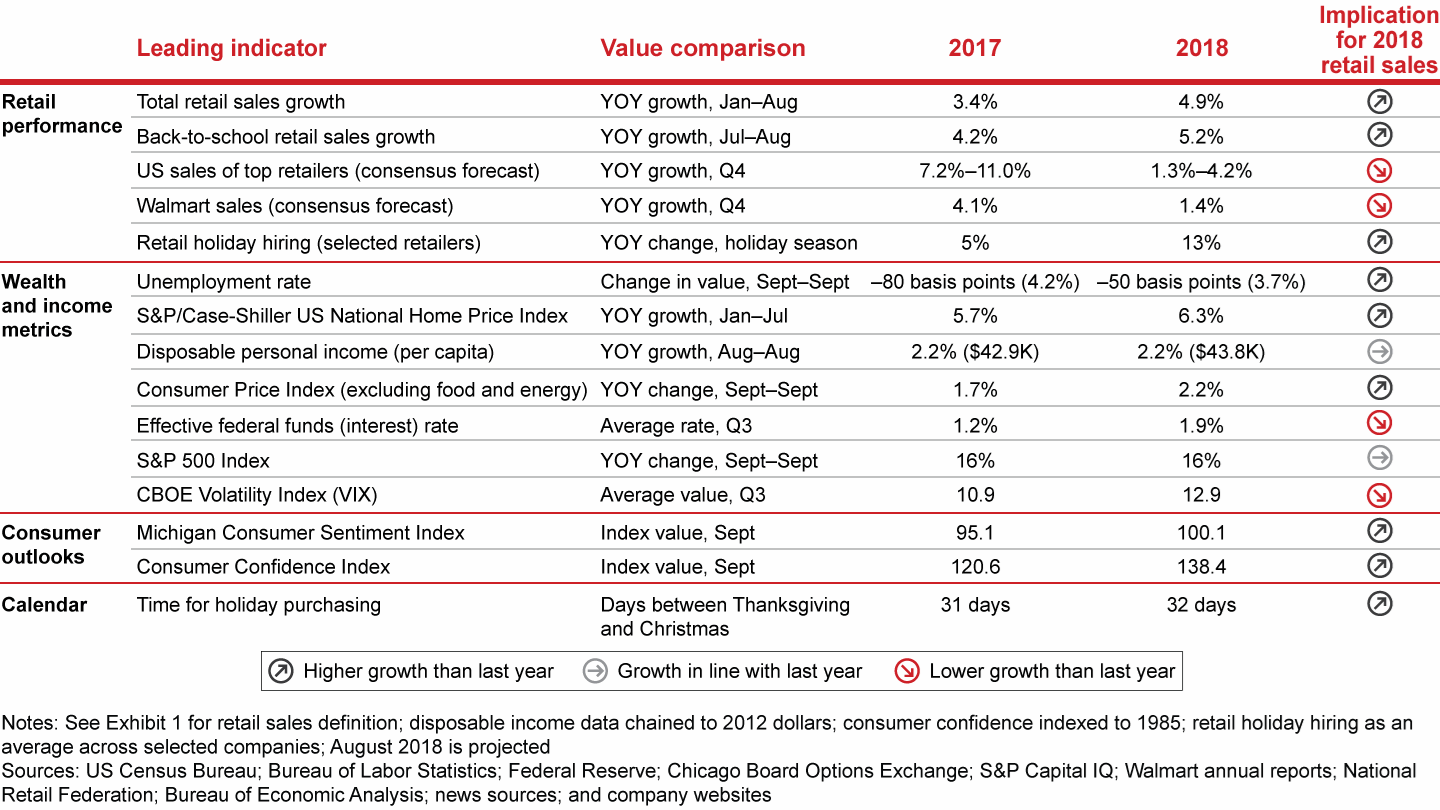
Modest inflation supports higher prices. The Consumer Price Index (excluding food and energy) increased 2.2% over the last 12 months. Prices are rising across retail categories. The apparel price index, for example, has increased 1% year-to-date, following three consecutive quarters of price declines. These price increases are likely too modest to reduce purchase volume, so they should increase total retail sales.
Recently enacted tariffs on goods imported from China may further boost prices on select goods, but they are unlikely to have significant impact on holiday sales this year. Retailers ordered most of their holiday inventory before tariffs went into effect, and tariffs will remain at just 10% through December. Think of this as the equivalent of the dollar weakening by 10%. In the past, this type of shift has had little effect on holiday sales. For example, the value of the dollar fell nearly 10% between December 2016 and September 2017. Despite that drop, holiday sales in 2017 grew 5.3%. That said, tariffs may contribute to slower sales growth in 2019 and create uncertainty around both inventory turns and profitability.
Consumers have ample time to shop. This year Thanksgiving falls on the earliest date possible, November 22, leaving a full 32 days to shop before Christmas. By comparison, next year there will be only 26 days between Thanksgiving and Christmas.
Our optimism is tempered by two factors that raise caution heading into 2019:
Rising interest rates may impede discretionary spending. The Federal Reserve has raised interest rates three times this year, and many suspect an additional hike is coming in December. Rising interest rates raise variable debt payments, including payments on adjustable-rate mortgages and credit card debt, leaving consumers with less money for discretionary purchases. Spending financed by rising levels of credit card debt has contributed to retail growth; however, consumers may borrow less as the cost to do so goes up. Our survey with Research Now SSI indicates that middle-income households are most sensitive to rising interest rates.
Stock market volatility may spook some consumers. US stocks saw record highs earlier this year, but the first two weeks of October were tumultuous. The S&P 500 dropped 5% over the course of two days earlier this month. Although the market may bounce back, volatile swings can worry consumers. Upper-income households may pull back, concerned that the almost 10-year-old bull market may soon end.
Overall, our outlook for this holiday season is optimistic. However, we may face more challenging times next year. The surge in US fiscal support is keeping conditions positive through 2018, but will provide far less kick next year. Adding to concerns: The pool of new workers is nearly depleted given low unemployment, capital is getting more expensive, and shifting trade policies are contributing to increasing economic fragility. To prepare, retailers must begin scenario planning, thinking about the effects of a downturn and adapting their strategies for less favorable economic climates.
On our list this holiday season
Over the next three months, we will continue tracking US sales data and broader trends that have an impact on the retail industry. We will be following several hot topics—ranging from Amazon's foray into brick and mortar to dynamic holiday marketing.
Here's a preview of our upcoming newsletters:
- Issue #2 (early November): Is Amazon "Primed" to Conquer Christmas?
- Issue #3 (late November): Holiday Halftime Report and Labor Insights
- Issue #4 (mid-December): Modern Merry Marketing
- Issue #5 (mid-January): Post-Holiday Recap and 2019 Outlook
Please let us know if there are other topics you'd like to learn more about by e-mailing us at RetailHolidayNewsletter@bain.com. We look forward to sharing holiday headlines with you and hearing your feedback throughout the holiday season.
Appendix
Definitions of retail sales measures
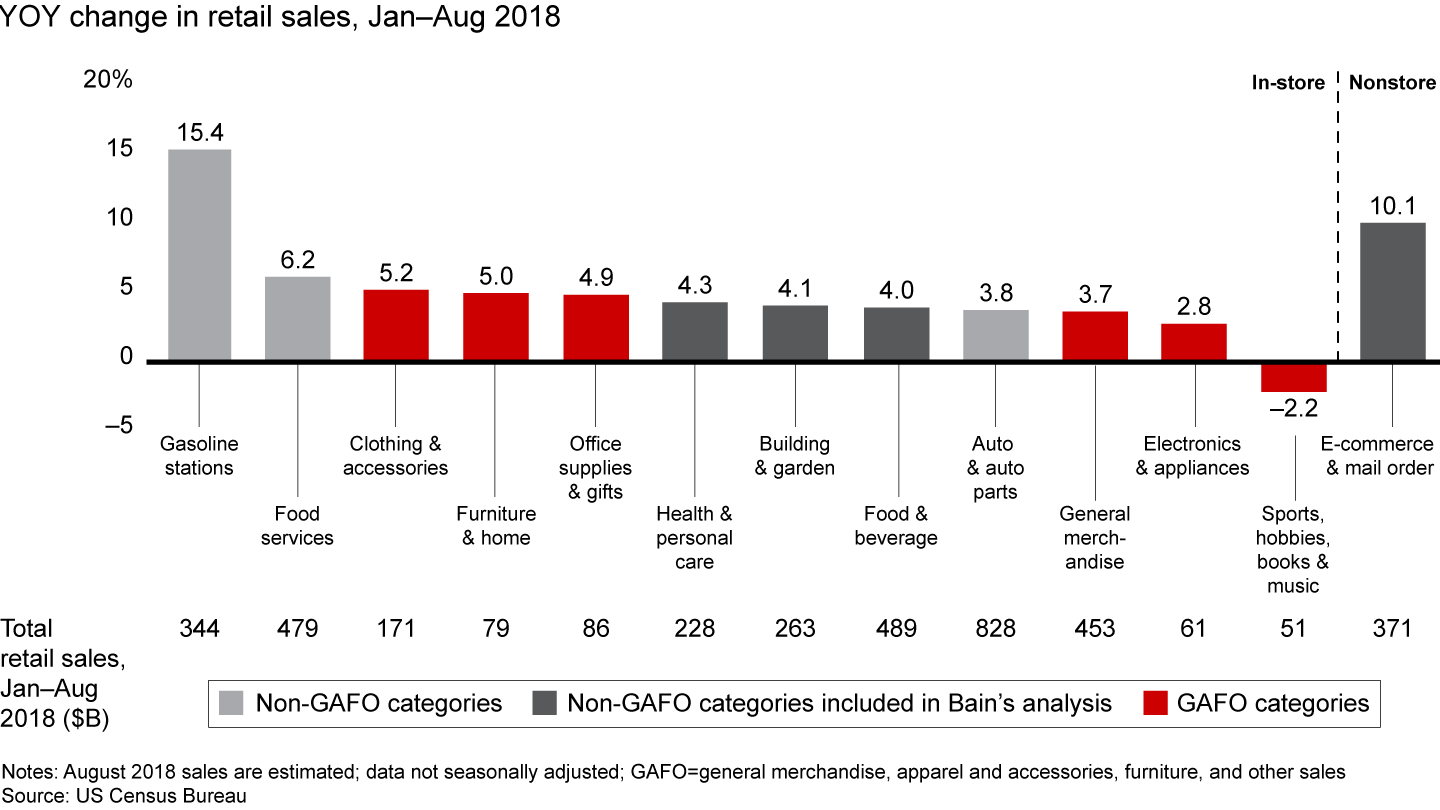
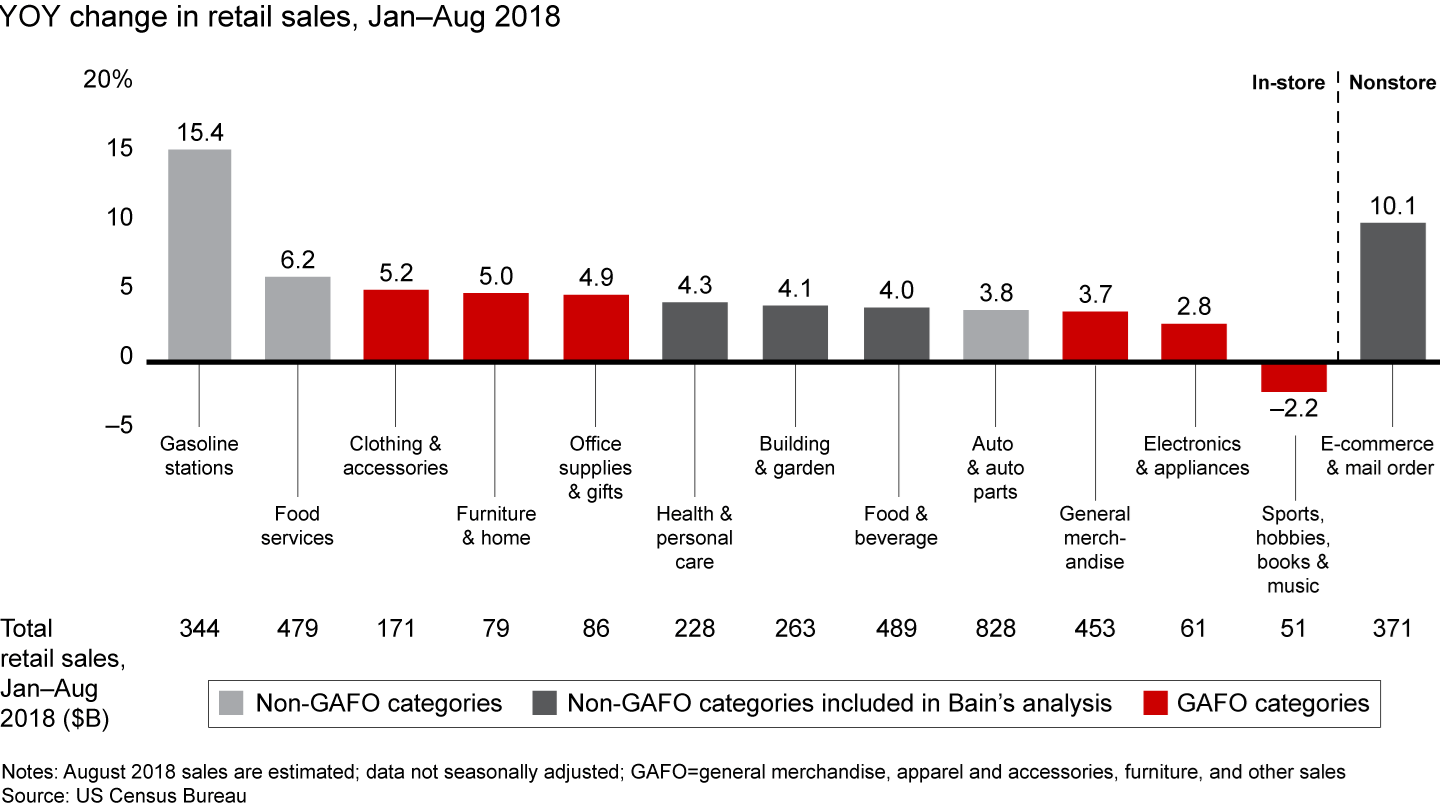
Retail sales growth by category, January–August 2018
Unemployment and underemployment rates, 2008–2018
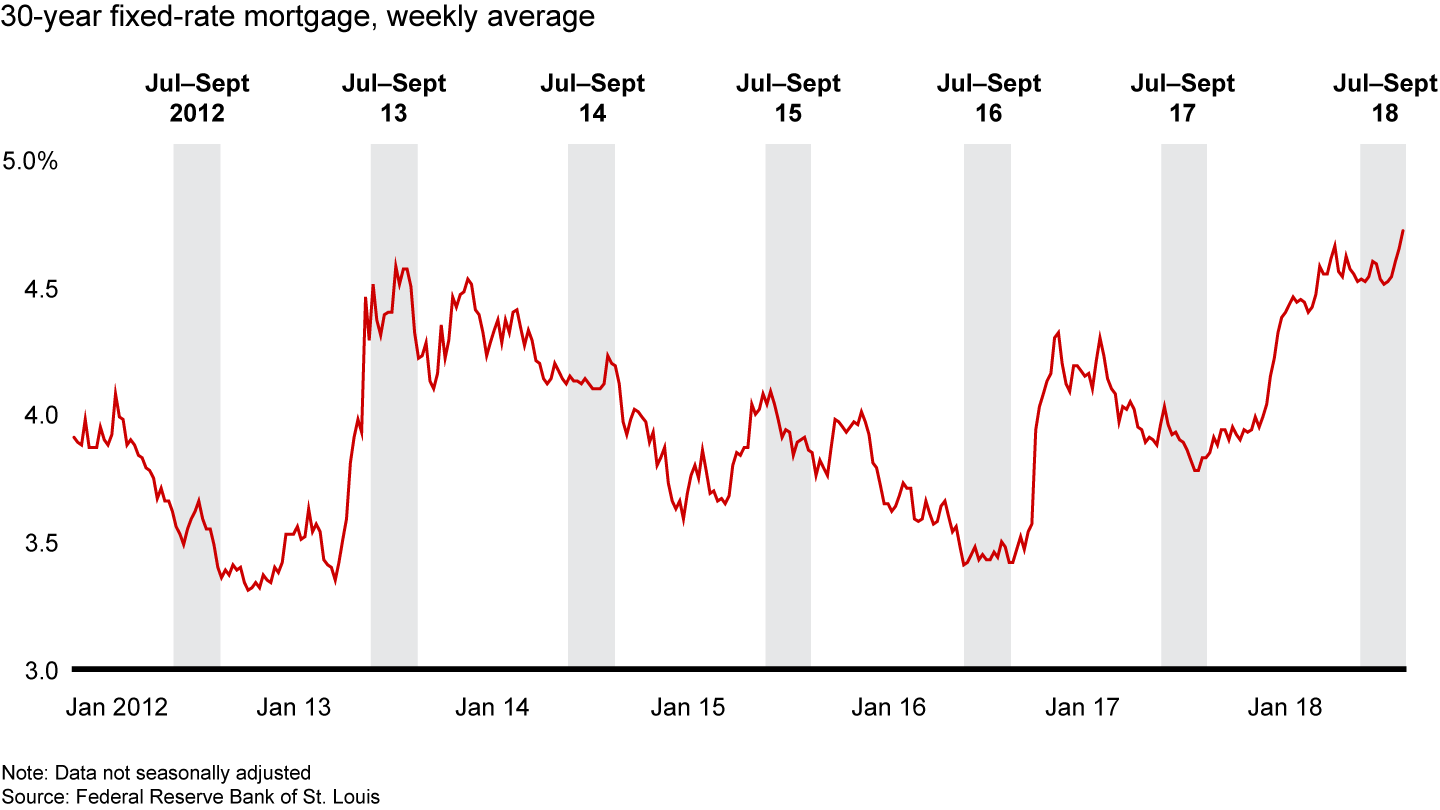
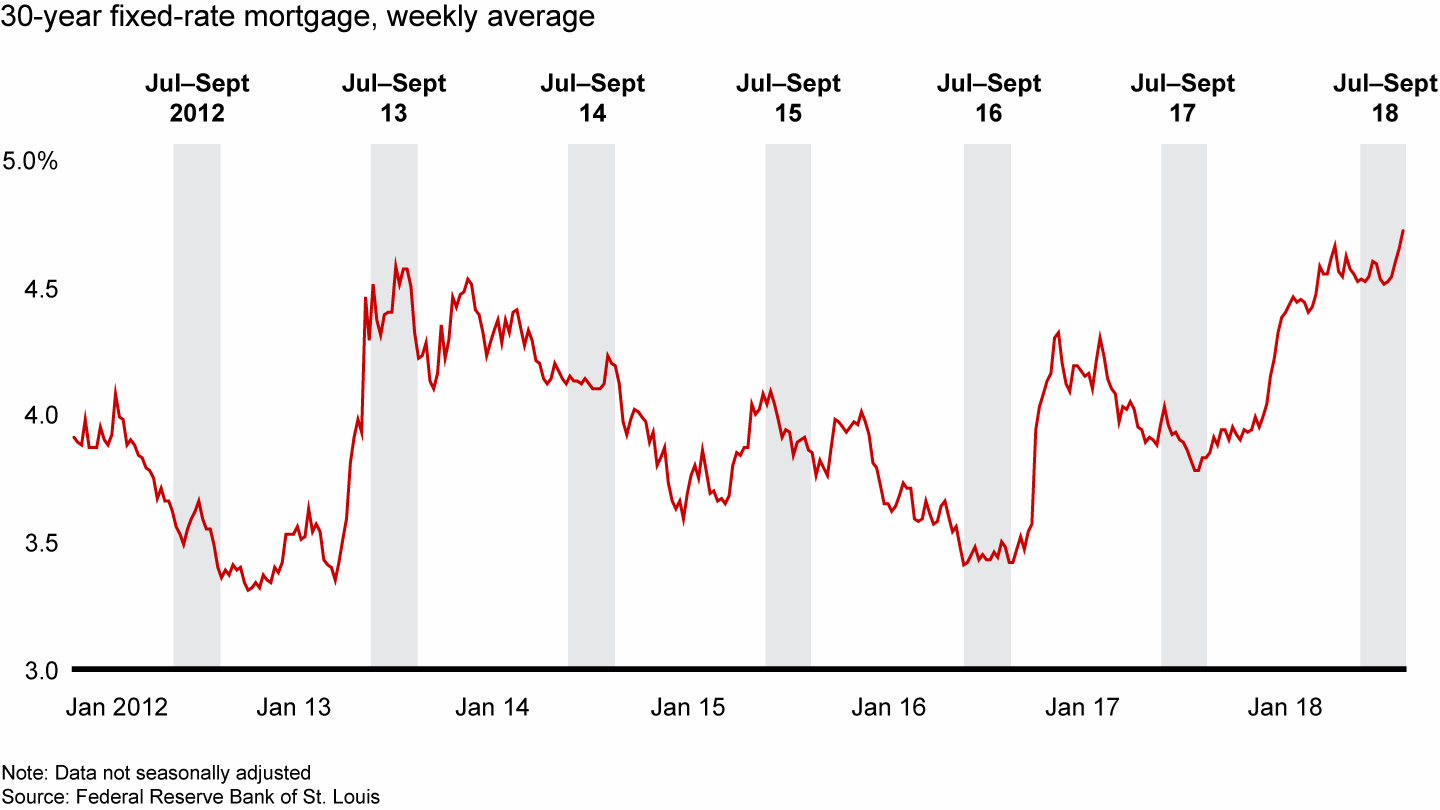
Mortgage rates recently hit a five-year-high after climbing steadily for a year
About Our Research Partners
Placer.ai is an advanced foot-traffic analytics platform that generates location-specific insights, helping retailers gain a deeper understanding of audiences and competition. Headquartered in Silicon Valley, Placer.ai enables its customers to make data-driven decisions based on precise human movement analytics. To learn more about Placer.ai, visit www.placer.ai.
Research Now SSI is a leading global provider of first-party consumer and professional data based on extensive, proprietary market research panels. Research Now SSI serves more than 5,800 market research agencies, media and advertising agencies, consulting and investment firms, and healthcare and corporate customers in the Americas, Europe and Asia-Pacific. To learn more about Research Now SSI, visit www.researchnow.com and www.surveysampling.com.
-
Selected References (click to expand)
Bain & Company has included in this document information and analyses based on the sources referenced below as well as our own research and experience. Bain has not independently verified this information and makes no representation or warranty, express or implied, that such information is accurate or complete. Projected market and financial information, analyses and conclusions contained here are based (unless sourced otherwise) on the information described above, and Bain’s judgments should not be construed as definitive forecasts or guarantees of future performance or results. Neither Bain & Company nor any of its subsidiaries or their respective officers, directors, shareholders, employees or agents accept any responsibility or liability with respect to this document.
Board of Governors of the Federal Reserve System. “Consumer Credit.” Data release, October 5, 2018.
Bureau of Economic Analysis. “Personal Income and Outlays, August 2018.” News release, September 28, 2018.
Bureau of Labor Statistics. “Consumer Price Index—September 2017.” News release, October 13, 2017.
Bureau of Labor Statistics. “Consumer Price Index—September 2018.” News release, October 11, 2018.
Bureau of Labor Statistics. “The Employment Situation—September 2018.” News release, October 5, 2018.
Chicago Board Options Exchange. “CBOE Volatility Index: VIX [VIXCLS].” Database, accessed October 16, 2018.
“D&B Hoovers.” Database, accessed October 12, 2018.
Federal Reserve Bank of Atlanta. “Wage Growth Tracker.” Data release, October 1, 2018.
Federal Reserve Bank of St. Louis. “Effective Federal Funds Rate.” Graph, October 1, 2018.
Federal Reserve Bank of St. Louis. “Real Median Household Income in the United States.” Graph, September 12, 2018.
“FedEx to Hire 55,000 Workers, Raise Hours for Holiday Season.” Reuters, September 12, 2018.
Freddie Mac. “Mortgage Rates Jump.” Press release, October 11, 2018.
Kohl’s. “Kohl’s Provides Holiday Hiring Update—to Hire 90,000 Seasonal Associates.” Press release, September 27, 2018.
Liffreing, Ilyse. “‘A Resurgence of Physical Retail’: Retailers Report Upticks in Store Sales.” Digiday, August 23, 2018.
Morath, Eric, and Harriet Torry. “U.S. Unemployment Rate Falls to Lowest Level since 1969.” WSJ.com, October 5, 2018.
“S&P 500.” Graph, October 12, 2018.
S&P Capital IQ. “Capital IQ Company Screening Report.” Spreadsheet, October 5, 2018.
“S&P CoreLogic Case-Shiller U.S. National Home Price NSA Index.” Graph, September 25, 2018.
Schulz, David P. “2018 Top 100 Retailers.” Stores, June 28, 2018.
Semega, Jessica, Kayla Fontenot, and Melissa Kollar. “Income and Poverty in the United States: 2017.” US Census Bureau, September 2018.
Tankersley, Jim, and Keith Bradsher. “Trump Hits China with New Tariffs on $200 Billion in Goods, Escalating Trade War.” NYTimes.com, September 17, 2018.
Target. “Target to Hire 120,000 Seasonal Team Members and Offer Extra Hours to Existing Teams This Holiday.” Press release, September 13, 2018.
The Conference Board. “The Conference Board Consumer Confidence Index Increased in September.” Press release, September 25, 2018.
Thomas, Lauren. “Macy’s to Hire 80,000 Holiday Workers, on Pace with Last Year, as Retailer Sees ‘Strong and Successful’ Season.” CNBC, September 12, 2018.
University of Michigan. “Surveys of Consumers: Preliminary Results for October 2018.” Data release, October 12, 2018.
“UPS to Hire About 100,000 Workers for Holiday Season.” Reuters, September 17, 2018.
US Census Bureau. “Advance Monthly Sales for Retail and Food Services, September 2018.” News release, October 15, 2018.
US Census Bureau. “Estimates of Monthly Retail and Food Services Sales by Kind of Business: 2018.” Spreadsheet, October 15, 2018.
US Census Bureau. “Quarterly Retail e-Commerce Sales 2nd Quarter 2018.” News release, August 17, 2018.
US Census Bureau and US Department of Housing and Urban Development. “Monthly New Residential Sales, August 2018.” News release, September 26, 2018.
Williams, Ryan. “State of the U.S. Online Retail Economy, Q1 2018.” Webinar, March 16, 2018.
Yahoo! Finance. “US Dollar Index Futures Cash,Co (DX-Y.NYB).” Table, accessed October 15, 2018.