Managing the Energy Transition: Three Scenarios for Planning
A new era of hypercompetitiveness will redefine business boundaries as it threatens to strand legacy assets.
By Jorge Leis
Brief
Managing the Energy Transition: Three Scenarios for Planning
Managing the Energy Transition: Three Scenarios for Planning
A new era of hypercompetitiveness will redefine business boundaries as it threatens to strand legacy assets.
By Jorge Leis
First published on marzo 12, 2019
min read
Brief
Managing the Energy Transition: Three Scenarios for Planning
en
In the era of hypercompetitiveness, energy companies will face nontraditional competitors as new participation models exploit vertical and horizontal integration opportunities within and across energy value chains to create sustainable competitive advantage.
Peak oil demand scenarios out to 2030 are now commonplace as new sources of demand destruction begin to have an impact on the oil market.
Demand for fossil fuels could peak by 2030 under a more aggressive transition to a greener future, as growth in the demand for natural gas fails to compensate for lower demand for oil and coal.
Global energy demand growth continues to slow as sustainability considerations affect not only the energy mix but the overall demand for energy.
These are some of the insights identified in Bain & Company’s fourth and most recent research effort into the integrated economics of energy markets—specifically oil, gas, coal, nuclear and renewables supplies in the utility power generation, industrials, transportation and buildings demand markets. (See the section “Background and methodology” in the Bain Brief “Energy Management in the Age of Disruptions” for context on this ongoing research effort.) We periodically perform this research in order to understand the disruptions underway, develop a range of plausible outcomes and help our clients form scenarios that allow them to manage their businesses in times of unprecedented uncertainty.
In this year’s study, we added five new sources of potential disruptions to the analysis: three that impact industrials demand (plastics demand, nonplastics recycling and industrial energy efficiency), as well as digital technology and sustainability. In order to provide a view of how similar scenarios change over time, we adapted the three broad scenarios from our 2017 study:
Oil and Gas Superabundance, in which fossil fuels are plentiful and cheap;
Green Transformation, in which aggressive technology advancements and policy changes accelerate the adoption of renewables; and
Market Montage, a scenario that smoothly extrapolates current trends and serves as a reference case.
As with the 2017 study, our analysis of these scenarios, along with conversations with industry executives, suggests a refinement to the key imperatives for energy executives in the coming era of hypercompetitiveness:
As always, integrate scenario analysis and a disciplined tracking system into your strategic planning process to test for robustness and provide early detection of coming disruptions.
Reassess your participation model to identify where best to compete, and repurpose your business model accordingly to identify how best to compete.
Fundamentally reposition your ability to compete by leveraging digital technology.
Think globally but act locally; competitive battles will be influenced by global trends but play out on a local scale.
Build new capabilities for a new era: Innovation, agility and resilience must become core competencies.
And finally, adopt more flexible financial return metrics, especially when building new capabilities or learning about new markets.
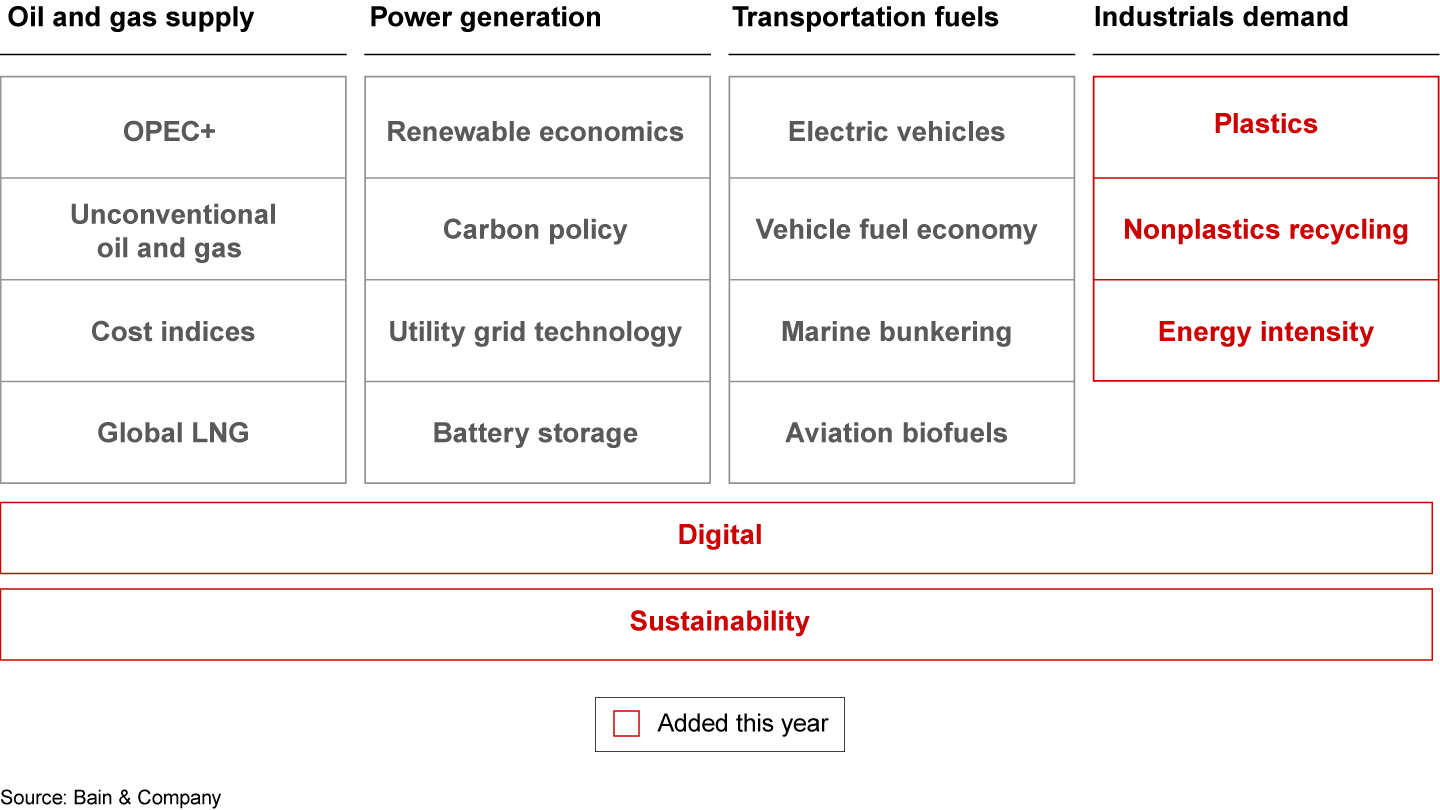
This year’s study analyzes 17 potential disruptions
This year’s list of potential disruptions to the energy landscape by 2030 incorporates five new trends: three that affect industrial demand and two that influence the remaining 15 (see Figure 1). In addition, we modified several others (which were included in the 2017 study) that warrant further elaboration.
Figure 1
Looking out to 2030, we analyzed 17 trends that have the potential to disrupt the global energy landscape
Three trends represent potential disruptions to industrial demand for energy (combustible and noncombustible): plastics demand, nonplastics recycling and industrial energy efficiency.
Plastics demand. Demand for virgin plastics will be impacted as consumers pressure companies and governments to reduce plastic waste. Consider the following facts:
In April 2018, 40 companies that represent about 80% of all plastics packaging in UK supermarkets formed the UK Plastics Pact, aiming to make all plastic packaging either reusable, recyclable or compostable by 2025.
In June 2018, more than 25 investors managing more than $1 trillion in assets formed the Plastic Solutions Investor Alliance,demanding that Nestlé, PepsiCo, Procter & Gamble and Unilever reduce their use of plastic packaging.
Major corporations including LEGO, Ikea, Apple and Starbucks have announced they are looking to replace plastics wherever possible.
Legislation can pose sudden transformational disruptions to established business norms; a plastic bag levy in Ireland resulted in a 90% reduction in plastic bag consumption in one year.
Plastics regulation and the adoption of different industry practices will have a measurable impact on virgin plastics demand by 2030. With major new regulation, a step change in consumer behavior and accelerated development of substitutes, reduced virgin plastics demand could displace about 3% of global petroleum liquids demand. This is roughly the same level of displacement as anticipated in the reference case for electric vehicle (EV) penetration into the light-duty vehicle market.
Nonplastics recycling. Increased recycling outside of plastics will lower the demand for energy by 0.3% in the reference case. The share of recycled materials is expected to increase significantly in industries that make up a large share of energy demand, for example, steel, paper and aluminium, resulting in significant energy savings since it is substantially more energy efficient to produce recycled material than new material.
Energy intensity. Industrial energy intensity is expected to decline annually by about 2 to 3 percentage points due to efficiency improvements from several different sources:
implementation of more efficient technologies;
increased regulation and governmental support;
consumer-driven energy management standards; and
newly built buildings and new machinery in fast-growing regions
Digital disruptions will reduce costs per unit of energy and improve process efficiencies along the energy value chains on both the supply and demand side of the equations. Digital has already begun to inflect cost and efficiency curves, and this trend will only accelerate in the future. As such, digital will be a key driver of many potential disruptions, including:
maintaining unconventional oil and gas on their respective experience curves, thereby continuing to reduce breakeven costs in a predictable way;
introducing step changes in operating costs and capital efficiencies for conventional sources of oil and gas, especially offshore;
pushing solar and wind power down their respective learning curves;
enabling smart grids to achieve ever-higher levels of renewables in the power generation mix;
enabling better integration of demand response, energy efficiency and distributed photovoltaics;
providing better demand management for consumers via smart device utilization;
obtaining higher vehicle fuel efficiencies for internal combustion engine vehicles (ICEVs); and
hastening EV penetration by accelerating the commercialization of autonomous vehicles.
Sustainability, like digital, influences many trends.
Renewable energy regulations are in force in 141 countries; since mid-2016, 10 countries have implemented or suggested stricter regulations.
Despite the notable US exception, carbon regulations have gained traction in both Asia and the Americas; as countries begin to use carbon pricing as a measurement of climate change risk, carbon pricing estimates are becoming more aggressive, accelerating the transition away from fossil fuels.
In transportation, sustainability efforts will drive EV penetration and higher fuel efficiency standards, while also pushing the shipping and aviation industries to invest in liquefied natural gas (LNG) and biofuels by establishing stricter emissions regulations.
Sustainability will continue to disrupt industrial demand.
Even the expected strong increase in global LNG demand is due, in part, to sustainability policies seeking ways to curb more carbon-intensive energy sources, primarily coal.
And finally, other sustainability elements will have an impact on the broad energy landscape and the way companies operate:
Environmental consciousness is shaping consumer reactions, investor appetite and government response.
Reputational risk, regulation and overall water scarcity influence water management.
Flagship green cities, motivated to reduce local emissions, are implementing tolls, regulating traffic and sourcing renewable energy.
End-of-life battery management poses new implications for recycling and remanufacturing, creating second-life opportunities.
Noteworthy modifications to trends captured in our 2017 study include OPEC+ production, oil and gas cost indices, solar power costs and battery storage costs:
OPEC+ production. The global oil market is highly sensitive to the production volume of OPEC+, the expanded bloc following the agreement by OPEC and other oil-producing nations (most notably Russia) to curtail production in December 2016. Forecasts vary widely for OPEC production through 2030. What is new is that forecasts for Russian production have diverged, with some forecasts now showing a steady increase through 2030—a departure from the near-consensus view only a few years ago that Russian production would steadily decrease in the 2020s. To capture the range in forecasts, we model 2030 Russian production from 9 to 12 million barrels per day (Mbbl/d) in this study.
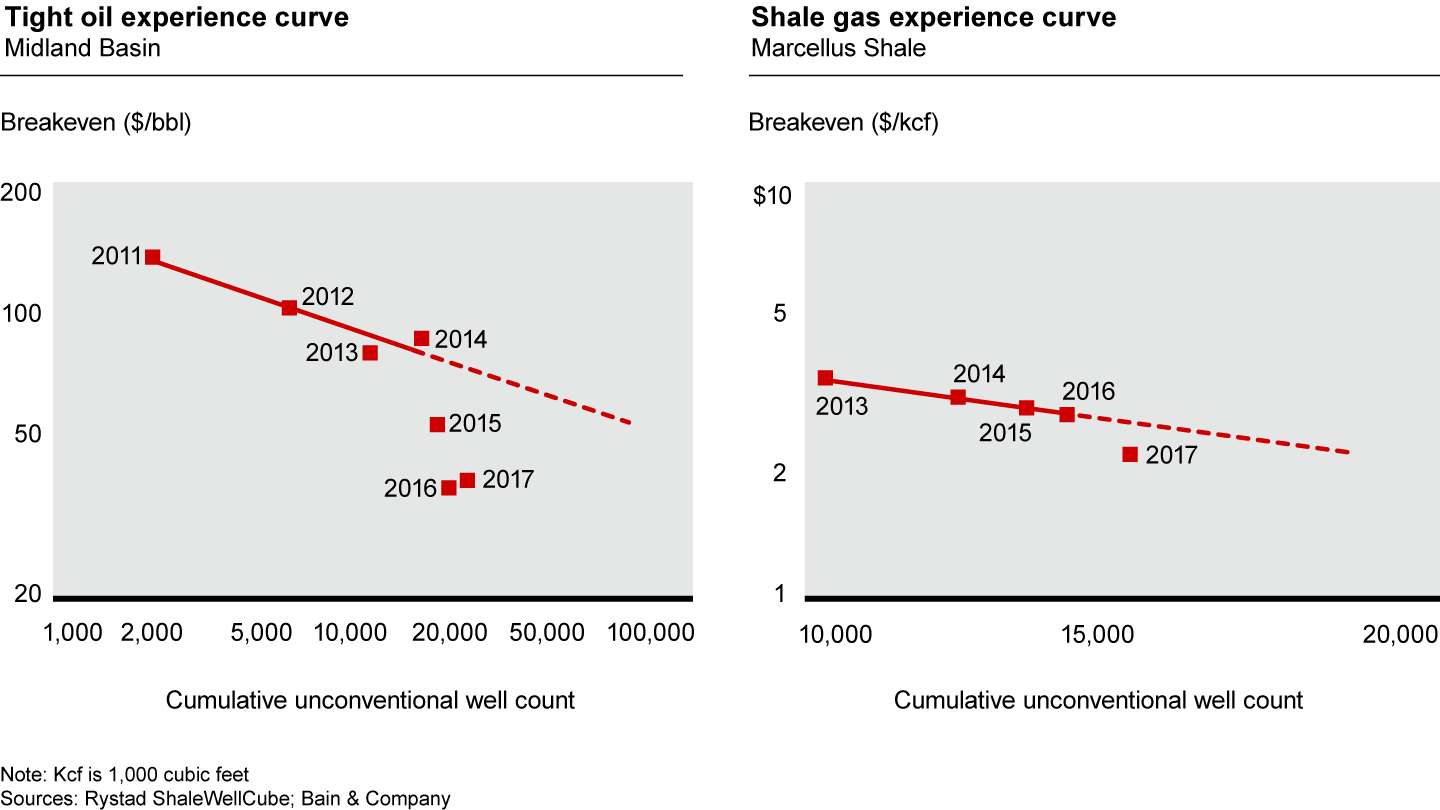
Oil and gas cost indices. In response to the downturn in mid-2014, oil and gas companies cut costs and reduced capital spending and intensity. By 2016, their efforts had produced the expected results, but it was not yet clear if these results could be sustained. Today, it appears the industry has restructured in a substantial and maintainable way, even allowing for some factor cost increases in the short term. In this year’s study, we project lower cost indices across all plays in the medium to long term. For unconventionals, this is equivalent to adopting modified experience curves for all scenarios (see Figure 2). In our 2017 study, we applied the e-curve only to the Oil and Gas Superabundance scenario.
Figure 2
North American unconventionals will converge to their respective experience curves over time
Solar power costs. As in the 2017 study, we use learning curves to project wind and solar power costs into the future. One notable change is that solar power costs may have hit an inflection point and could be following an even steeper learning curve (from a 24% to a 34% slope). Market dynamics seem to be driving this inflection point with competitive auctions up from 20% in 2016 to 60% by 2022 (excluding China).
Battery storage costs. The cost of battery storage has plummeted by about 80% since 2010 and is forecast to continue falling as storage system costs (battery pack, power electronics and periphery) are forecast to fall another 60% by 2030. As such, battery storage is uniquely positioned to impact every aspect of the electricity value chain. In particular, battery costs are becoming more competitive with peaking plants, putting one-third of US gas peaker capacity at risk from four-hour storage by the mid-2020s. In addition, falling battery storage costs are increasing the attractiveness of storage as an add-on option to renewables projects, especially for solar, where intermittence is more predictable. So-called +storage is an attractive add-on to solar projects enabling meaningful additional returns, driving even greater penetration into the power generation mix.
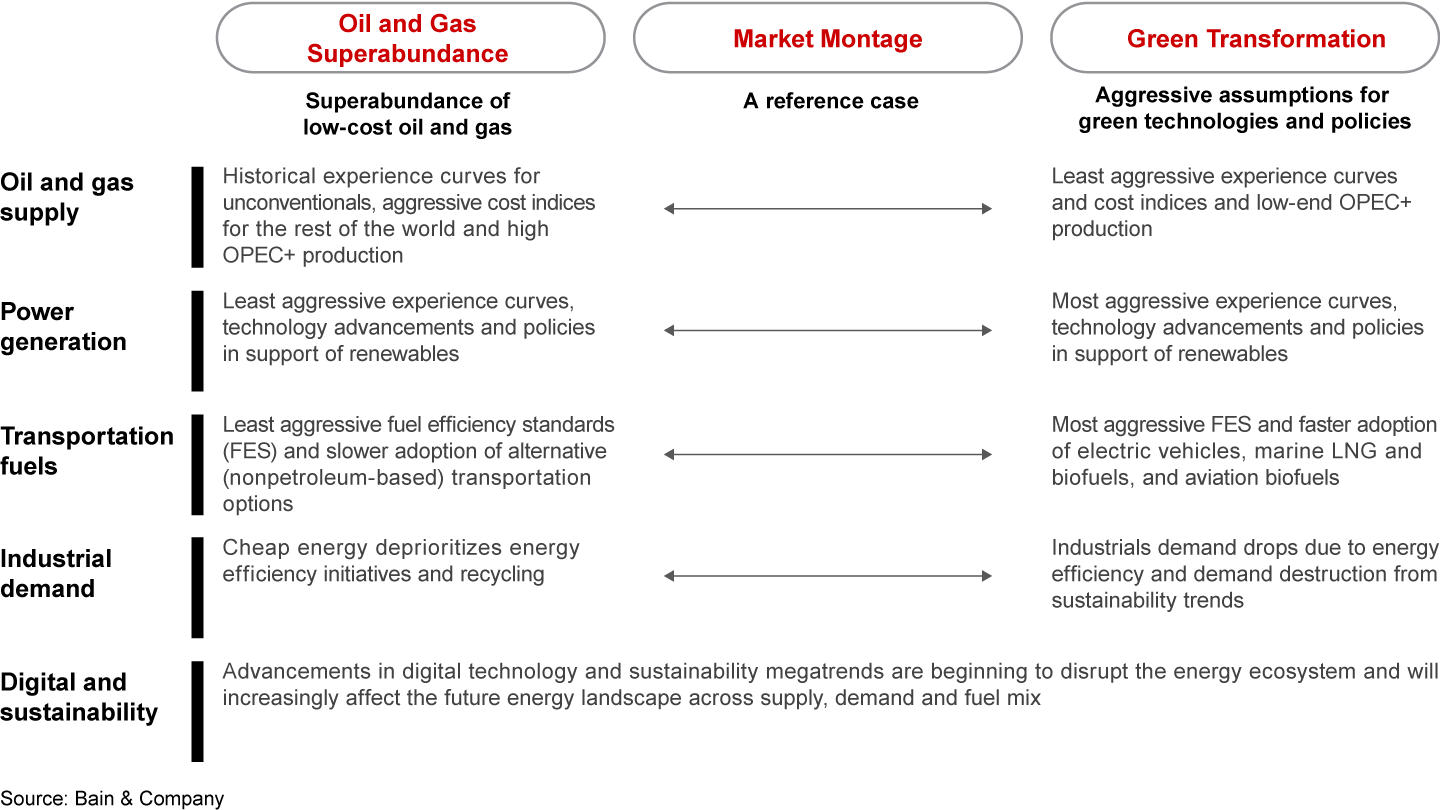
Three scenarios (still) capture the most important trends
As mentioned, in order to provide a temporal view of how similar scenarios result in different forecasts over time, we adapted the three broad scenarios from our 2017 study (see Figure 3).
Figure 3
Scenarios align with three popular themes as in the 2017 study
Again, as in the 2017 study, we take a decidedly rational economic approach to how we align the various trends to each scenario and how we model the outputs:
Variables that reinforce low-cost oil and gas supply correlate with variables that reinforce oil and gas demand and together mitigate adoption of renewables.
Variables that accelerate renewables adoption correlate with the most aggressive renewables technology advancements and pro-renewables policies, weakening demand for fossil fuels.
Comparative economics determine intrafuel and interfuel substitutions, taking into account the global, regional and local dynamics that influence supply and demand.
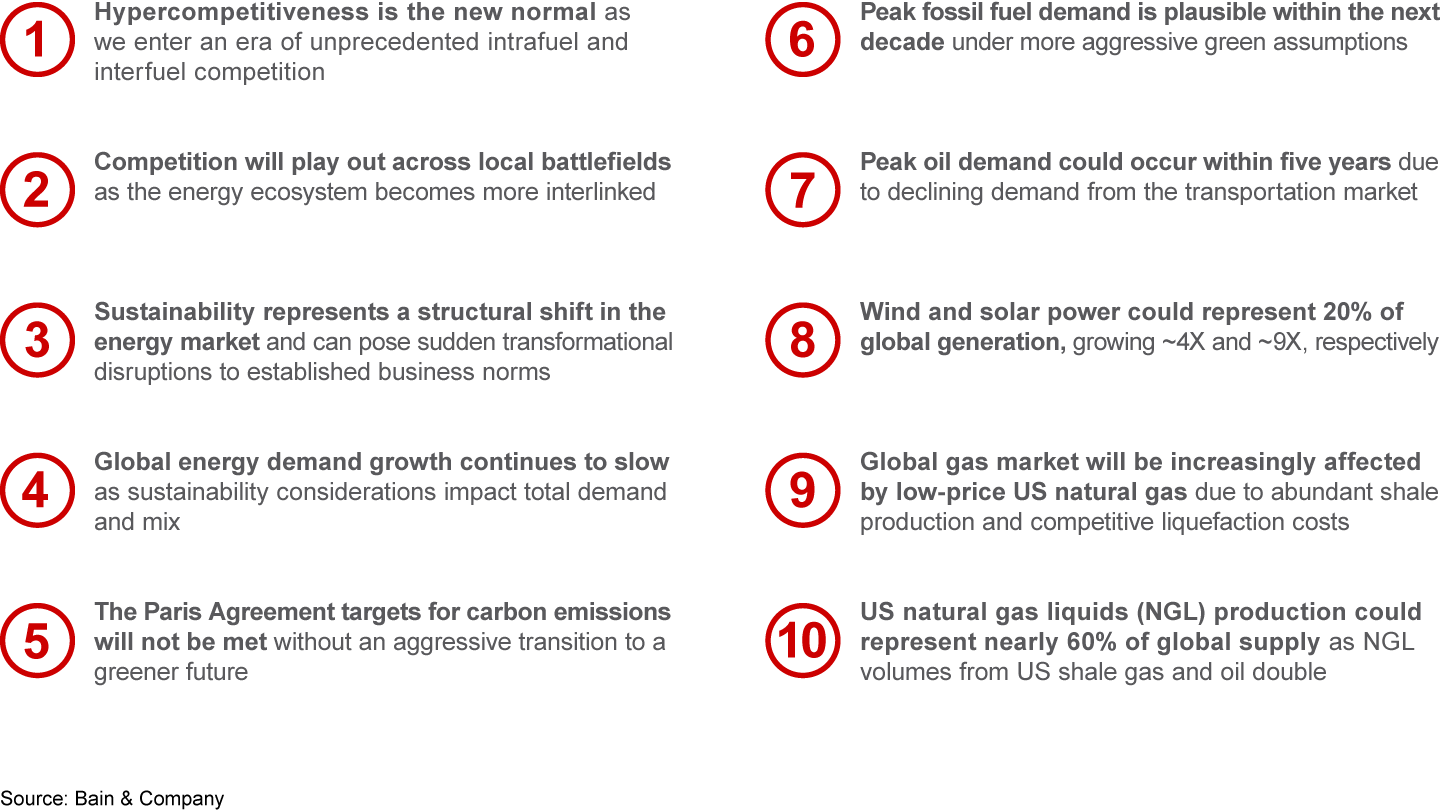
Top 10 insights reinforce a theme of structural change
The scenarios uncover a wide array of insights regarding the future energy landscape. These insights (see Figure 4) support a theme of structural change that will take solid root in the decade of the 2020s but probably lead to the most rapid change in the 2030s as substitutions enter the steep portion of their respective penetration curves.
Figure 4
Top 10 insights for the 2030 energy landscape reinforce a theme of structural change
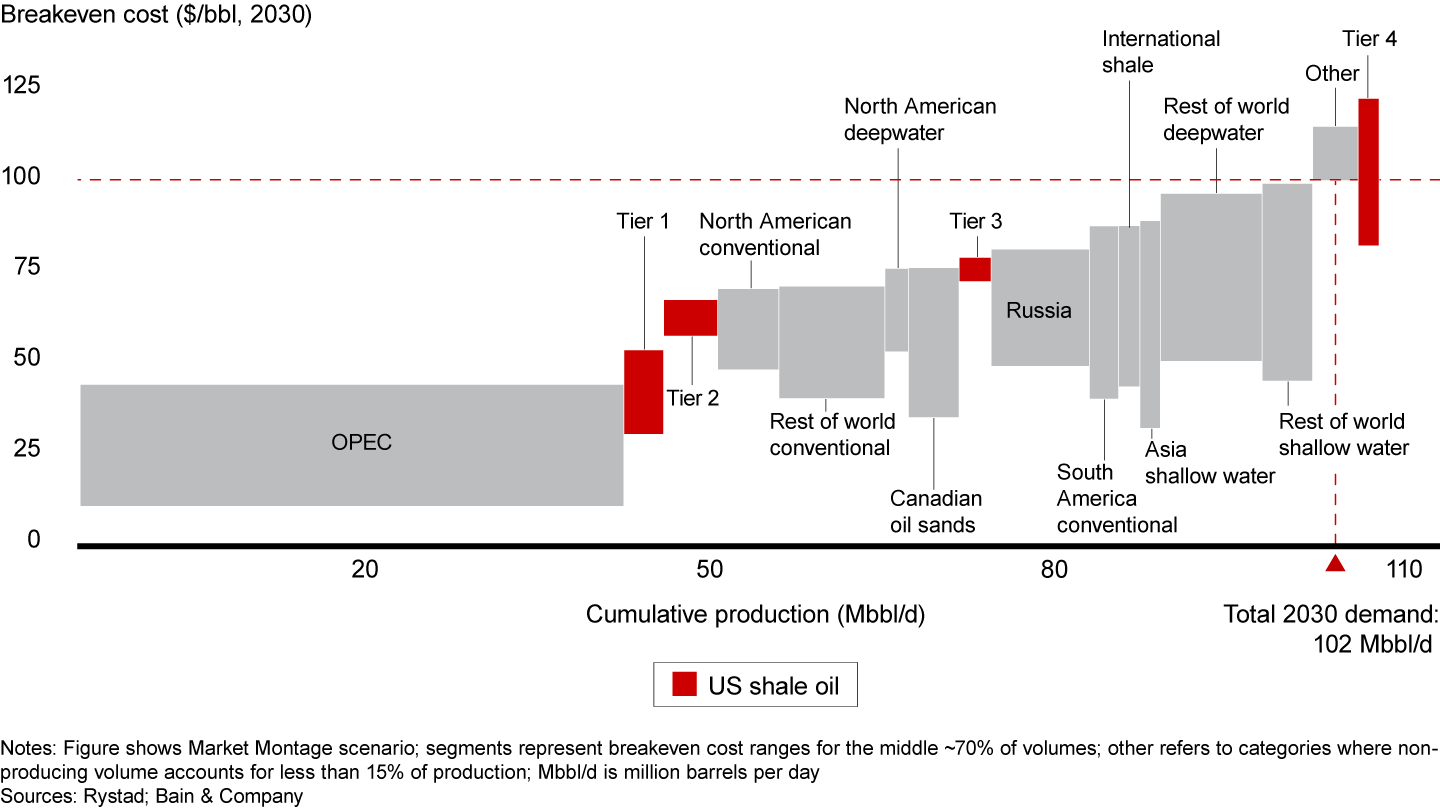
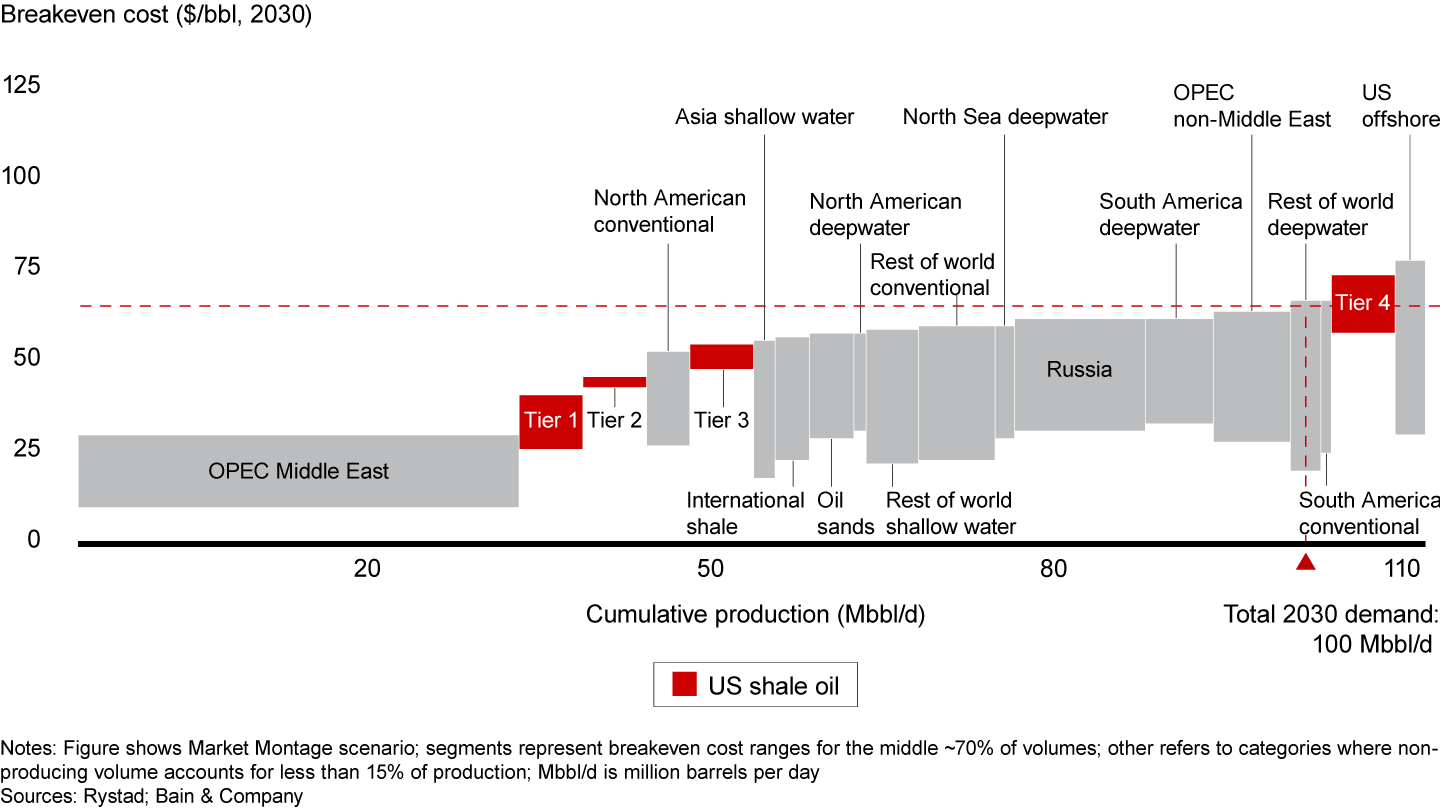
Hypercompetitiveness is the new normal. Continued reductions in supply costs and changing market demands will usher in an era of unprecedented intrafuel and interfuel competition that will threaten legacy assets. For example, in the Market Montage scenario, our current view of the supply curve in 2030 is considerably flatter than the view we had just two years ago. This is setting up intense intrafuel competition that will have profound implications for upstream portfolios (see Figures 5 and 6). Avoiding stranded assets will be a strategic as well as operational imperative. A similar analysis, comparing costs across primary fuels for power generation demonstrates how relative costs are narrowing, setting up unprecedented interfuel competition.
Figure 5
The oil supply curve in 2030, as seen in 2017, produced a clearing price of $100 per barrel
Figure 6
A projection of lower cost indices means that today's view of 2030 yields a clearing price of $60 per barrel
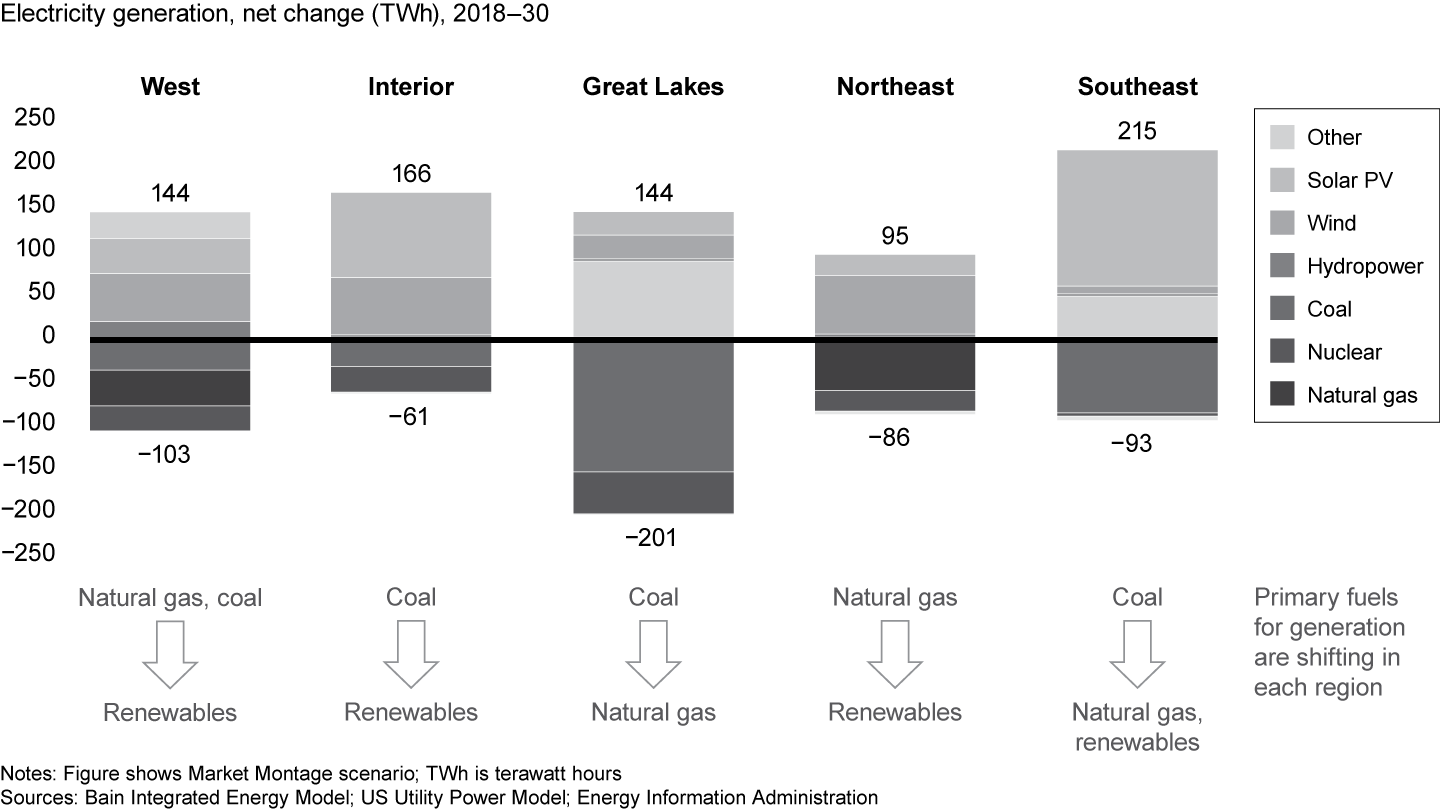
Competition will play out across local battlefields. Global trends and events will increasingly influence intra- and interfuel competition as the energy ecosystem becomes more interlinked, but many local factors will be equally important. For example, global learning curves, national and state regulations and local climate patterns can play out very differently across regions within national borders (see Figure 7). Our 2017 study captured this insight, but subsequent work has put into sharper focus the meaningful differences by region and state. For example, natural gas generation in the Northeast US is likely to be displaced by solar and, especially, wind generation, while in the Great Lakes region natural gas will largely displace coal and nuclear.
Figure 7
A range of local factors will influence the mix of fuel for electricity generation
Sustainability represents a structural shift in the energy market and can pose sudden transformational disruptions to established business norms, as noted above regarding plastics and sustainability.
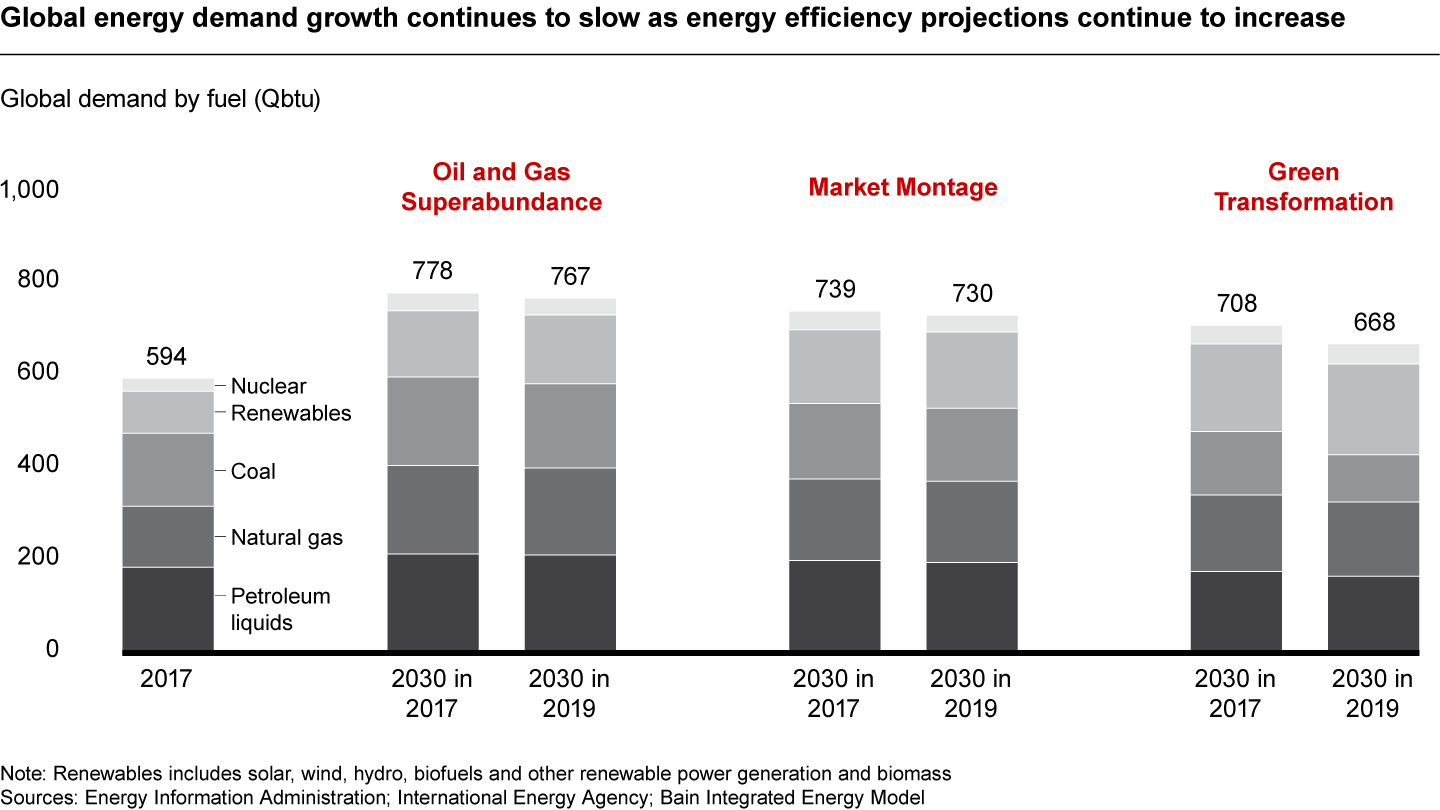
Global energy demand growth continues to slow. One of the benefits of repeating a study over time is the ability to compare findings as events unfold and we gain knowledge. A comparison of the three scenarios in this study with their namesakes in 2017 reveals that for the same scenario global energy demand decreases. The Green Transformation scenario accentuates this trend (see Figure 8). The conclusion is that energy efficiency continues to improve over time, and these improvements are increasingly evident as we move toward a greener future.
Figure 8
Expectations for energy efficiency gains are reducing total energy demand
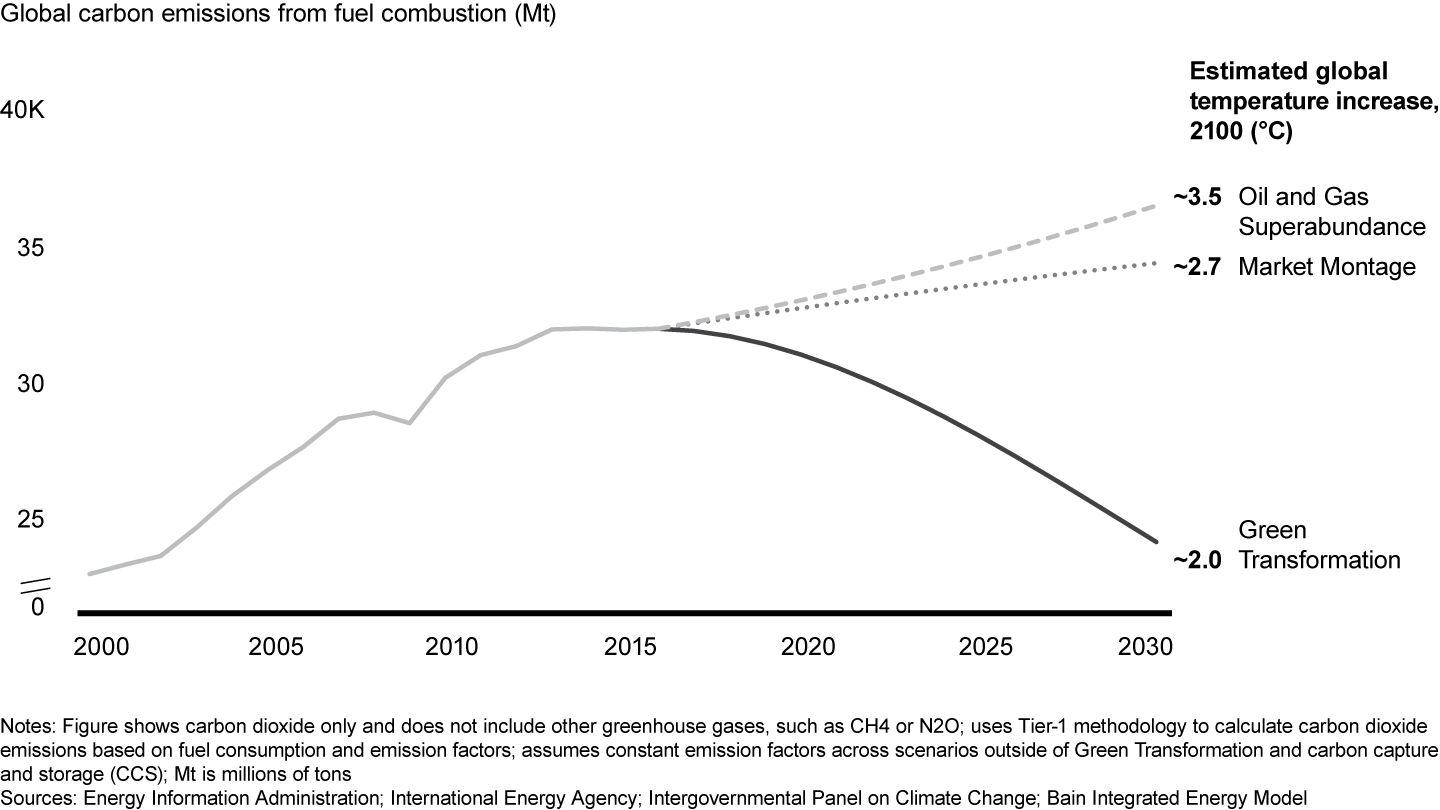
The Paris Agreement targets for carbon emissions will not be met without an aggressive transition to a greener future. According to the International Energy Agency, global carbon emissions from fuel combustion must be below 26 billion metric tons by 2030 to hold global temperature increase below the 2 degrees Celsius target. Only the Green Transformation scenario meets this standard (see Figure 9). The Market Montage scenario shows a roughly linear increase in carbon emissions, and the Oil and Gas Superabundance scenario shows an accelerating increase in carbon emissions.
Figure 9
The Paris Agreement targets for carbon emissions will not be met without an aggressive transition to a greener future
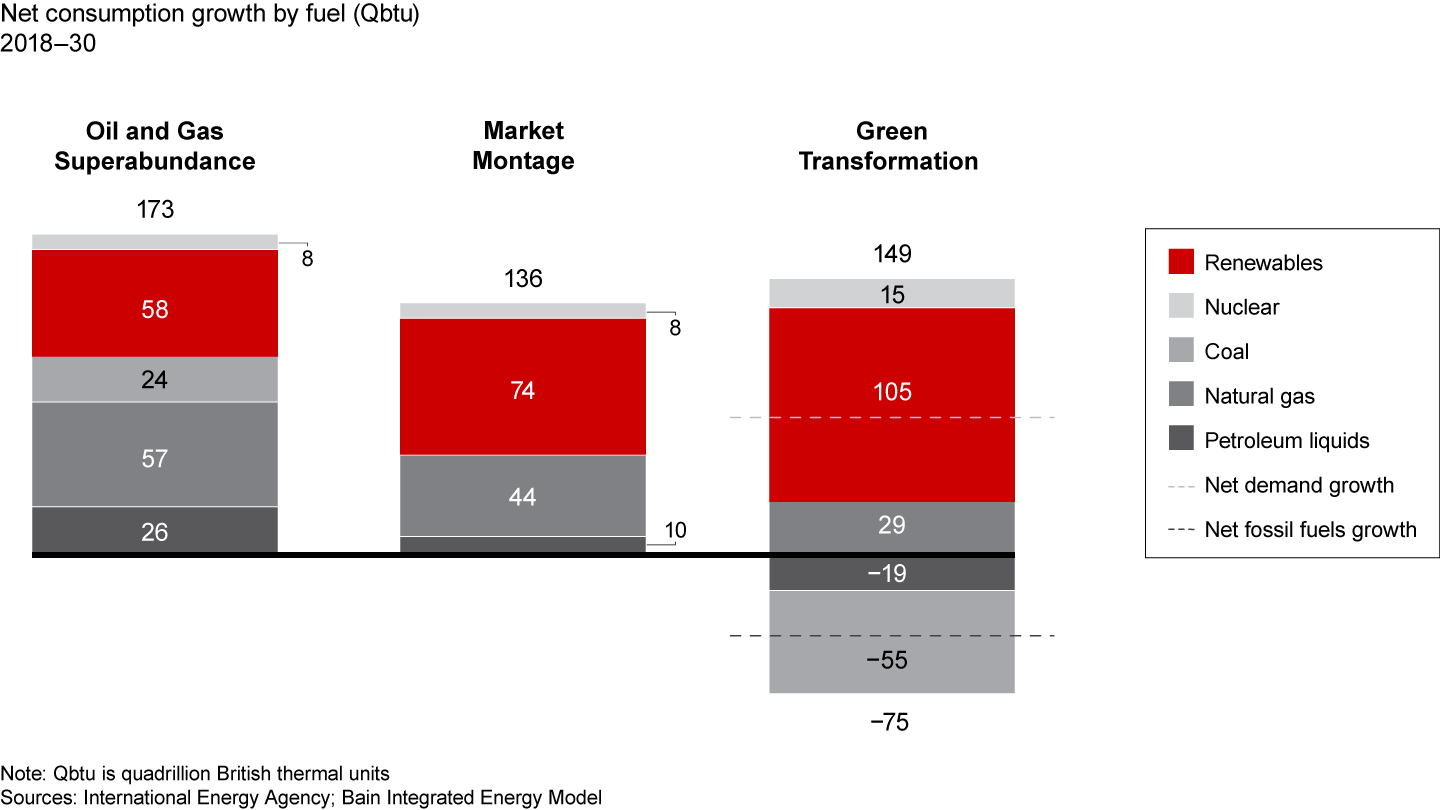
Peak fossil fuels demand is plausible within the next decade. This finding is applicable only to the Green Transformation scenario, but this is the first time in our studies that the increase in natural gas demand is unable to compensate for the decrease in coal and liquids use (see Figure 10). The difference appears to be slightly more aggressive assumptions about renewables, including a steeper learning curve for solar power and the introduction of other sustainability assumptions, such as slower growth in plastics demand due to regulation, a shift in consumer behavior and the development of more substitutes.
Figure 10
Peak fossil fuel demand is plausible within the next decade under more aggressive green assumptions
Peak oil demand is likely within a decade and plausible within five years, driven by demand destruction in transportation and industrial markets. This finding is more aggressive in this year’s study with two scenarios now, Market Montage and Green Transformation, indicating peak oil demand within a decade.
Wind and solar power could represent 20% of global generation. Wind power could grow by a factor of four, and solar could grow by a factor of nine. This finding is similar to our 2017 study except that in this year’s study, solar power penetrates further into the power stack due to a steeper learning curve. In 2017, we projected that solar power could triple.
The global gas market will be affected increasingly by the low price of natural gas from the US, due to abundant shale production and competitive liquefaction costs. We described this finding in detail in our 2017 study.
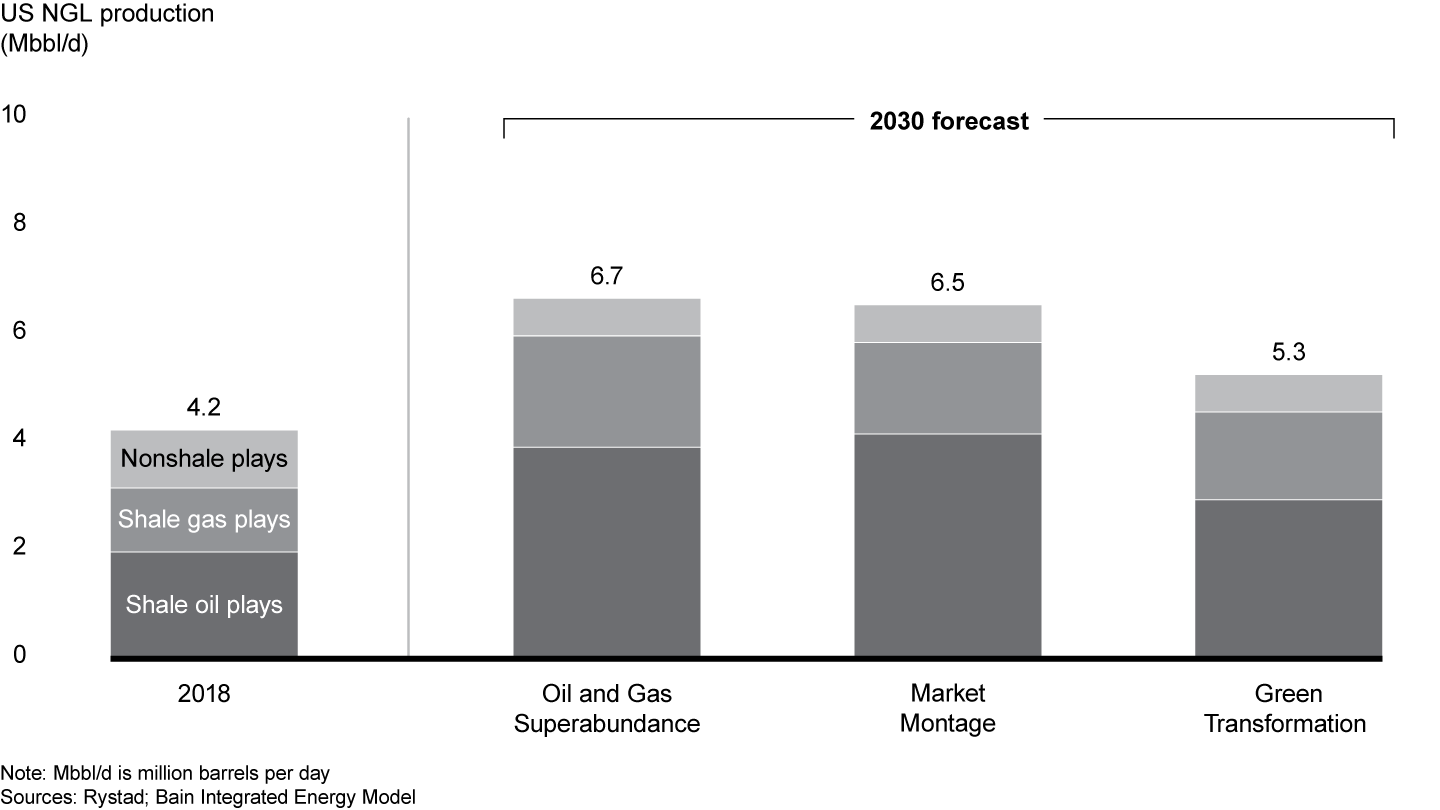
US natural gas liquids (NGL) production could represent nearly 60% of global supply as NGL volumes from US shale gas and oil double. Shale NGL production is expected to double across scenarios, moderated by a decline in non-shale plays (see Figure 11). This increase would grow the US market share of global NGL production from about 40% in 2018 to nearly 60% by 2030.
Figure 11
US production of NGLs could make up 60% of global supply as volumes from US shale oil and gas basins double between 2018 and 2030
Several imperatives are critical to success
The energy landscape is undergoing structural change. This structural change will take solid root in the decade of the 2020s and disrupt the energy landscape most acutely as tipping points propel intra- and interfuel substitutions onto steeper portions of their respective penetration curves. Regardless of the timing or direction of this transition, energy executives must prepare for this transition now. Several key imperatives are critical to observe.
Integrate scenario analysis and a tracking system into your strategic planning process. Scenario analysis remains the fundamental tool for strategic planning under uncertainty to test the robustness of strategy and to look for ways to create optionality and mitigate risk. Since no one can predict the future, setting up a disciplined approach to monitor signposts and track leading indicators is vitally important to providing early detection of coming disruptions.
Reassess your participation model to identify where best to compete,and repurpose your business model accordingly to identify how best to compete. Disruptions to the energy ecosystem will redefine traditional business boundaries and shift the basis of competition by pitting nontraditional competitors, new business models and structurally disparate assets. To prepare, you should:
examine your portfolio to identify potential stranded assets;
build (appropriately defined) scale that conforms to changing business boundaries;
incorporate a broader definition of who your competitors are; and
identify new business models that exploit emerging vertical and horizontal integration opportunities within and across energy value chains.
Leverage digital technology to reposition your ability to compete. Digital technology is restructuring the competitive landscape across the entire energy ecosystem. Participants have documented hundreds if not thousands of use cases. While these cases have registered impressive results, the real promise of digital lies in the potential to redefine the basis of competition. Winning digital strategies will define—or quickly align to—the new basis of competition and scale these results to create sustainable competitive advantage.
Think globally but act locally. Global trends and growing interlinkages will influence the future energy landscape increasingly across regions and between primary fuels. However, the competitive battles will take place on a local scale as fundamental fuel economics driven by respective cost curves interact over time with location-specific resource availability, regulations and climate patterns.
Build new competencies for a new age. In a fiercely competitive environment undergoing constant change, three capabilities stand out as indispensable to future success: innovation, agility and resilience. In this context:
Innovation is the ability to deploy valuable solutions in a timely manner. Companies must leverage an ever-broadening ecosystem of partnerships that include service providers, vendors, academics, start-ups and venture capitalists, and possibly their own corporate venture capital groups to identify, prioritize, perform due diligence and eventually scale new and competing technologies and applications.
Agility refers to the ability to react quickly to disruptions. Since the timing of disruptions is difficult to predict and the impact is distributed, companies must learn to deploy “agile at scale” to speed up entire organizations, not just individual projects.
Resilience refers to the ability to withstand turbulence. Executives must develop business models and design operating models that allow them to bounce back from disturbances or move to a more desirable state without inordinate effort.
Adopt more flexible financial return metrics. For many energy companies, investments in alternative value chains—or different parts of their respective value chains—come with lower expected financial returns due to dissimilar risk-reward profiles. For example, for oil and gas players, investments in renewables come with lower expected returns (commensurate with less risk) than their legacy businesses. In these situations, executives must target lower returns for these investments. In addition, executives should think of initial investments in new spaces in the context of a broader ambition: building the capabilities and knowledge required to deploy at scale. In this situation, executives should be willing to accept returns below the midpoint in the new industry if they are building capabilities for the long term. For example, corporate venture capital should not be constrained by financial return targets common to the venture capital industry. Strategic, not financial, concerns should be the primary driver of corporate venture capital investments; likewise for initial investments in new industries. For many companies, these more flexible financial return metrics will present an operational challenge. Moreover, for many executives, these more flexible financial return metrics may be perceived as irrational, which will present a communications challenge to external stakeholders and even their boards, as these new investments will lower the overall returns of the corporation.
Where and how companies choose to participate in the energy market will be critical to their success in the long term. What is becoming increasingly clear is that the choices they face are multiplying and starting to include previously unrelated businesses—and in most cases threatening their legacy businesses. It is time now for industry executives to devote themselves to the strategic questions that will ensure their survival and set them up to thrive in the coming era of hypercompetitiveness.
Jorge Leis is a partner with Bain & Company’s Oil & Gas practice, which he formerly led in the Americas. He is based in Houston.
The author gratefully acknowledges Dave Rennard, a manager in London, Kristine Grigsby, a manager in Oslo, Lara Bekhazi, a consultant in Oslo, Luca Bidinelli, a consultant in Amsterdam, Jenny Isaksson, a consultant in Copenhagen, and Mina Nasrallah, an associate consultant in Dubai, for their contributions to this work.