
Report


|
Executive summaryIndia is a critical consumption engine globally, poised to capture one in eight incremental consumption dollars over the next five years. In 2025, overall consumption and discretionary spending reaccelerated following a temporary period of moderation post-Covid-19. Private consumption growth increased from 8% (2022–24) to 10.5% (2025). Growth was supported by government-led policy interventions, including a reduction in the Goods and Services Tax (GST) for select categories, personal income tax relief, easing inflation, and lower lending rates. Written in collaboration withWritten in collaboration with
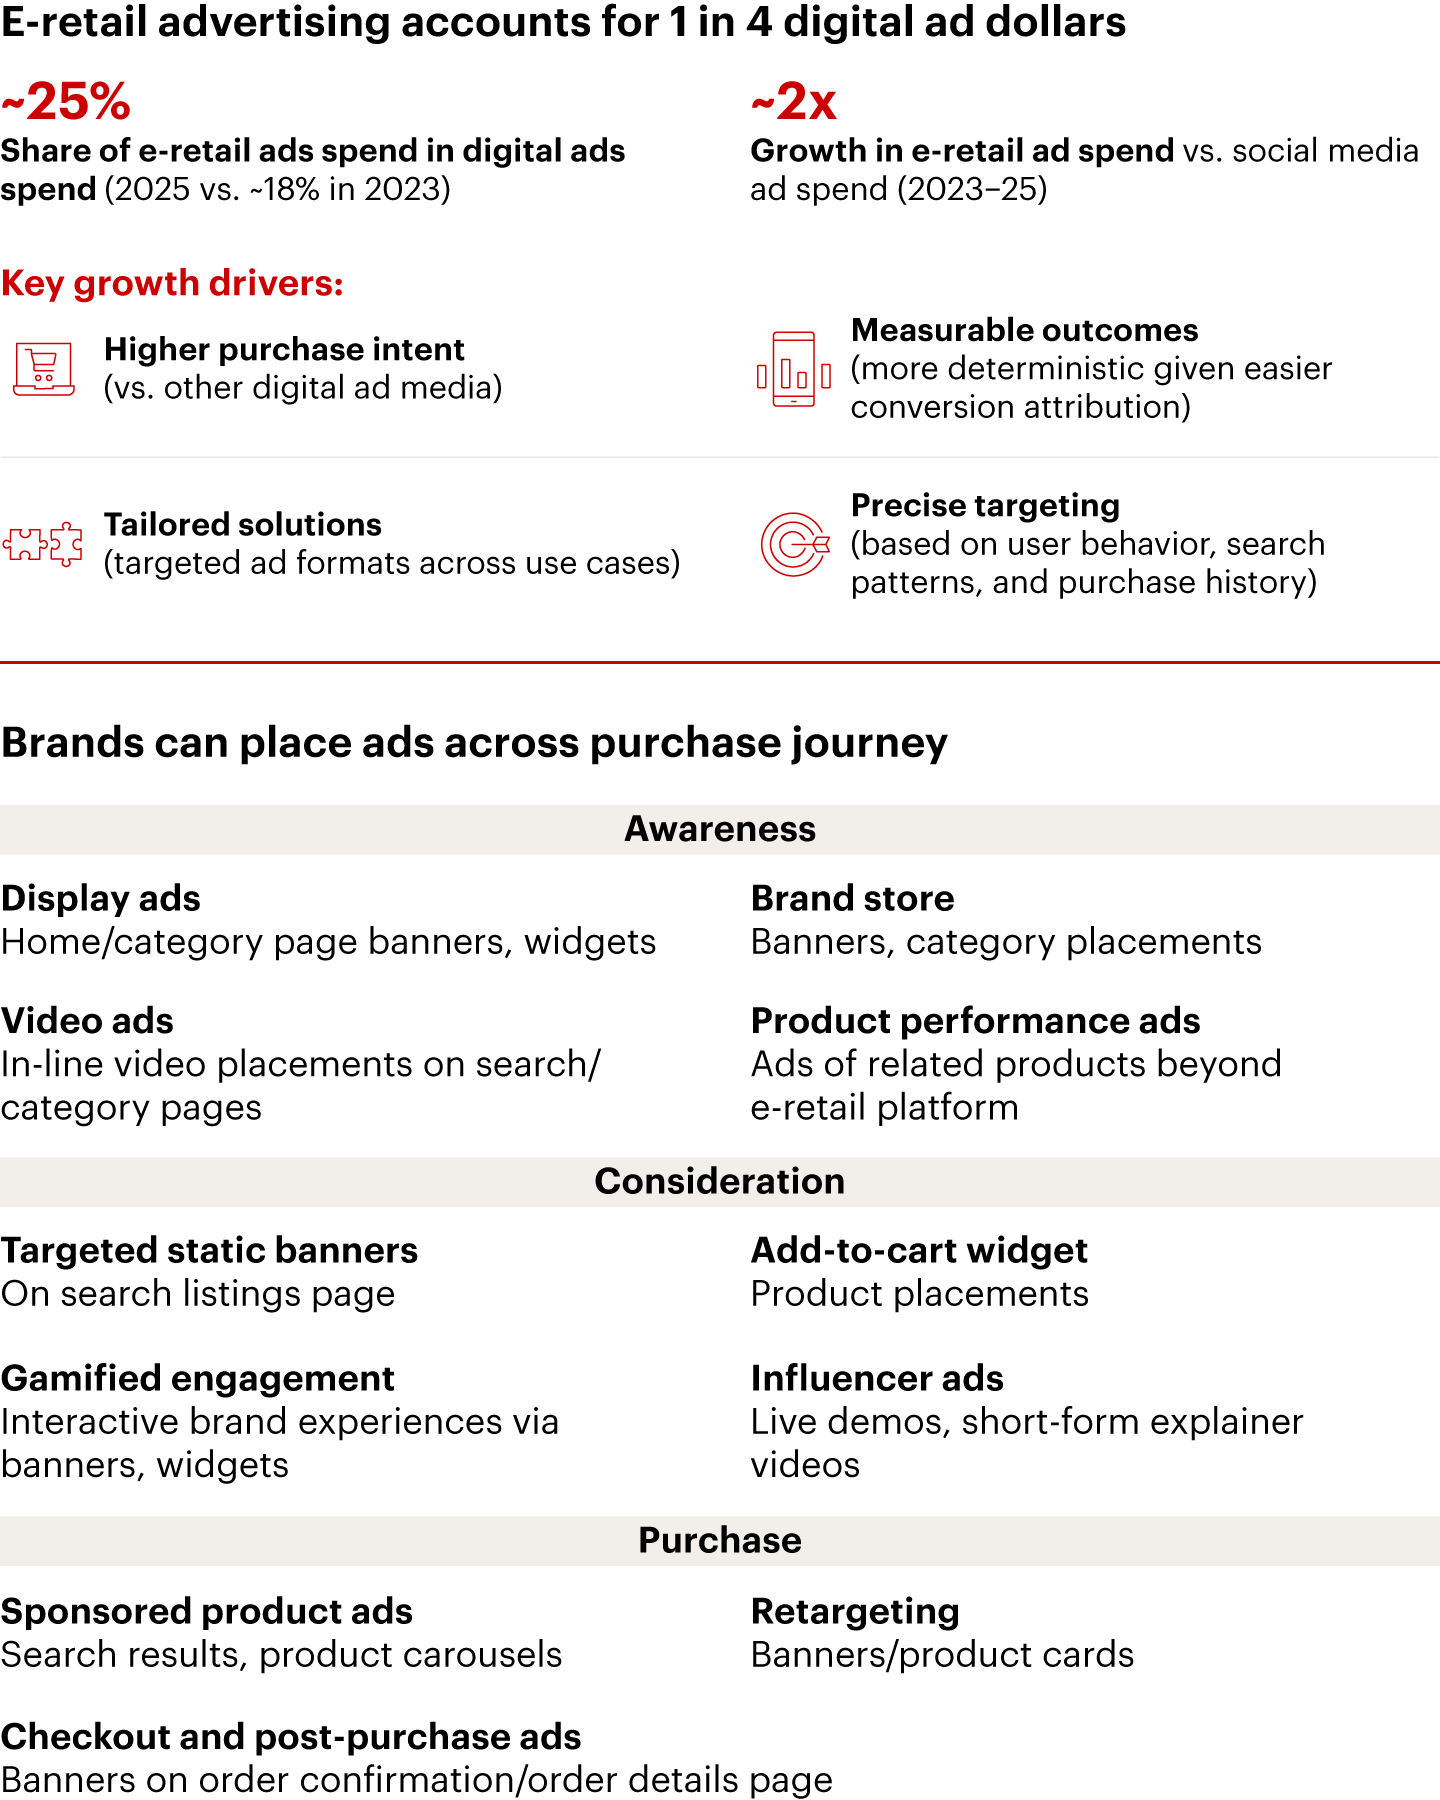
E-retail mirrored the broader consumption revival, scaling to $65–$66 billion in gross merchandise value (GMV) in 2025. The market grew at 19%–21% CAGR, with significantly faster growth in the second half of the year and sustained momentum in Q1 2026, in line with broader consumption patterns. E-retail growth over the past five years has been supported by increases in the number of both consumers and sellers. The e-retail market more than doubled over the past five years, accompanied by shoppers doubling to reach 290–300 million. Gen Z, Tier 2+ cities, and middle-income households led incremental shopper growth. Gen Z has emerged as a sizable cohort, now accounting for 40%–45% of e-retail shoppers. Simultaneously, Bharat (Tier 2+ cities) has become a key cohort, contributing approximately half of incremental e-retail orders in 2025. The seller base also tripled over the past five years, with a sizable share emerging from Tier 2+ cities. The evolution of e-retail in India is underpinned by improvements in the customer value proposition across access (i.e., reach and speed), affordability, assortment, and discovery. Leading platforms are increasingly anchoring on value, mirroring global trends where players such as Pinduoduo, Shein, and Shopee have captured a disproportionate share of organized retail by growing over 1.5x faster than the market. E-retail in India has significant headroom, accounting for roughly 1.6% of GDP in 2025 compared to 4%–4.5% in Indonesia and 13%–14% in China. This upside is largely driven by grocery—the largest component of retail—which remains structurally underpenetrated online. Building on momentum from the second half of 2025, India’s e-retail market is expected to sustain a more than 20% CAGR and scale to $170–$180 billion in GMV by 2030. By the end of the decade, more than one in ten retail dollars and one in four non-grocery retail dollars are expected to be spent online. Growth will partially be driven by continued gains in shopper penetration. India’s e-retail shopper penetration is approximately 30% of Internet users, which trails mature markets such as China (92%) and the United States (74%). There is significant headroom in shopper penetration, even at current Internet penetration levels. For example, shopper penetration in Indonesia is nearly twice that of India, despite similar levels of Internet adoption. Higher levels of shopper penetration are certainly possible in India. In mature metro cities such as Bengaluru and Hyderabad, more than seven in ten Internet users already shop online. Moreover, a majority of the next 500 million online shoppers are already in the digital funnel. Two-thirds of chat and social media users are yet to shop online. E-retail shopper growth will be complemented by an increase in spend per shopper as affluence increases. India’s GDP per capita is expected to surpass $4,000 by 2030, which has been a key inflection point for discretionary spending in other markets. In China and Indonesia, for example, growth in GDP per capita has driven substantial increases in e-retail spend per shopper. This trend is already evident in India: In top metro cities, where GDP per capita is about $8,500, spend per shopper is about 65% higher than the national average. E-retail journeys continue to evolve, becoming more targeted and deterministic. Improvements in personalization and advertising relevance are fueling purchase consideration. Brands are increasingly considering e-retail advertising as a core component of their advertising strategies, with e-retail ads accounting for roughly 25% of digital ad spend in 2025. This year, we are highlighting two trends in e-retail: Quick commerce (Q-commerce) and conversational commerce. Q-commerce (delivery in less than 30 minutes): India has emerged at the forefront of Q-commerce globally, scaling to $10–$11 billion GMV, supported by structural factors such as high population density, low manpower and real estate costs, and low online grocery penetration. Q-commerce is expanding the overall e-retail pie by accelerating e-grocery adoption. Since Q-commerce’s launch in 2020, e-grocery penetration has increased fivefold and now accounts for approximately 1.5% of the overall grocery market. In Metro cities—the core market for Q-commerce—share of e-grocery has reached 6%–7%. While traditional e-retail remains core (over 80% of overall e-retail market), Q-commerce in India has doubled annually over the past two years and is projected to reach $65–$70 billion by 2030. Overall, Q-commerce is projected to contribute 45%–50% of incremental e-retail GMV over the next five years. Q-commerce plays a dual role. It serves as a convenience channel for household essentials (which account for 85%–90% of GMV), where speed is table stakes. In addition, it is a fulfillment channel for discretionary categories, positioning speed as a customer-delight lever and trust marker. Key players are looking to scale non-grocery categories and expand their micro-fulfillment center networks. The micro-fulfillment center network rapidly expanded to more than 7,000 centers, with two-thirds of new center additions concentrated in top 10 cities. Scale and demand density have improved profitability. However, customer adoption and profitability beyond top Metro and Tier 1 cities remain unproven. Q-commerce is geared towards shopping missions that are led by predetermined needs with sub-five-minute session durations vs. more than ten minutes in e-retail and eight times higher visit-to-order conversion. This is reflected in a higher share of search-led GMV, fewer product pages viewed per order, and lower reliance on cash-on-delivery compared to traditional e-retail. Q-commerce is also characterized by top-up missions, resulting in lower average order value and smaller pack sizes. Brands and sellers can capitalize on the nature of Q-commerce shopping missions by tailoring assortment at the micro-market level and optimizing marketing to secure first-screen visibility and capture high-intent moments. Conversational commerce (assisted shopping powered by AI): Generative artificial intelligence (generative AI) adoption is accelerating rapidly, with large language models (LLMs) reaching 50 million monthly active users faster than earlier digital innovations. India is the world’s second-largest market for ChatGPT, with the user base growing approximately 4.5x in 2025 to reach more than 160 million monthly active users. Gen Z accounts for about one-third of users. Generative AI in the form of conversational commerce has the potential to evolve retail journeys beyond “search and browse” to “describe and get.” While conversational commerce is rarely used for end-to-end shopping today, there are early adoption use cases in research and product comparison. Overall, conversational commerce is nascent, and e-retailers and LLMs are experimenting along two parallel paths. E-retailer-led agents (e.g., Amazon’s Rufus and Flipkart’s conversational commerce engine) are enabling discovery and aiding conversion, while LLM-led shopping agents (e.g., Instant Checkout by ChatGPT) are shaping discovery and consideration. Brands, sellers, and e-retailers should closely watch this emerging space. Traditional e-retailers are likely to maintain their dominance as conversational commerce evolves, protected by strategic moats in brand trust, product fulfillment, and value-added offerings. India’s e-retail market: Poised for the next wave of expansion
Figure 1
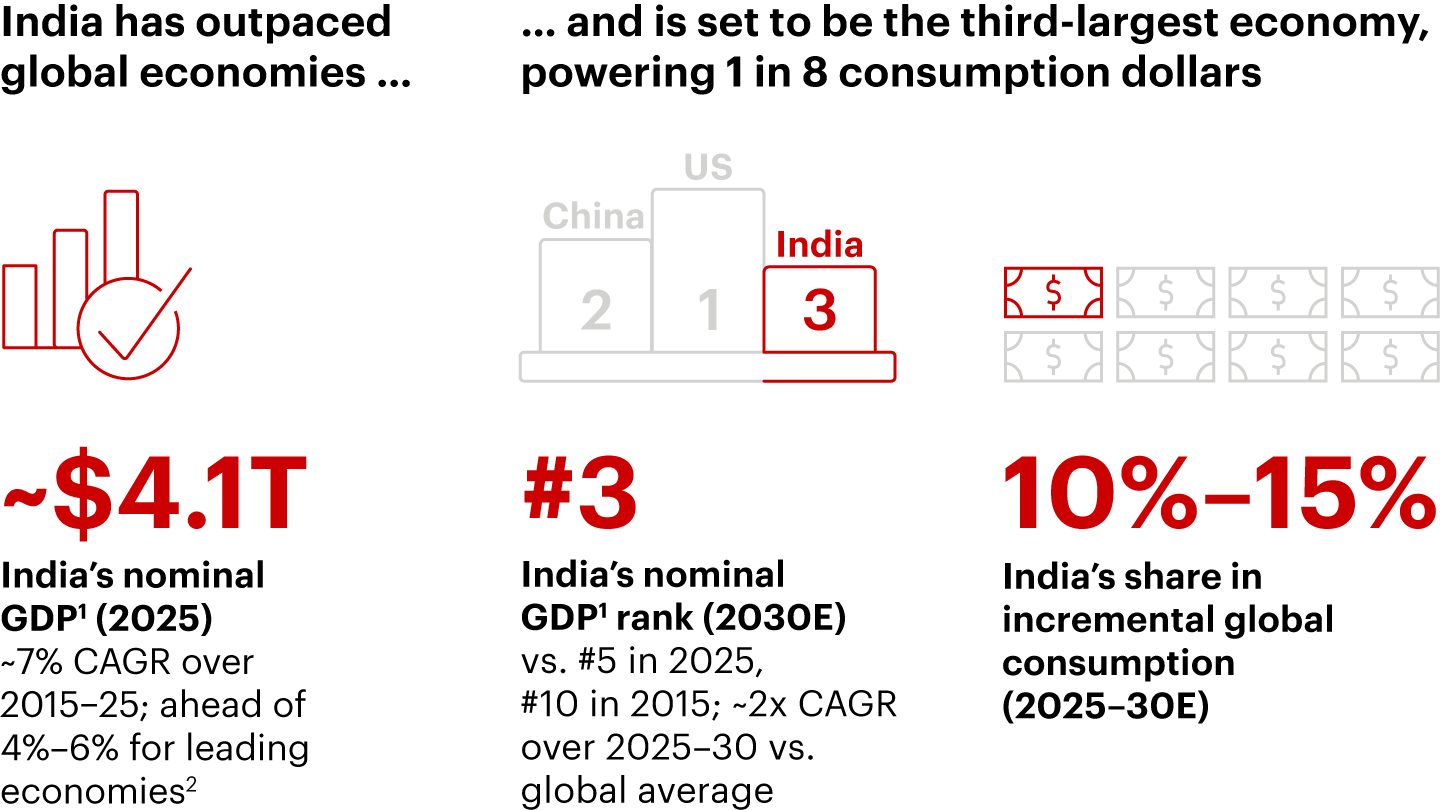

Notes: 1) Gross domestic product at current prices (USD); 2) US, China, and Germany Sources: International Monetary Fund (IMF) World Economic Outlook (October 2025); IHS Markit; market participant interviews; Bain analysis
Figure 2
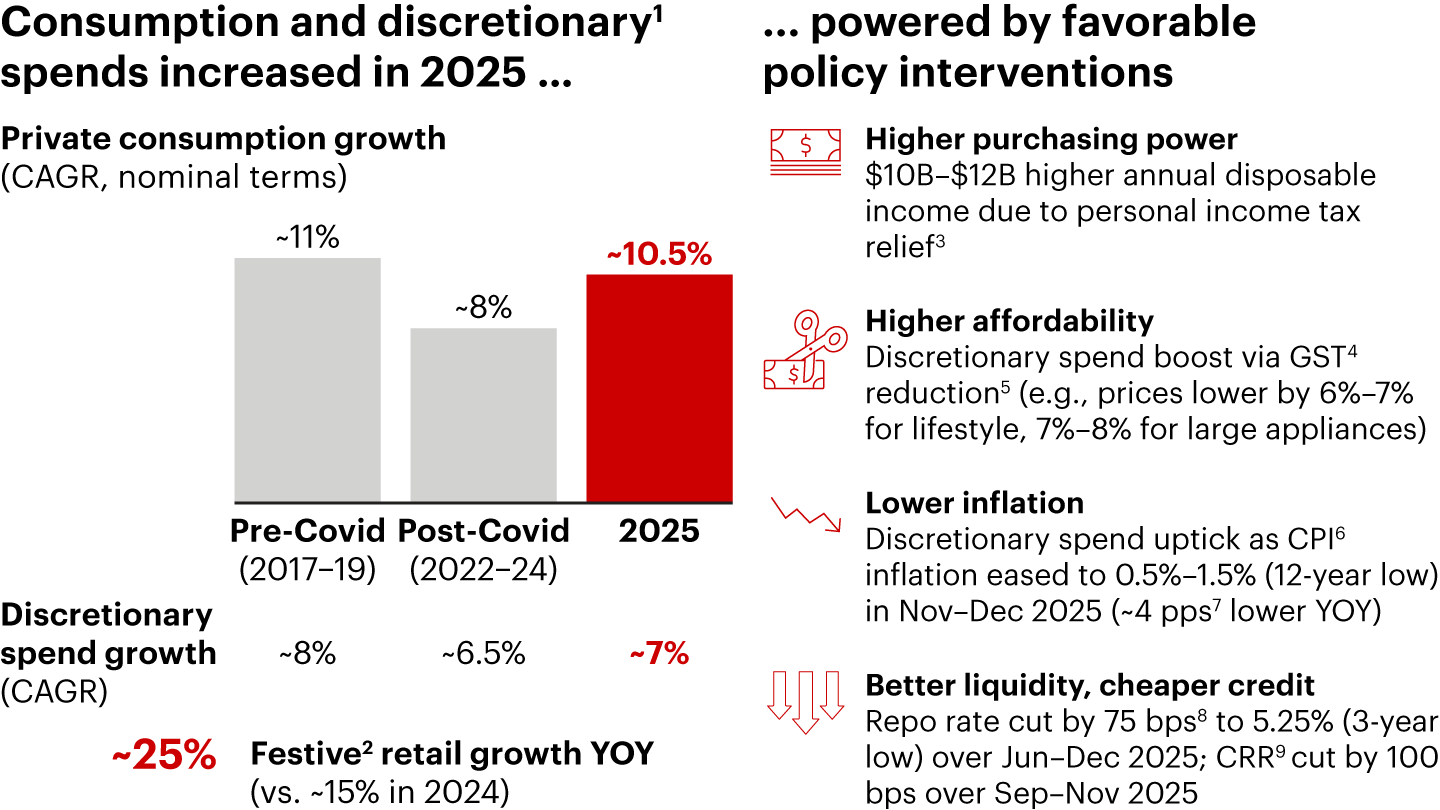

Notes: 1) Includes large appliances, electronics, lifestyle, home, and furniture; 2) Refers to Diwali sale in October 2025; 3) Rise in zero tax liability threshold for individuals—up to ~INR 1.2M per year; 4) Goods and Services Tax; 5) GST cuts effective from September 22, 2025; 6) Consumer Price Index; 7) Percentage points; 8) Basis points; 9) Cash Reserve Ratio Sources: Forrester; CAIT; Union Budget 2025–26 report; CGST Notification September 2025; Crisil report (“Consumption Sectors Set for GST Boost”) October 2025; MoSPI; RBI; market participant interviews; Bain analysis
Figure 3
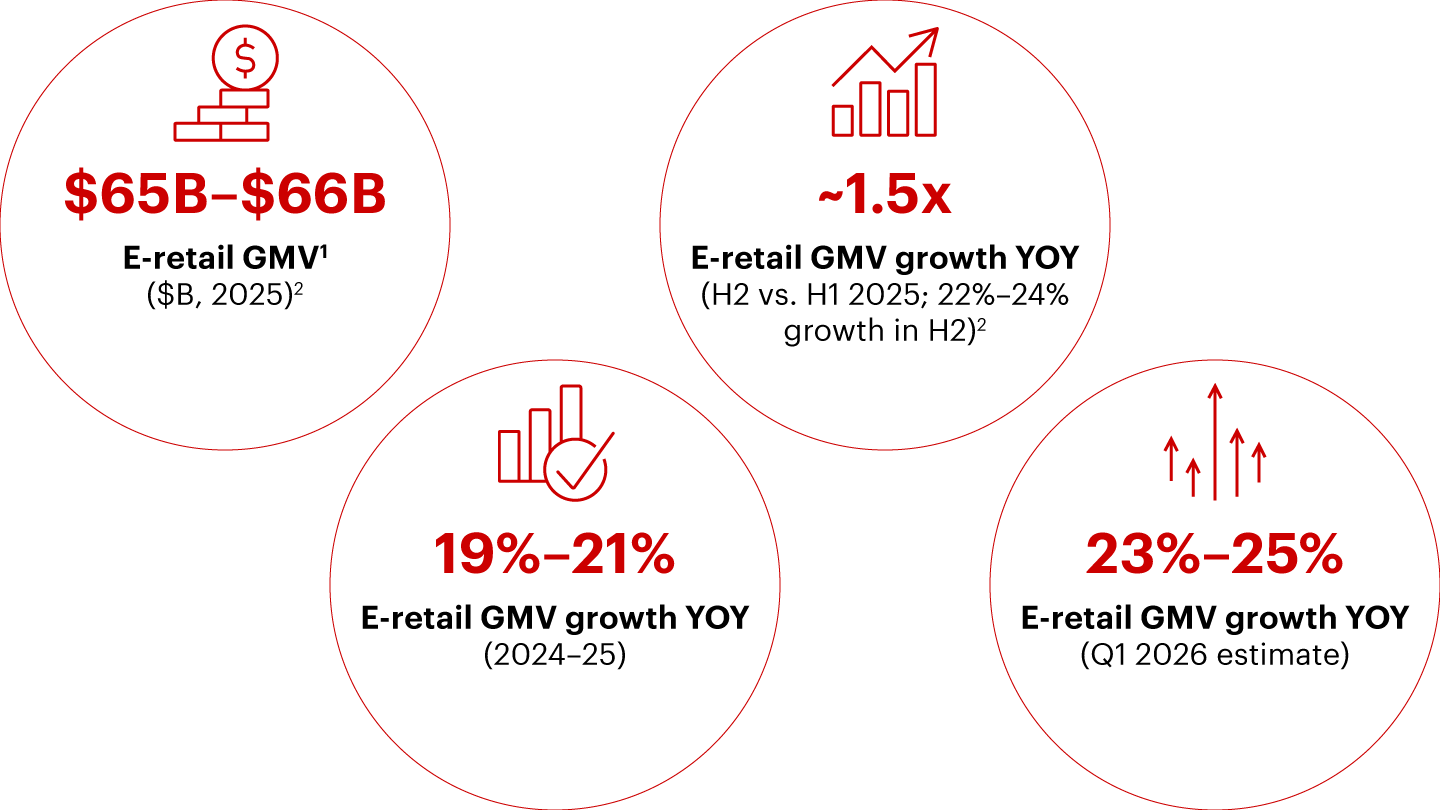

Notes: 1) Gross merchandise value for all retail categories, excluding travel; 2) Exchange rate: 1 USD = INR ~87 Sources: Crisil; Forrester; Netscribes; Flipkart market research data; market participant interviews; Bain analysis
Figure 4
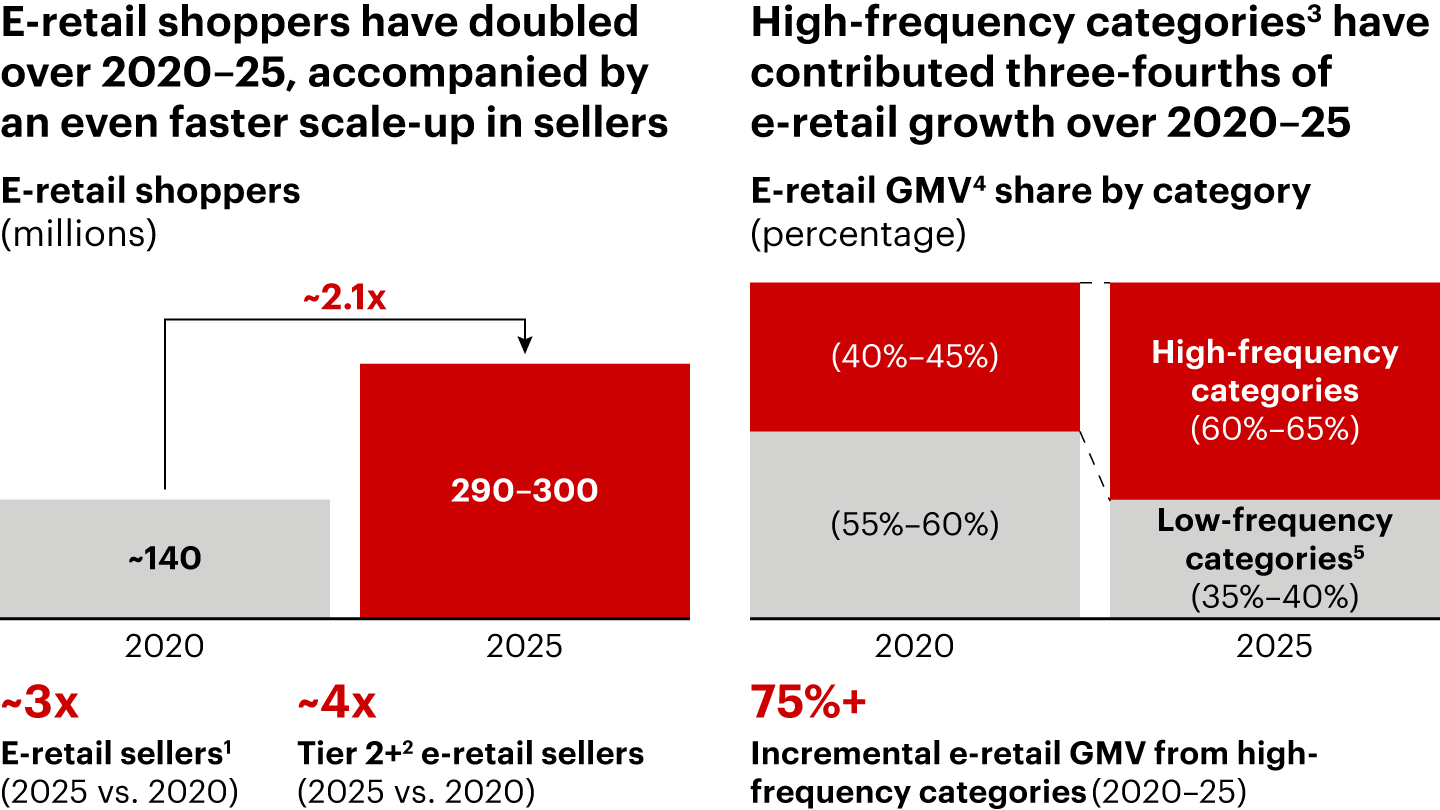

Notes: 1) Transacting seller base; 2) Metro/Tier 1 covers top ~50 cities based on population (typically >1 million), Tier 2+ covers remaining towns; 3) Includes groceries, lifestyle, beauty and personal care, general merchandise, and home; 4) Gross merchandise value for all retail categories; 5) Includes mobiles, electronics, and appliances Sources: Forrester; Netscribes, Crisil; company publications; market participant interviews; Bain analysis
Figure 5
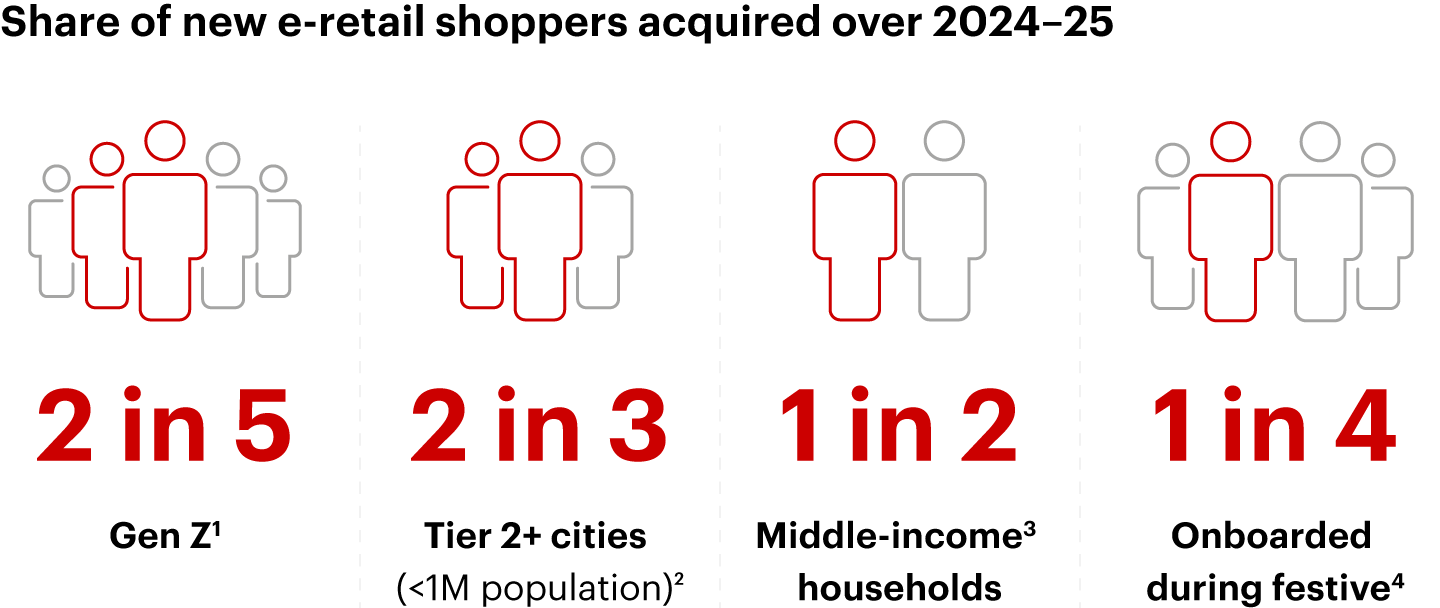

Notes: 1) Individuals born between 1997 and 2012; 2) Metro/Tier 1 covers top ~50 cities based on population (typically >1 million), Tier 2+ covers remaining towns; 3) Households with average annual income of INR 0.6–0.75 million determined based on households classified as NCCS B under the New Customer Classification System (based on education of chief wage earner of the household and number of consumer durables owned by the household); 4) Sep–Oct 2025 Sources: Emarketer; Forrester; market participant interviews; Bain analysis
Figure 6
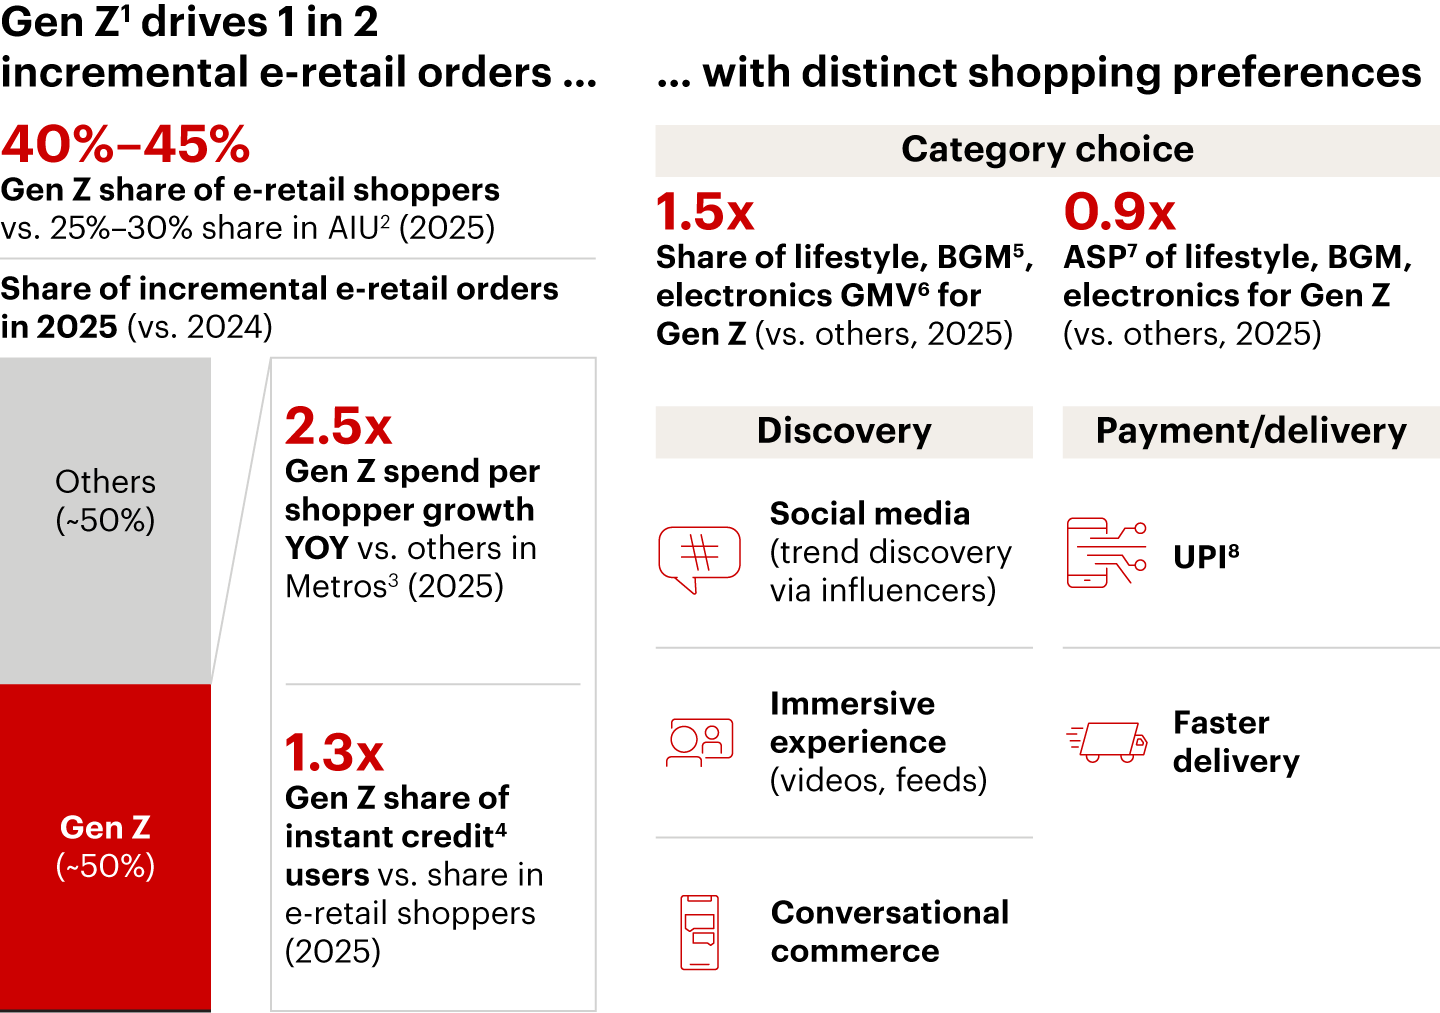

Notes: 1) Individuals born between 1997 and 2012; 2) Active Internet users; 3) Top eight cities by population; 4) Based on buy now, pay later offering; 5) Includes beauty and personal care and other general merchandise; 6) Gross merchandise value for all retail categories; 7) Average selling price; 8) Unified Payments Interface Sources: ICUBE 2025; market participant interviews; Bain analysis
Figure 7
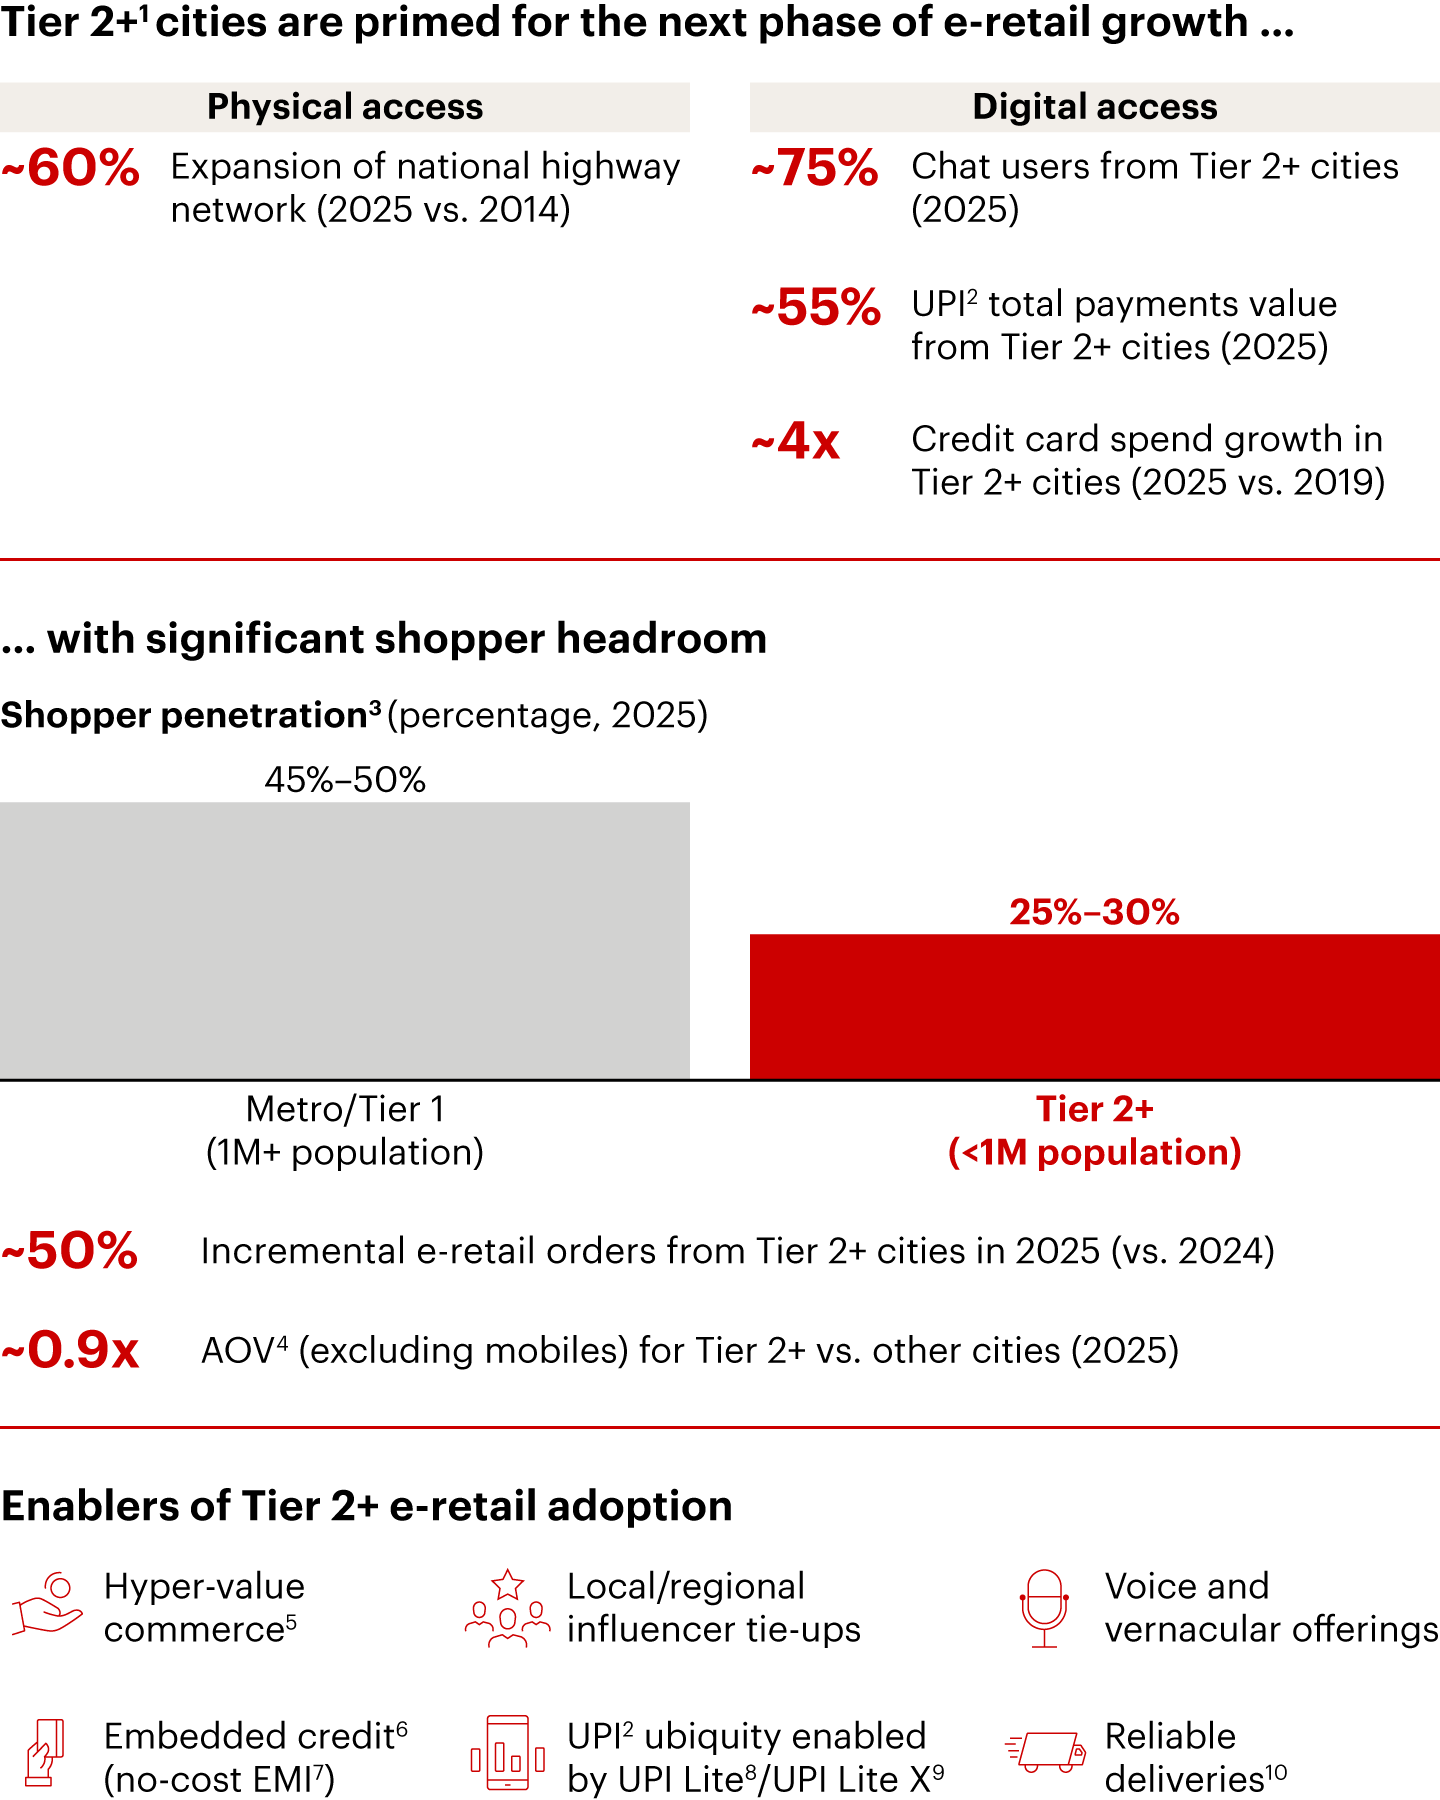

Notes: 1) Metro/Tier 1 covers top ~50 cities based on population (typically >1 million), Tier 2+ covers remaining towns; 2) Unified Payments Interface; 3) E-retail shoppers as percentage of Internet users; 4) Average order value; 5) Ultra-low price point assortment (especially in lifestyle and general merchandise); 6) Credit offered contextually within a non-financial product or service, enabling users to transact now and pay later; 7) Equated monthly installments; 8) UPI feature for quick, low-value payments without PIN, using stored balance; 9) Enhanced version of UPI Lite for small-value payments without PIN and Internet; 10) Adherence to delivery promise Sources: NPCI; RBI; TRAI; Forrester; Sensor Tower; ICUBE 2022 and 2025; Ministry of Road Transport and Highways of India (MoRTH); company publications; market participant interviews; Bain analysis
Figure 8
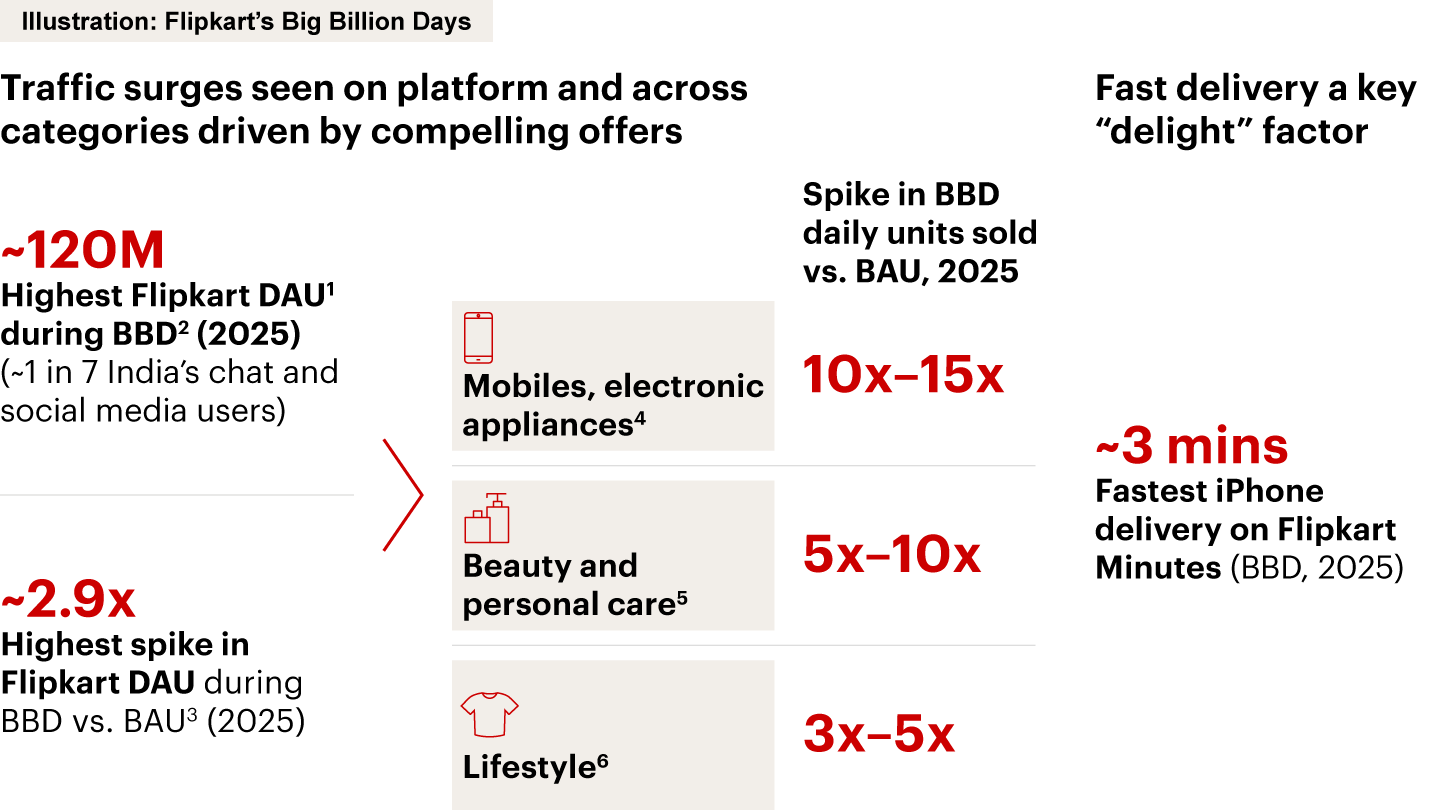

Notes: 1) Daily active users; 2) Flipkart’s Big Billion Day sale from Sep 22, 2025–Oct 2, 2025; 3) Business as usual days over Jul–Aug 2025; 4) Examples include mobiles, televisions; 5) Examples include body lotion, foundation, face wash; 6) For example, watches Sources: Flipkart company data; Bain analysis
Figure 9
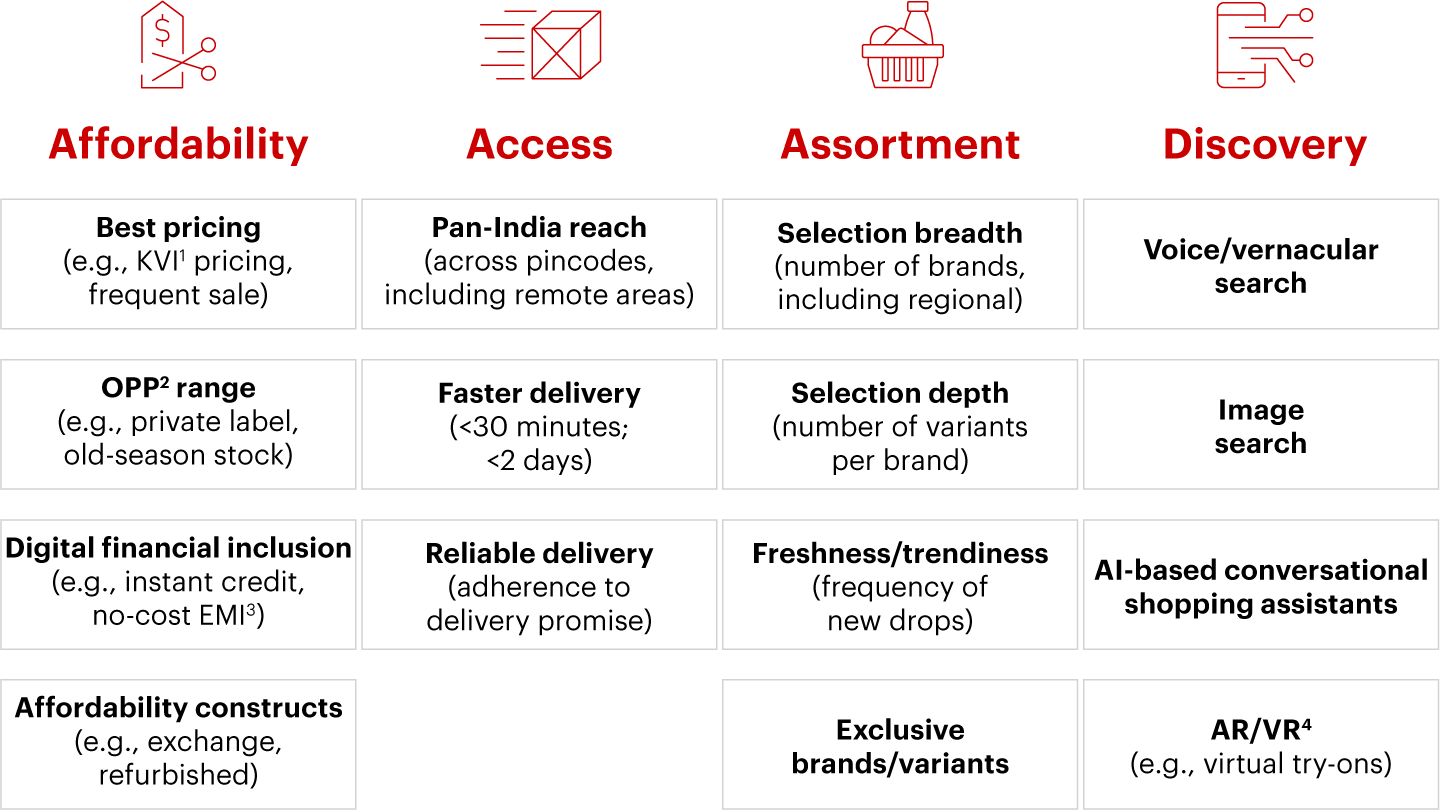

Notes: 1) Key Value Items bought frequently with prices easy to compare across stores/platforms; 2) Opening price point; 3) Equated monthly installments; 4) Augmented reality/virtual reality Source: Market participant interviews
Figure 10
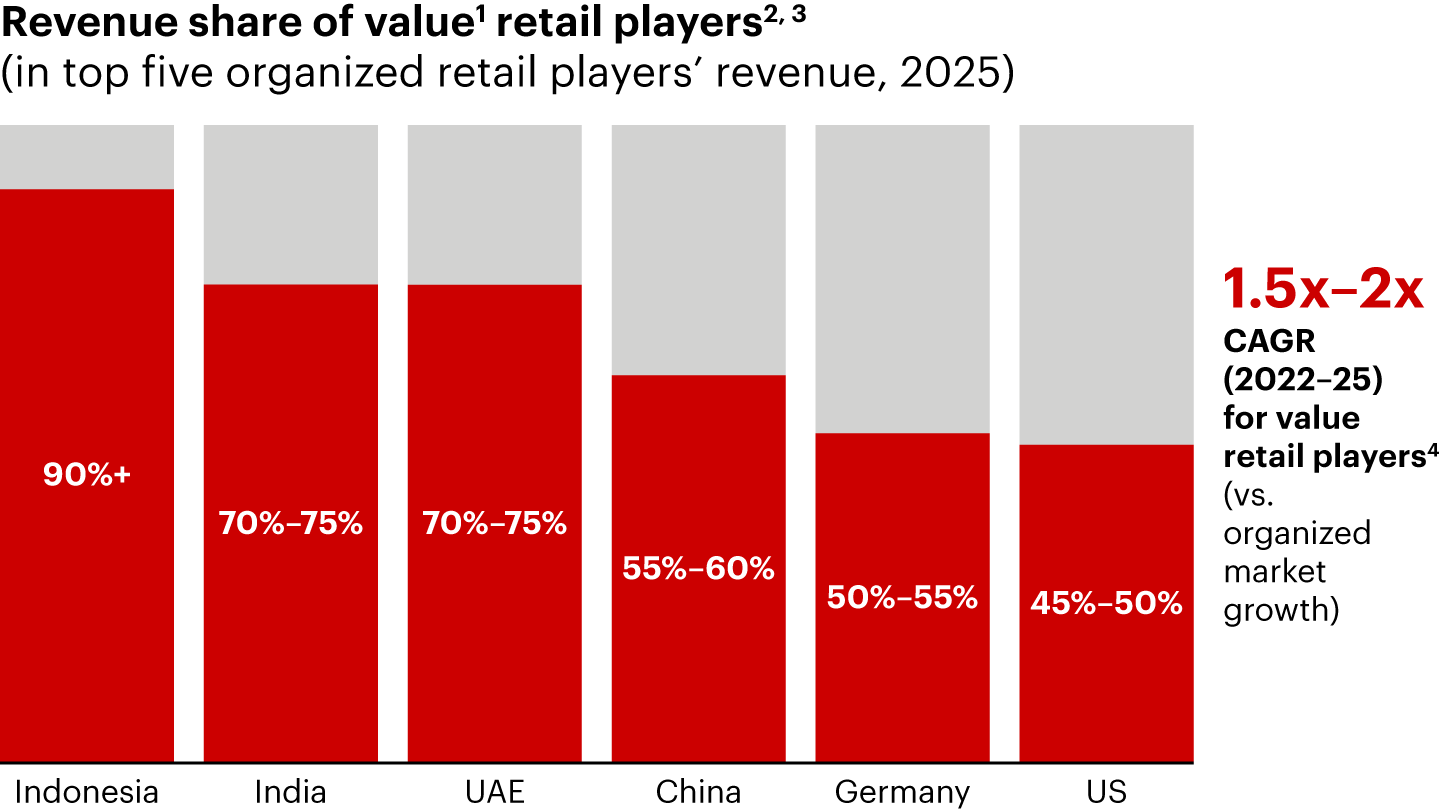

Notes: 1) Players with a significant focus on entry and mass price points across categories (with very low share of mass-premium and premium assortment); 2) Key players: Indonesia: Shopee, ByteDance (Tokopedia), Alfamart, Indomaret; India: Flipkart Group (excluding Myntra), Reliance Group (excluding Ajio Luxe), D-Mart and Meesho; UAE: Shein, Lulu Group, Carrefour, Landmark Group (Viva, Max, Splash); China: Pinduoduo, Taobao, ByteDance (Douyin); Germany: Schwarz (Lidl), Aldi, Edeka (Netto), Rewe Group (Penny); US: Walmart (incl. Sam’s Club), Costco; 3) GMV considered for online players and revenue for offline players; 4) Considering value retail players within top five organized retail players across the six markets Sources: Flywheel Retail Sales Data; market participant interviews; Bain analysis
Figure 11
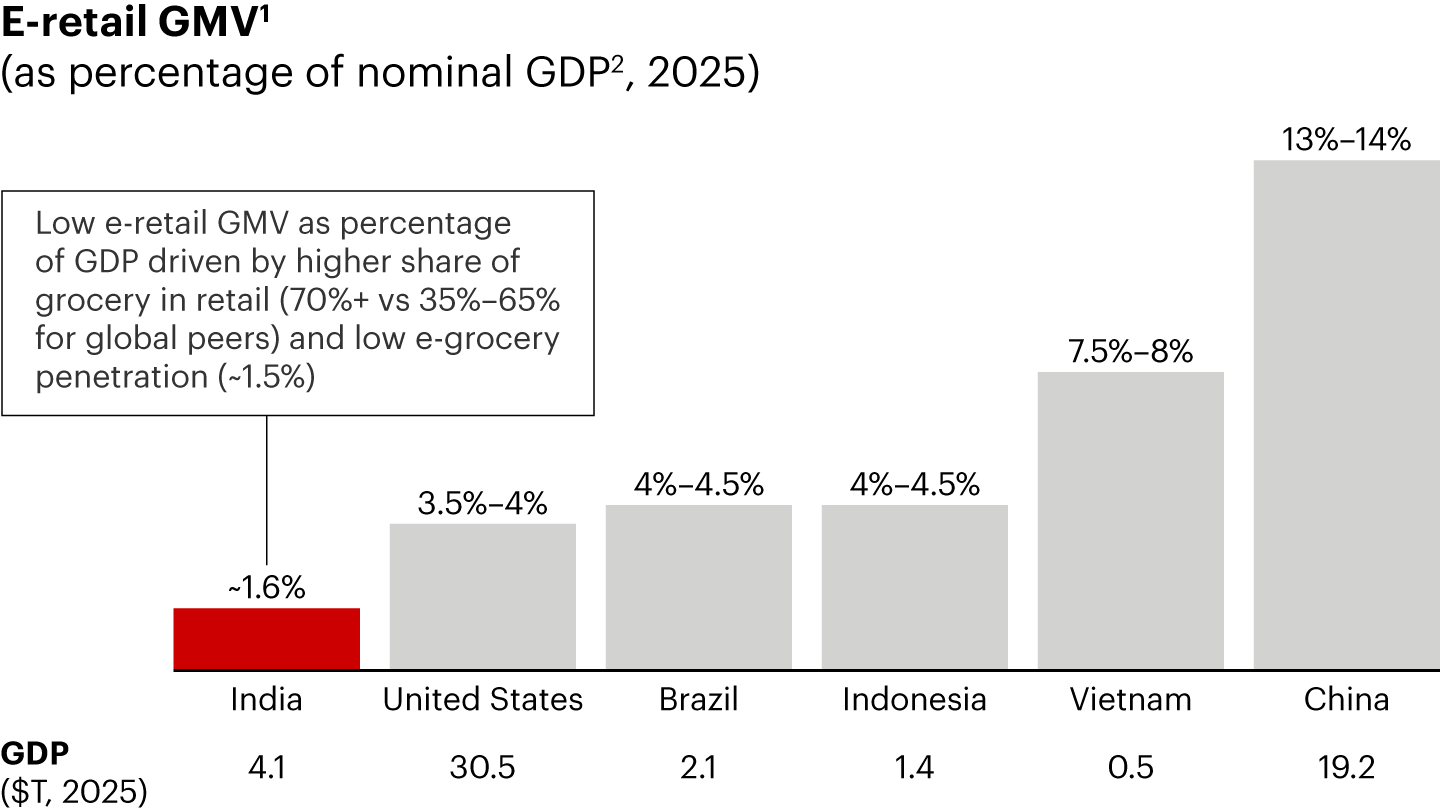

Notes: 1) Gross merchandise value for all retail categories; 2) Gross domestic product at current prices (USD) Sources: IMF World Economic Outlook (April 2025); Flywheel; Bain & Company report, Singles Day Report (China, 2025) – China’s Global Push in E-retail; GlobalData; market participant interviews; Bain analysis
Figure 12
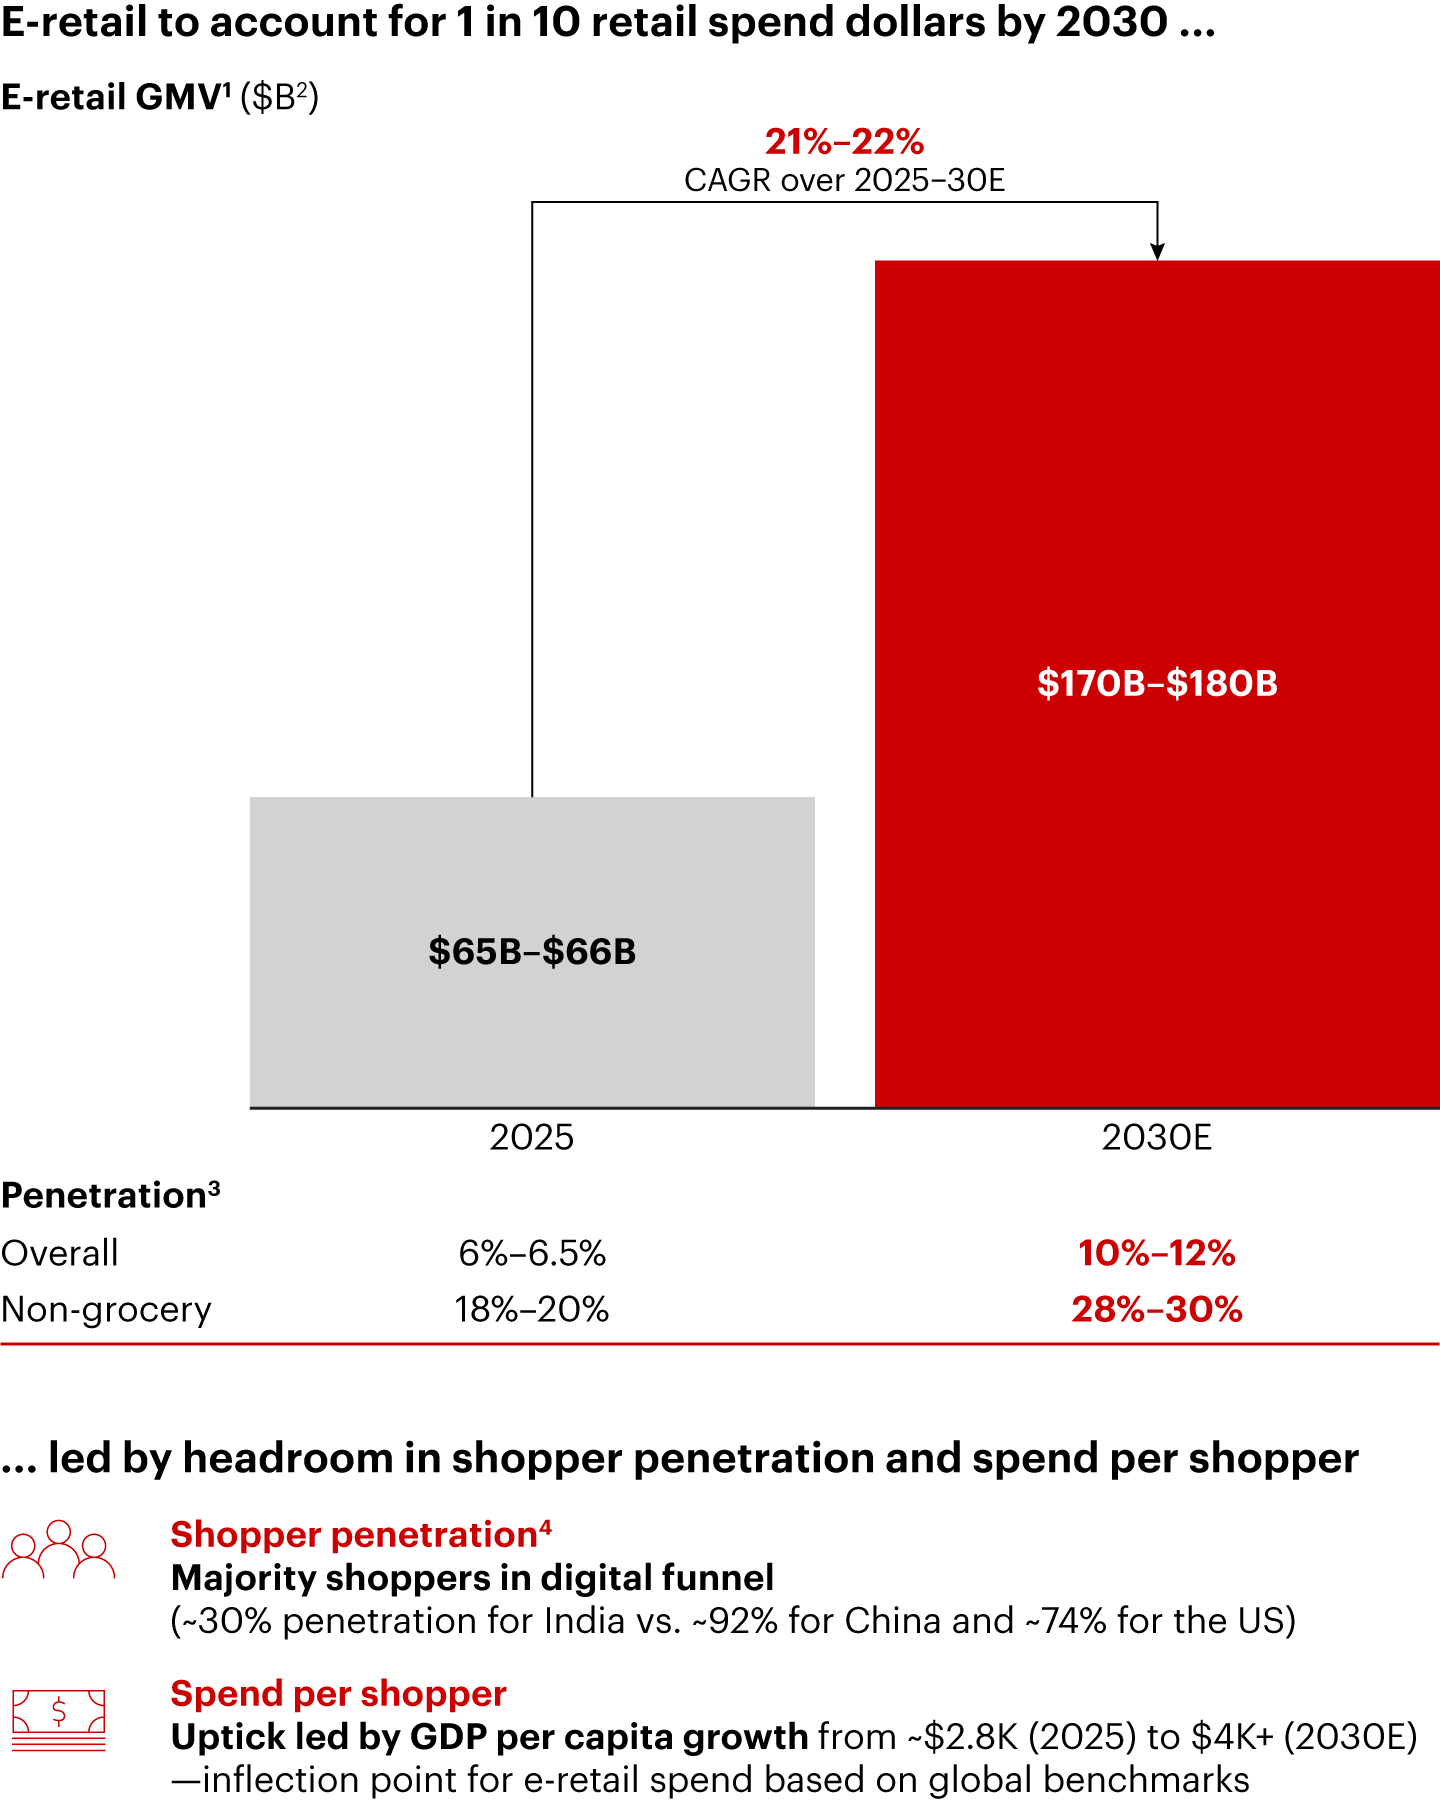

Notes: 1) Gross merchandise value for all retail categories, excluding travel; 2) Exchange rate: 1 USD = INR ~87; 3) E-retail GMV as a percentage of total retail market; 4) E-retail shoppers as a percentage of Internet users Sources: Crisil; Forrester; Netscribes; IMF; Flipkart market research data; market participant interviews; Bain analysis
Figure 13
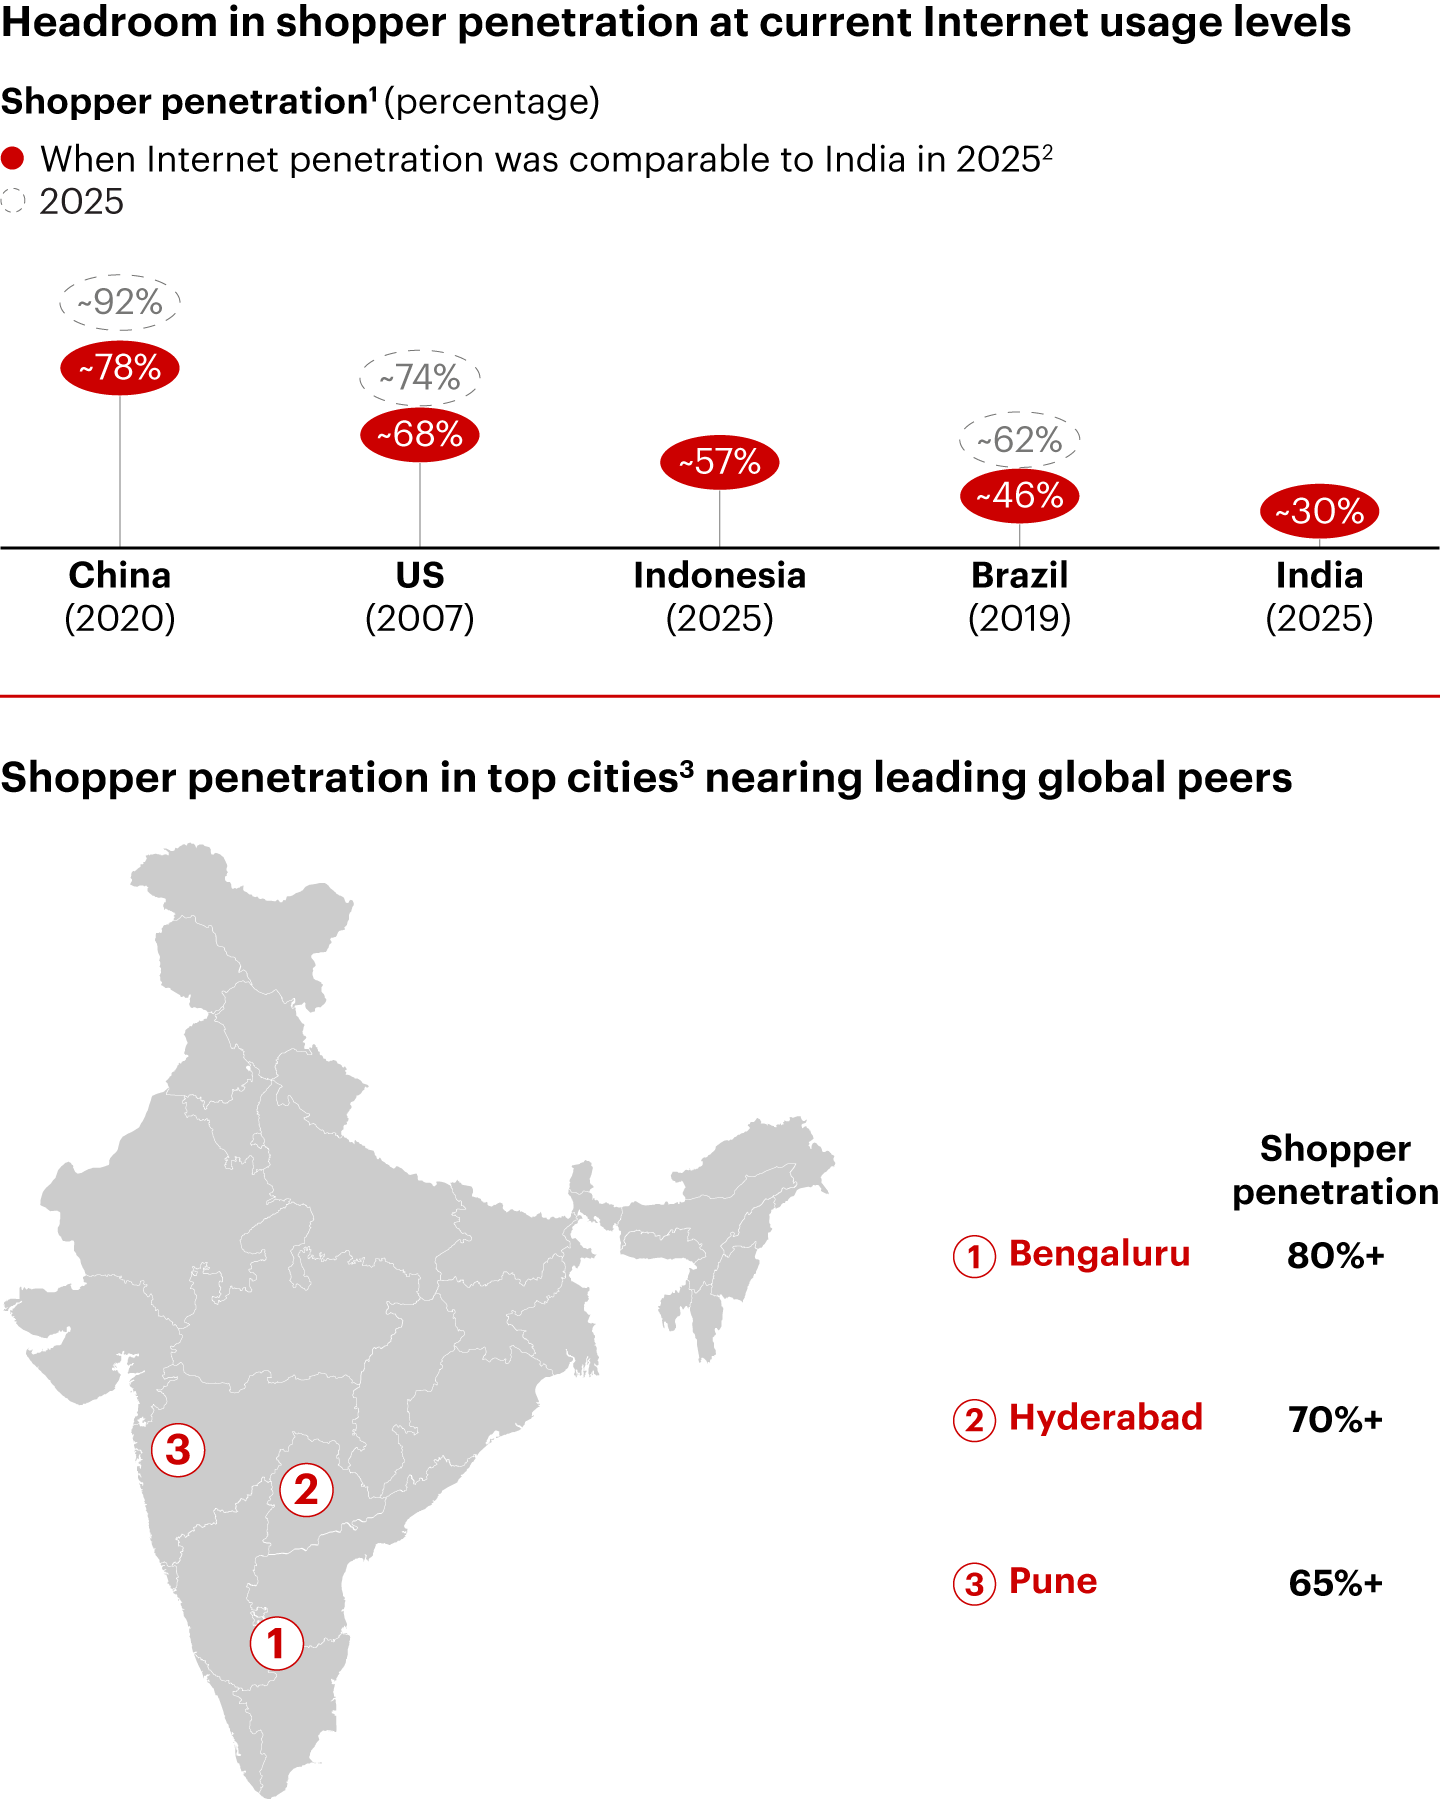

Notes: 1) E-retail shoppers as percentage of Internet users; 2) Considers users with access to wireless/wired subscription in India as of June 2025 as a percentage of population; 3) Top cities by population Sources: Forrester; ICUBE 2025; market participant interviews; Bain analysis
Figure 14
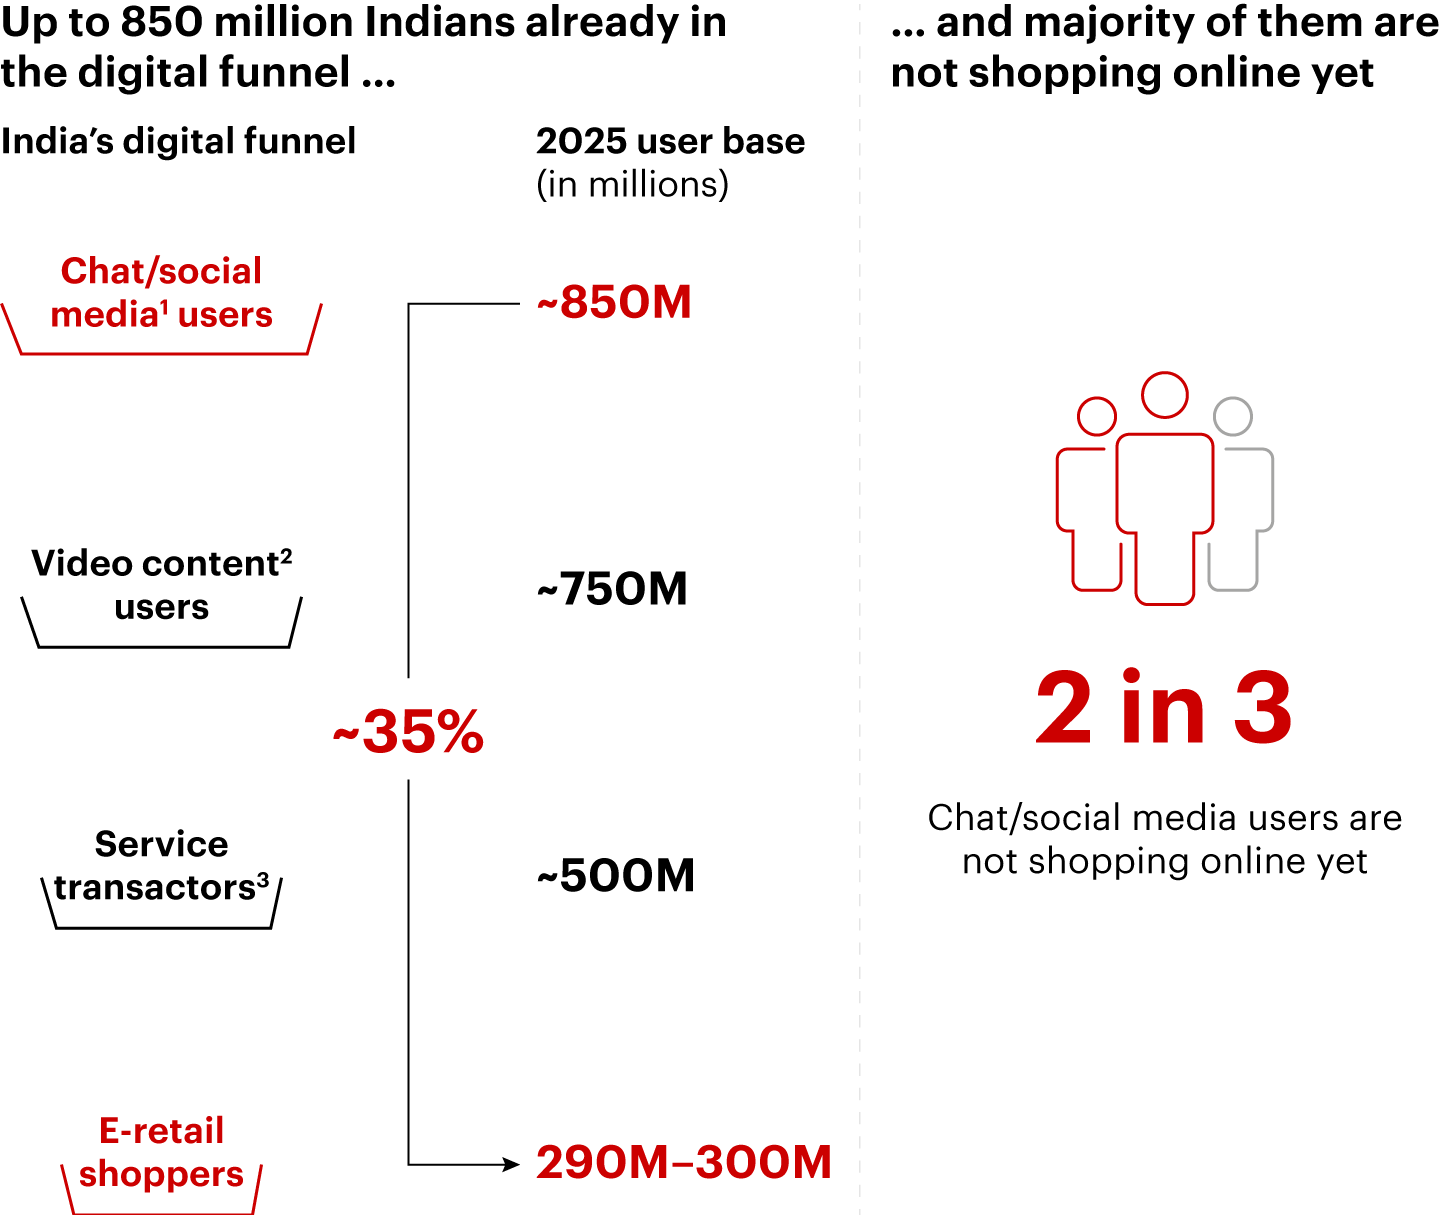

Notes: 1) Unique users of chat (including voice, video, email) or social media at least once in 30 days basis, WhatsApp monthly active users (MAU) for Jan–Nov 2025; 2) Unique users of video, music, podcast, or over-the-top content at least once in 30 days basis YouTube MAU for Jan–Nov 2025; 3) Unique users of UPI as of Jun 2025 Sources: TRAI; NPCI; Press Information Bureau of India; Sensor Tower; ICUBE 2025; market participant interviews; Bain analysis
Figure 15
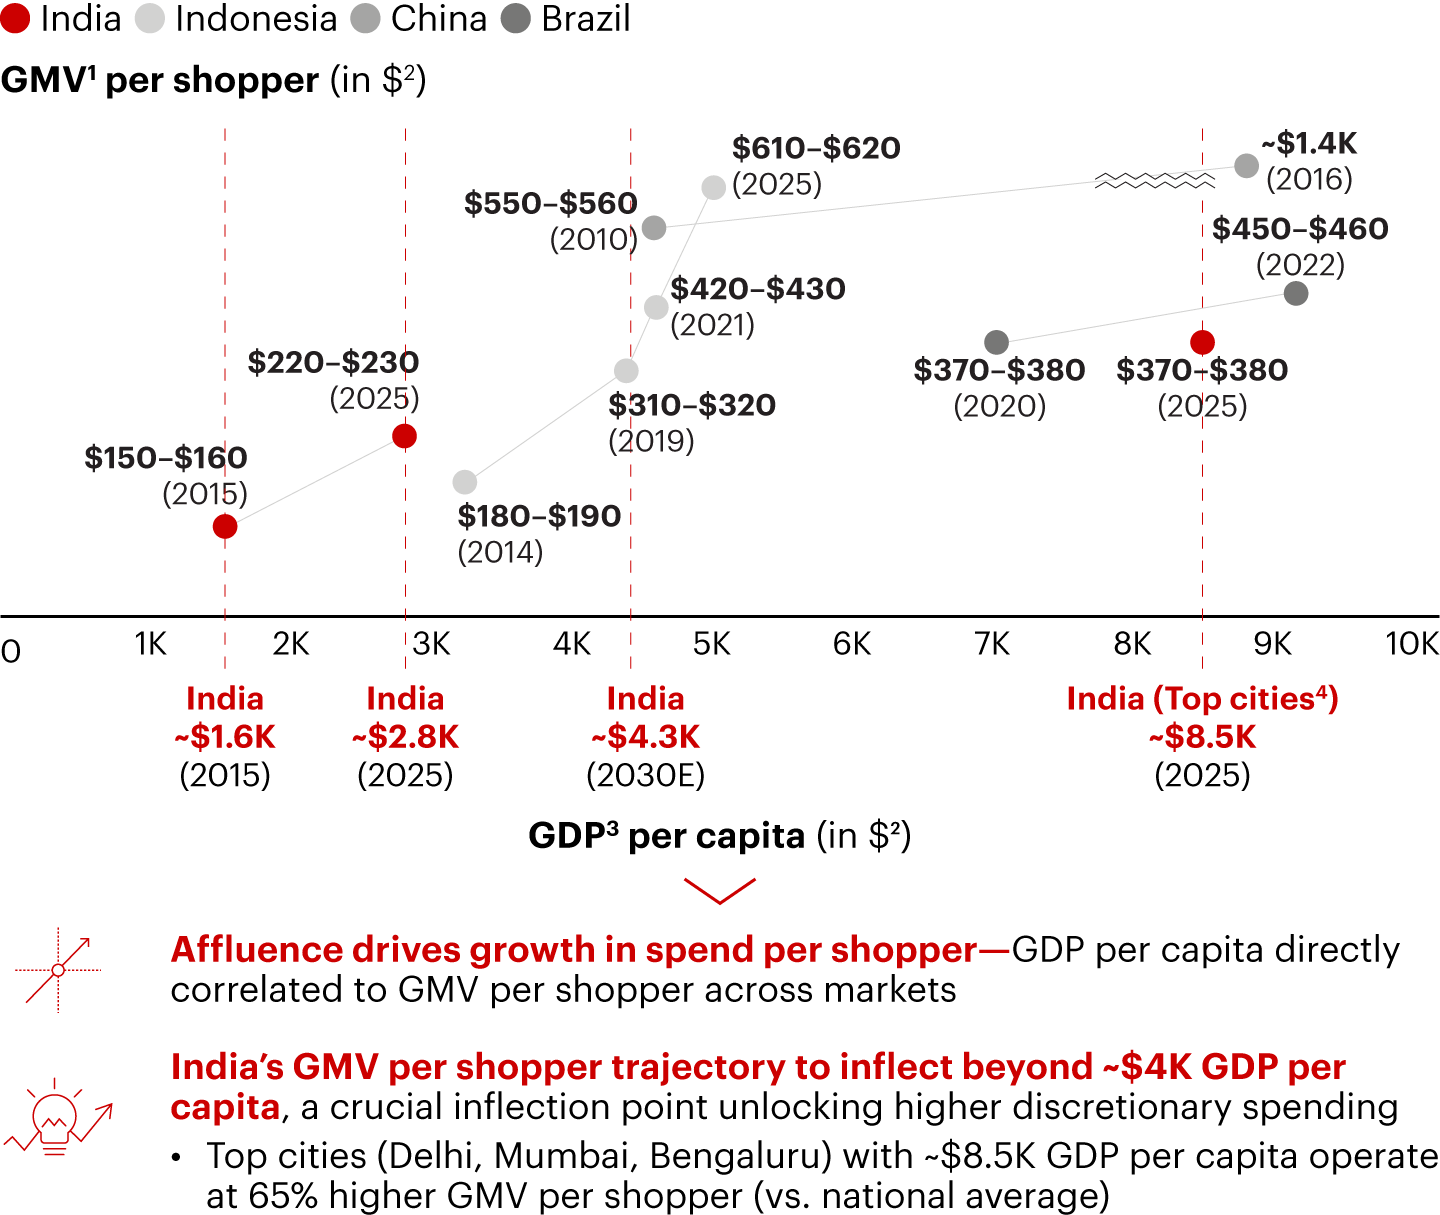

Notes: 1) Gross merchandise value for all retail categories, excluding travel; 2) Exchange rate 1 USD = INR ~87; 3) Gross domestic product at current prices; 4) Includes Delhi, Mumbai, and Bengaluru Sources: Crisil; Forrester; Netscribes; UN population data; IMF; MoSPI GDP dashboard; Angel One; market participant interviews; Bain analysis
Figure 16
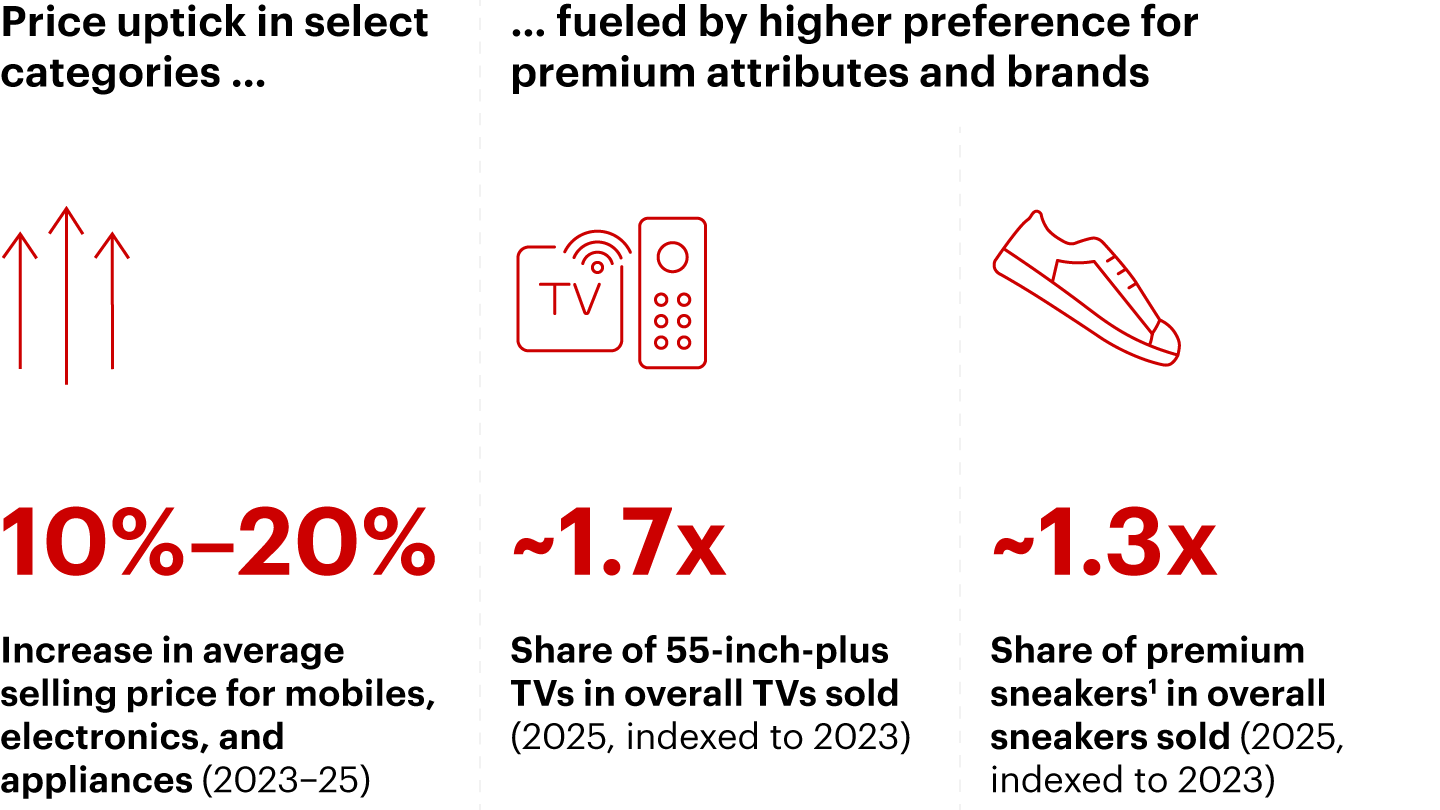

Note: 1) Premium sneakers include Tommy Hilfiger, USPA, Nautica (typically ~50% higher price vs. average) Sources: Market participant interviews; Bain analysis
Figure 17
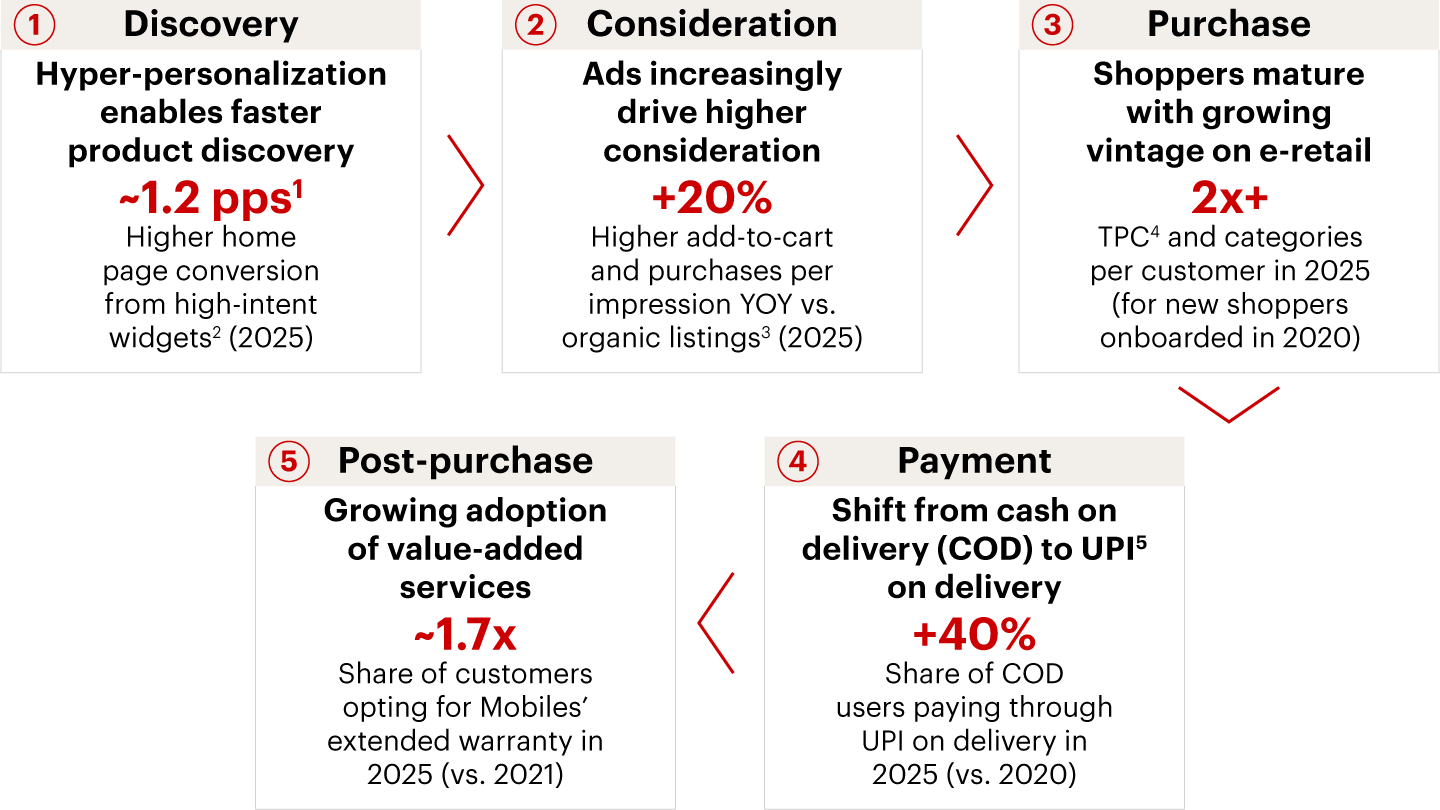

Notes: 1) Percentage points; 2) For example, previously browsed products; 3) On search listings and home/category landing pages; 4) Annual transactions per customer; 5) Unified Payments Interface Sources: Market participant interviews; Bain analysis
Figure 18

Spotlight: Quick and conversational commerceThis year, we explore two trends in India’s e-retail: Quick commerce (Q-commerce) and conversational commerce.
Figure 19
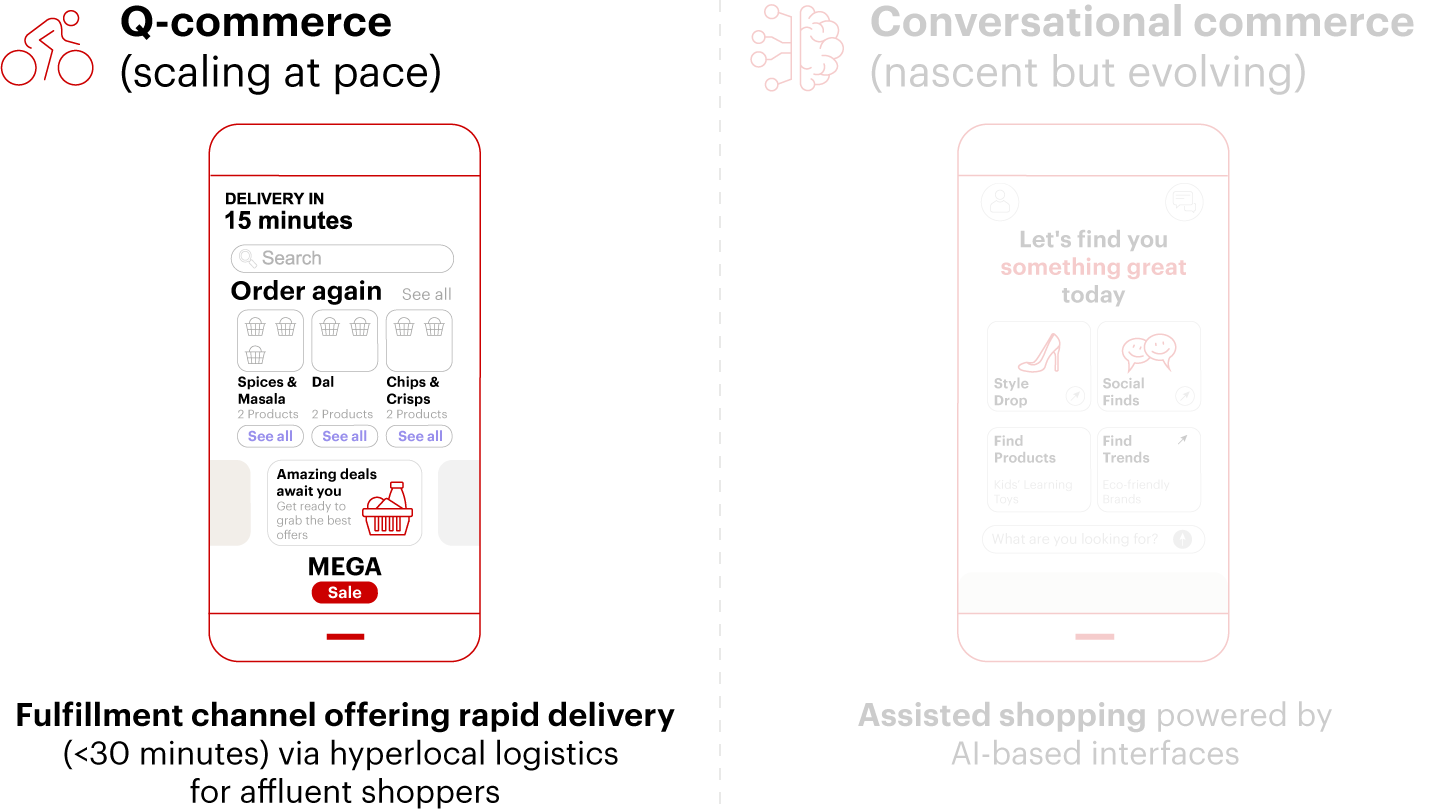

Figure 20
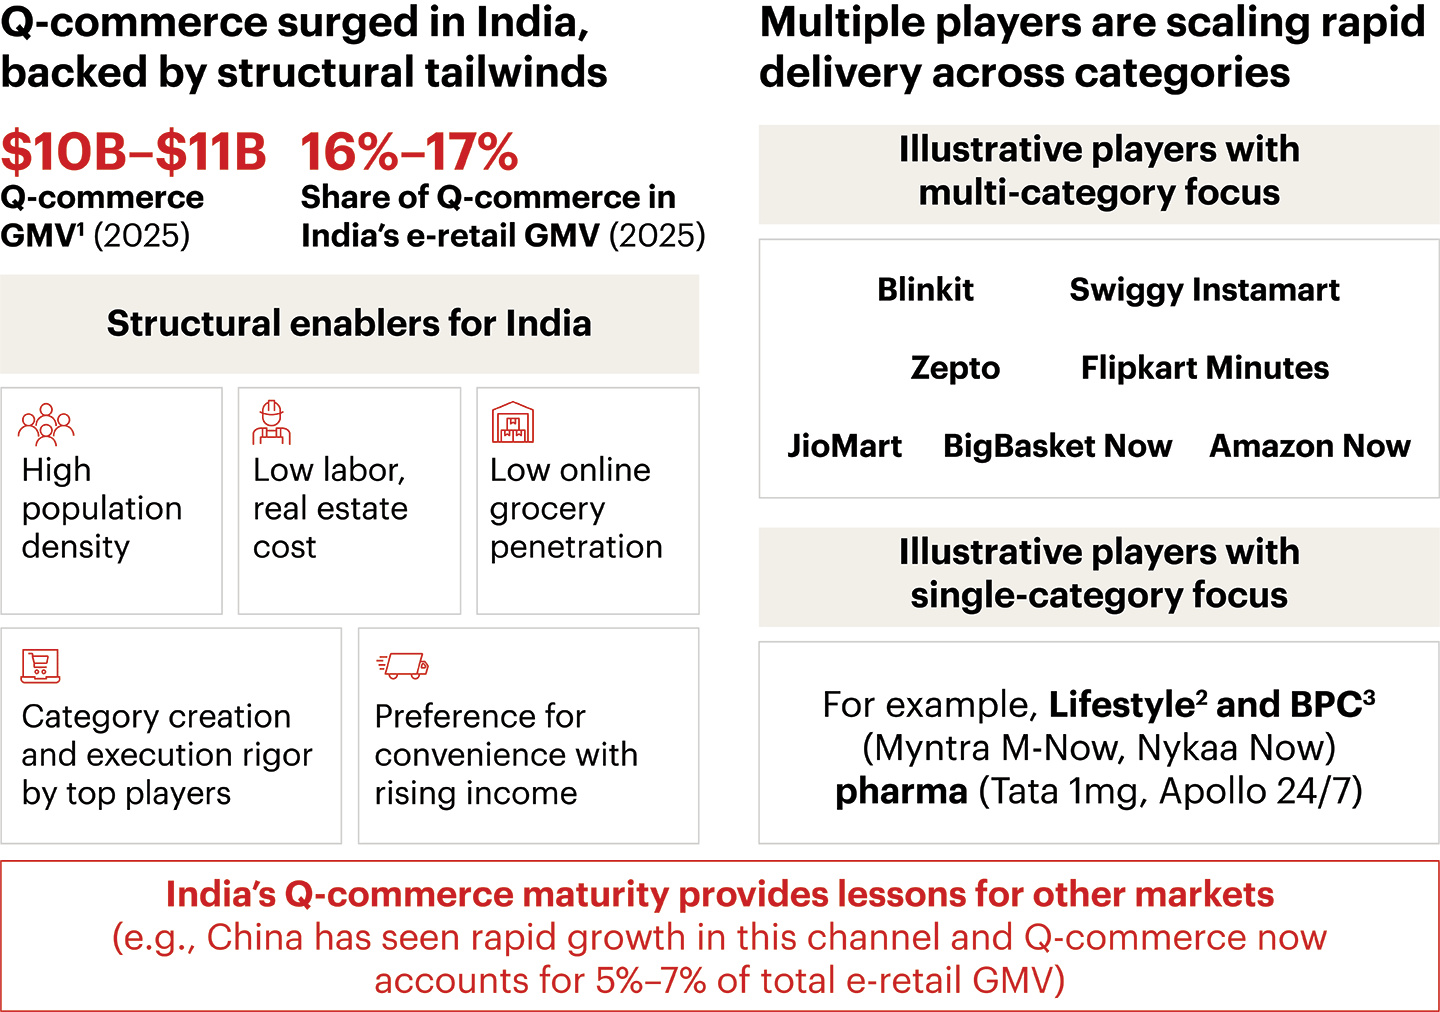

Notes: 1) Gross merchandise value; 2) Includes apparel, footwear, accessories; 3) Beauty and personal care Sources: Analyst reports; Forrester; Flipkart market research data; market participant interviews; Bain analysis
Figure 21
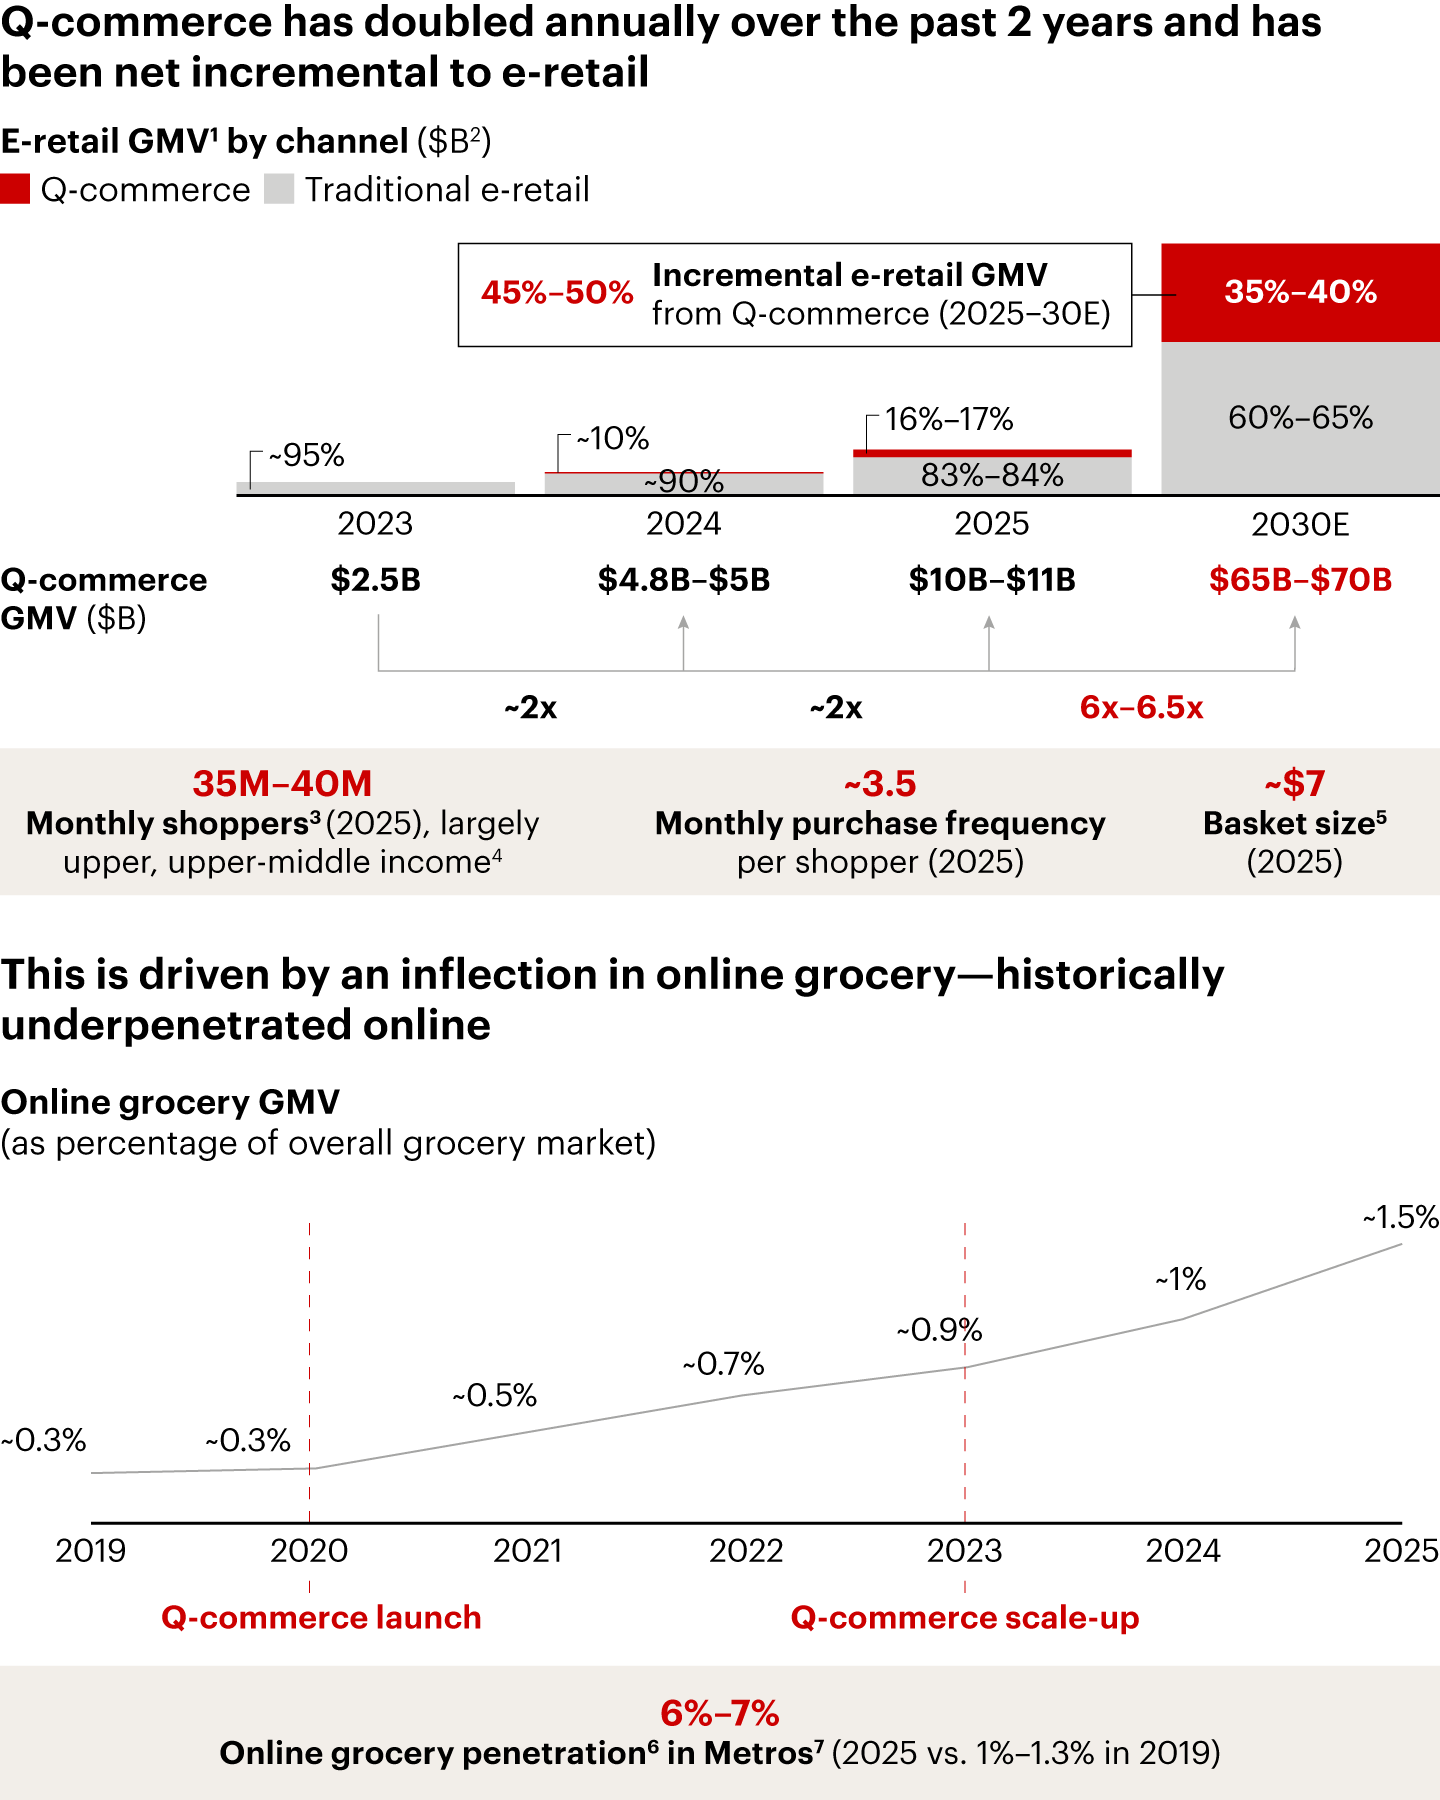

Notes: 1) Gross merchandise value for all retail categories; 2) Exchange rate: 1 USD = INR ~87; 3) Customers making at least one purchase across any Q-commerce platform; 4) Household income brackets per annum: upper-middle income: INR 5–30L, upper income: >INR 30L; 5) Average order value; 6) Online grocery GMV as percentage of overall grocery market; 7) Top eight cities by population Sources: Forrester; Netscribes; Crisil; company publications; Bernstein research; Flipkart market research data; market participant interviews; Bain analysis
Figure 22
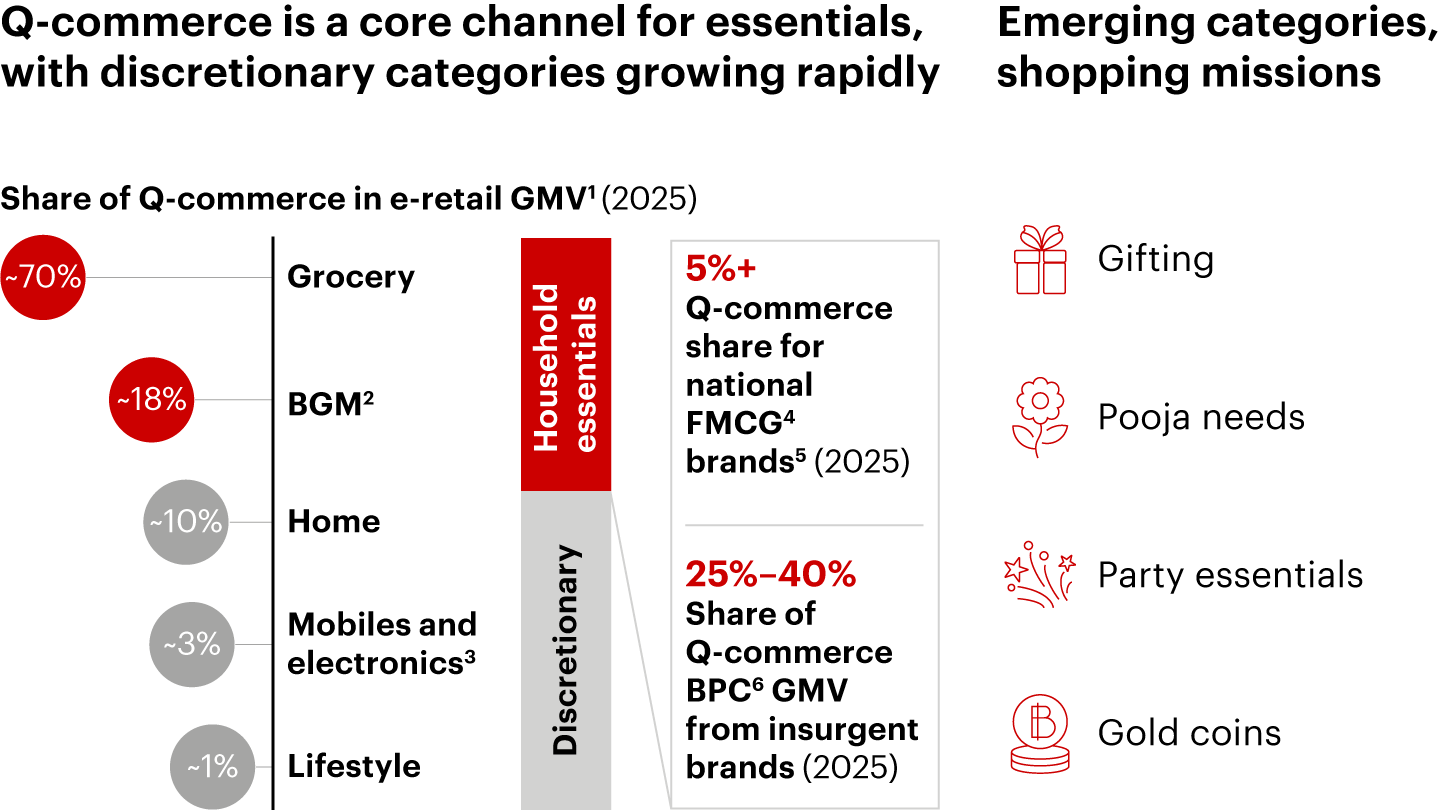

Notes: 1) Gross merchandise value; 2) Includes beauty and personal care and other general merchandise; 3) Includes all electronics, including accessories and large/small appliances; 4) Fast-moving consumer goods; 5) Including brands like Marico, Dabur, Britannia, Hindustan Unilever, Tata Consumer Products; 6) Beauty and personal care, including grooming (e.g., shampoo), makeup (e.g., lipstick, foundation), perfumes Sources: Forrester; Crisil; Netscribes; analyst reports; market participant interviews; Bain analysis
Figure 23
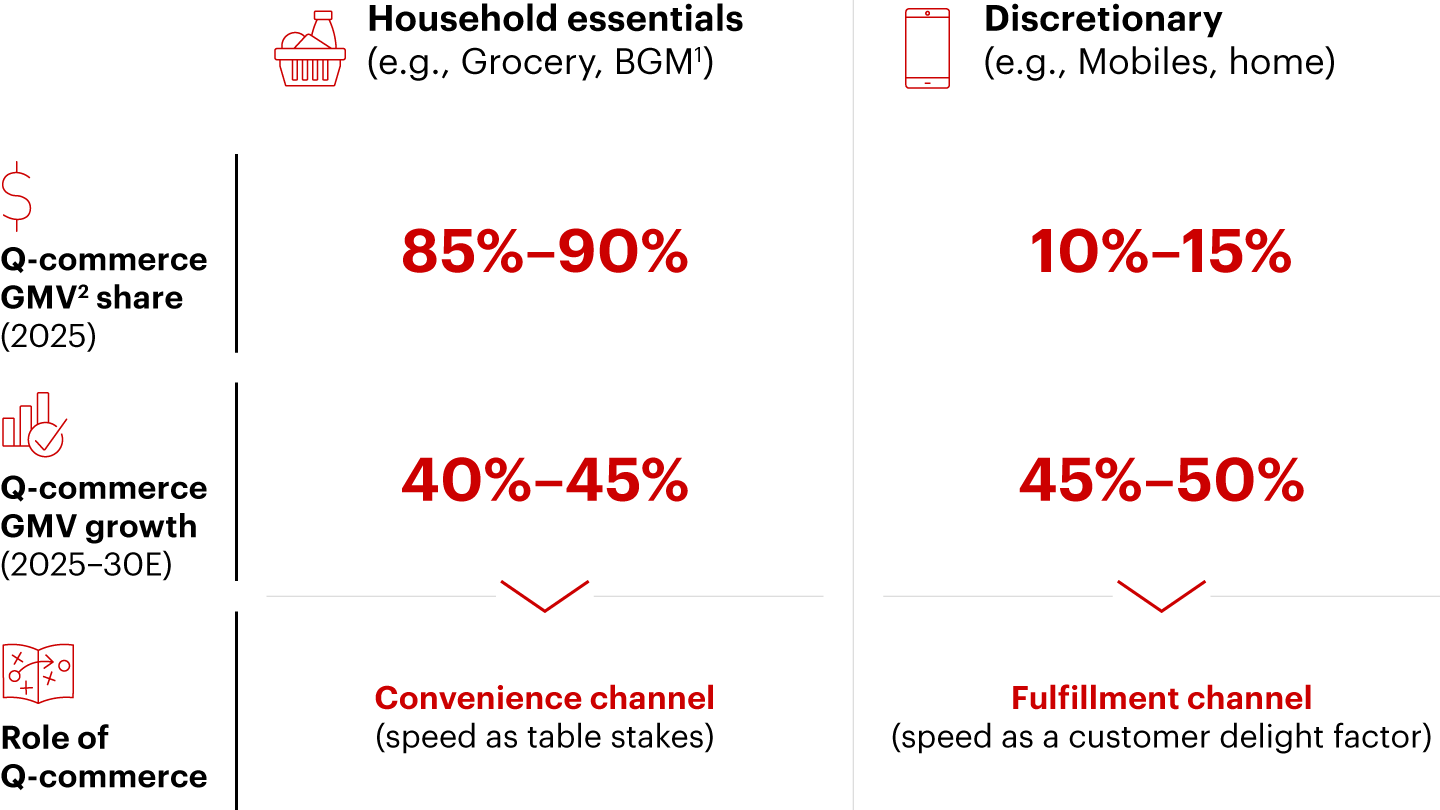

Notes: 1) Includes beauty and personal care and other general merchandise; 2) Gross merchandise value Sources: Forrester; Crisil; Netscribes; market participant interviews; Bain analysis
Figure 24
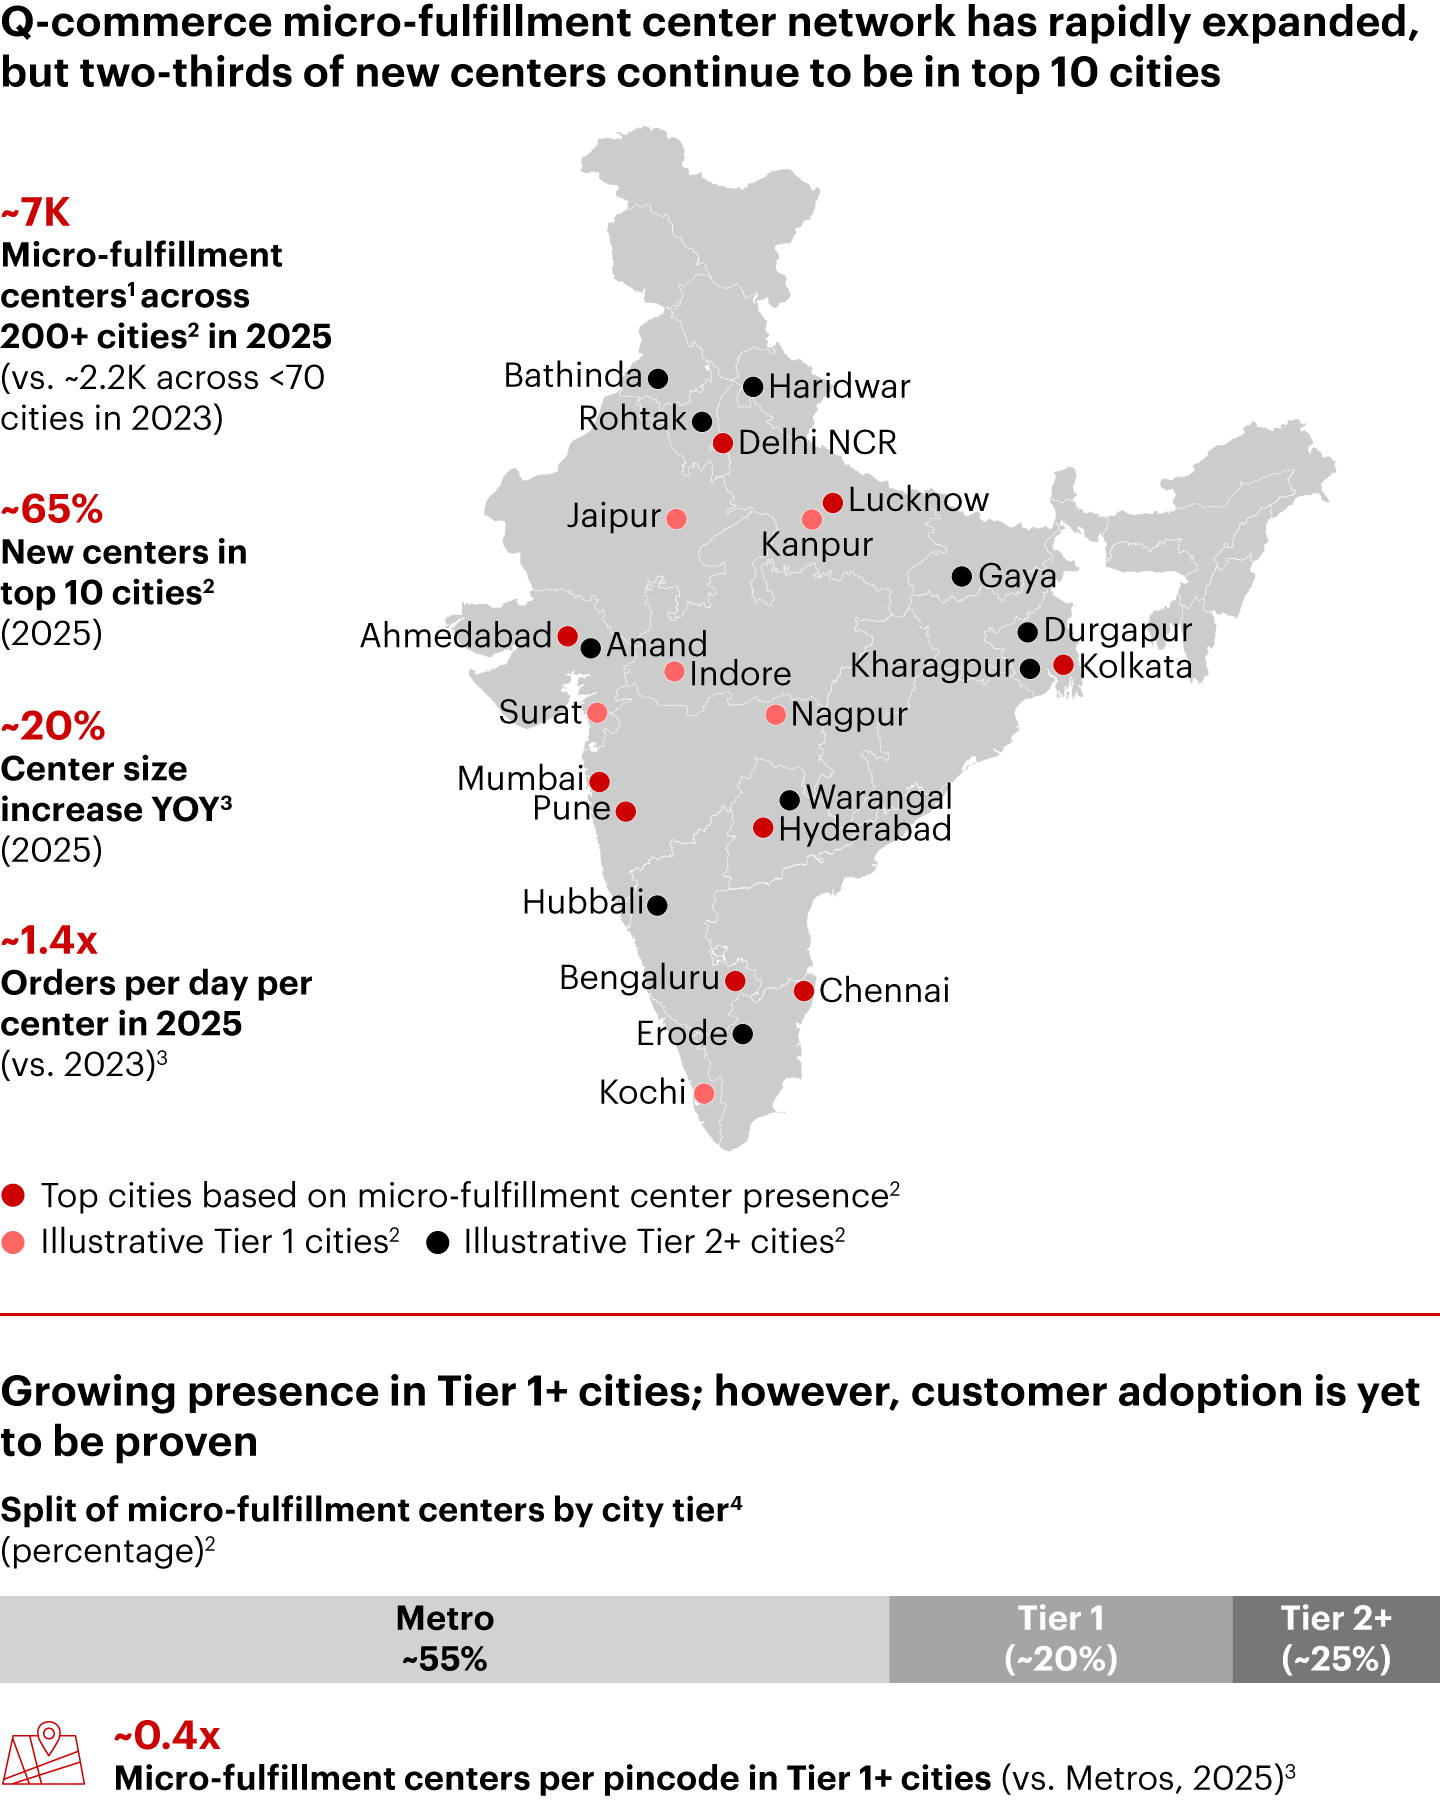

Notes: 1) As of Nov 2025 for Blinkit, Swiggy Instamart, and Zepto and Dec 2025 for Flipkart Minutes, BigBasket, Amazon Now, and JioMart (only designated micro-fulfillment centers, not all offline retail stores); 2) Cities with presence of at least one Q-commerce player among Blinkit, Swiggy Instamart, Zepto, and Flipkart Minutes; 3) Based on Swiggy Instamart and Blinkit’s data; 4) Metro/Tier 1 covers top ~50 cities based on population (typically >1 million), Tier 2 covers remaining towns Sources: 1digitalstack.ai; Bernstein research, JPMorgan research; Nielsen; company publications; press releases; analyst reports; market participant interviews; Bain analysis
Figure 25
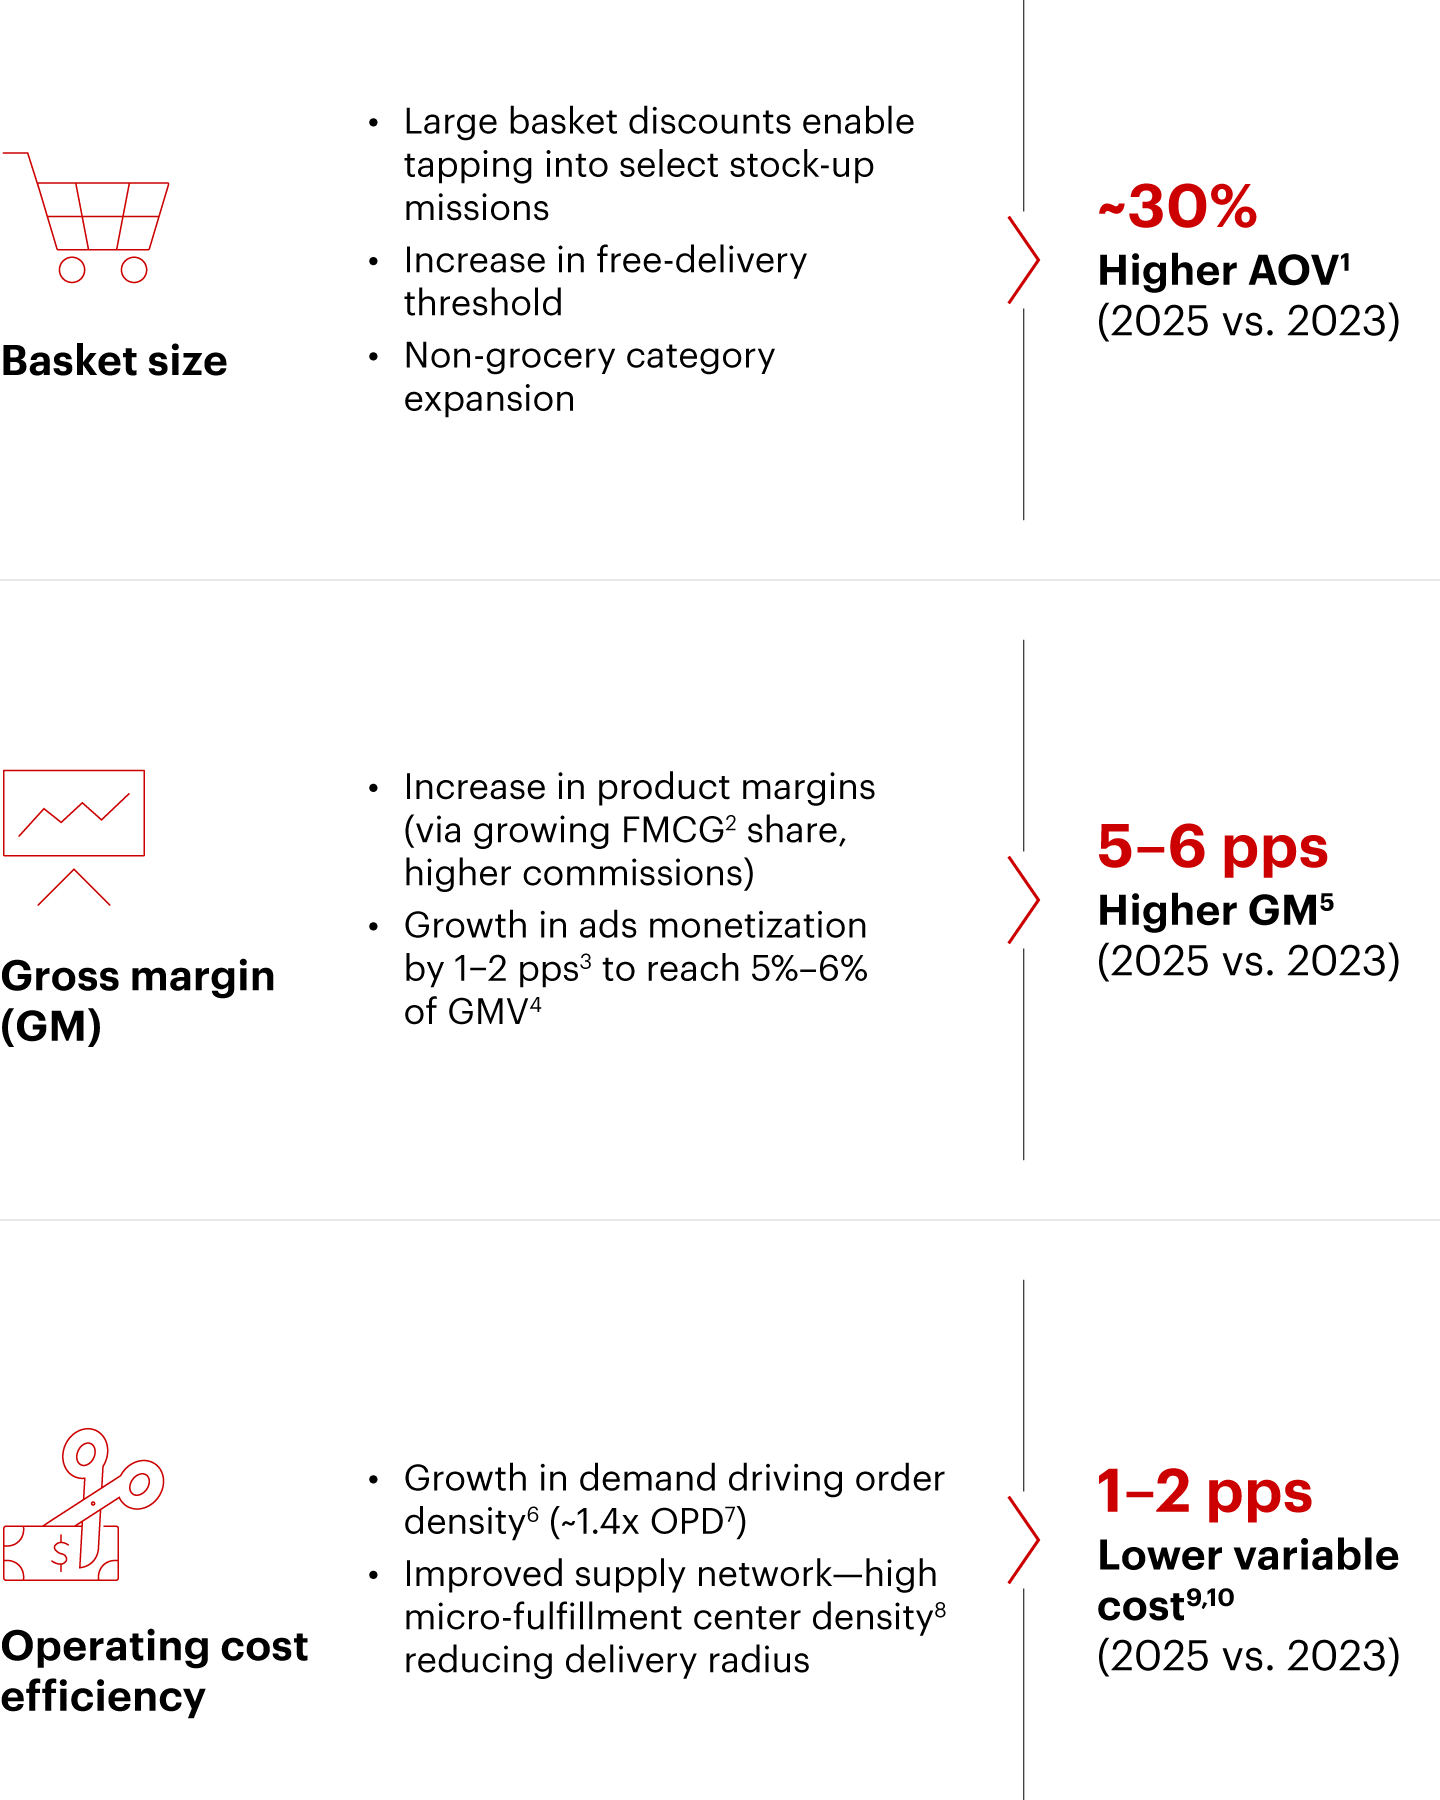

Notes: 1) Average order value; 2) Fast-moving consumer goods; 3) Percentage points; 4) Gross merchandise value; 5) As a percentage of GMV for Swiggy Instamart; 6) High order density results in high utilization of micro-fulfillment centers, driving lower fixed supply chain cost per shipment; 7) Orders per day per micro-fulfillment center; 8) Number of micro-fulfillment centers per square kilometer area in a city; 9) Average for Blinkit and Swiggy Instamart; 10) Variable cost includes variable fulfillment costs, micro-fulfillment center cost, refunds, wastages, packaging, payment gateway, and customer support cost as percentage of GMV Sources: Company financials; Macquarie research; Equirus Securities research; market participant interviews; Bain analysis
Figure 26
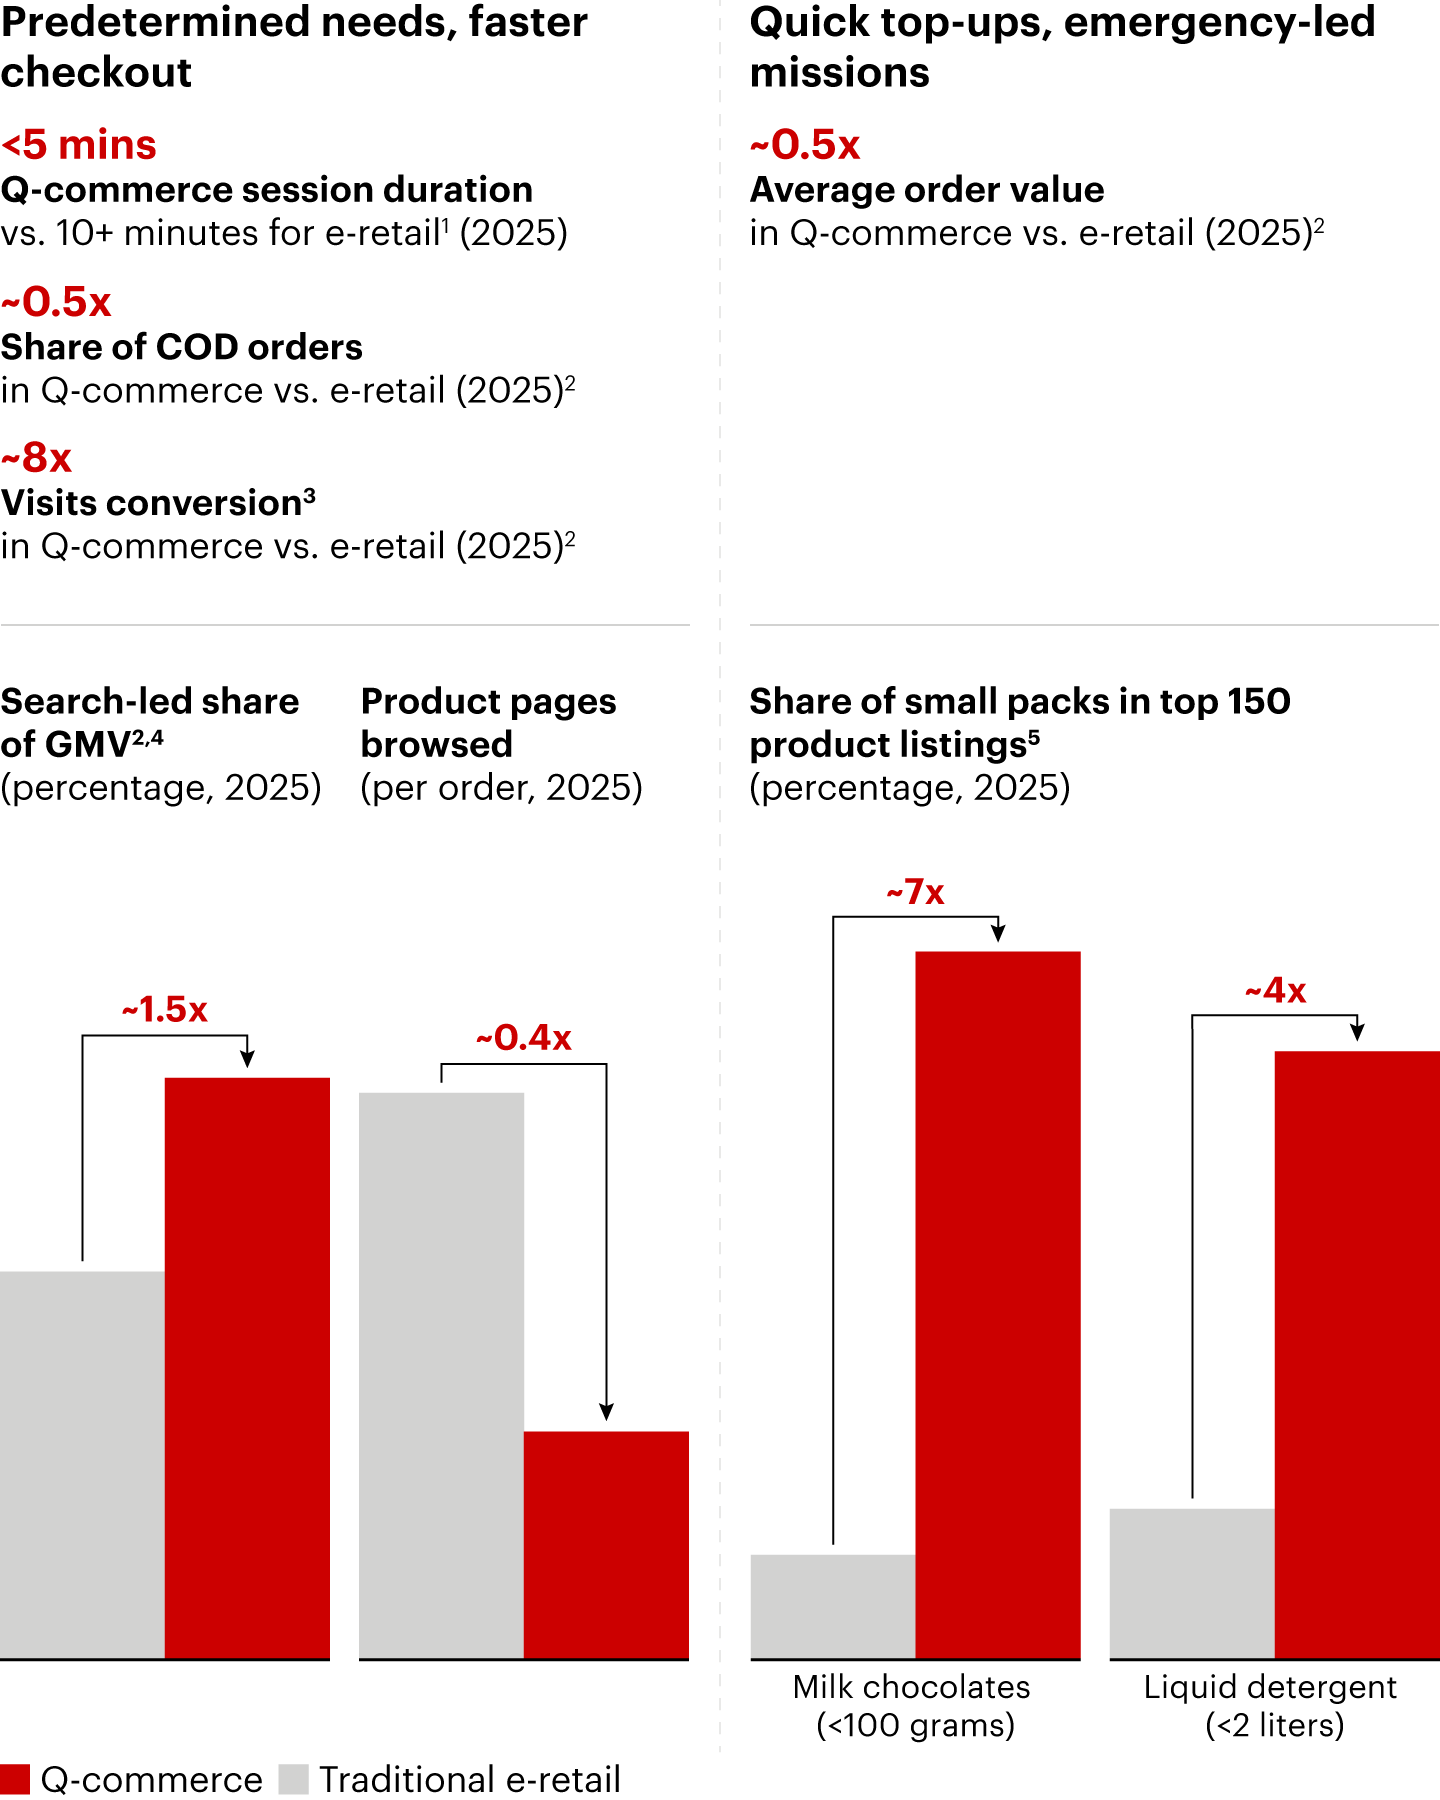

Notes: 1) Traditional e-retail; 2) In Metro/Tier 1 cities; 3) Share of visits converting to orders; 4) Gross merchandise value for Mobiles, Grocery, Beauty and personal care and other General Merchandise in Metro/Tier 1 cities; 5) Data scraped in Oct 2025 for Flipkart Grocery, Minutes & Blinkit across 6 pincodes in New Delhi and Bengaluru Sources: Market participant interviews; Bain analysis
Figure 27
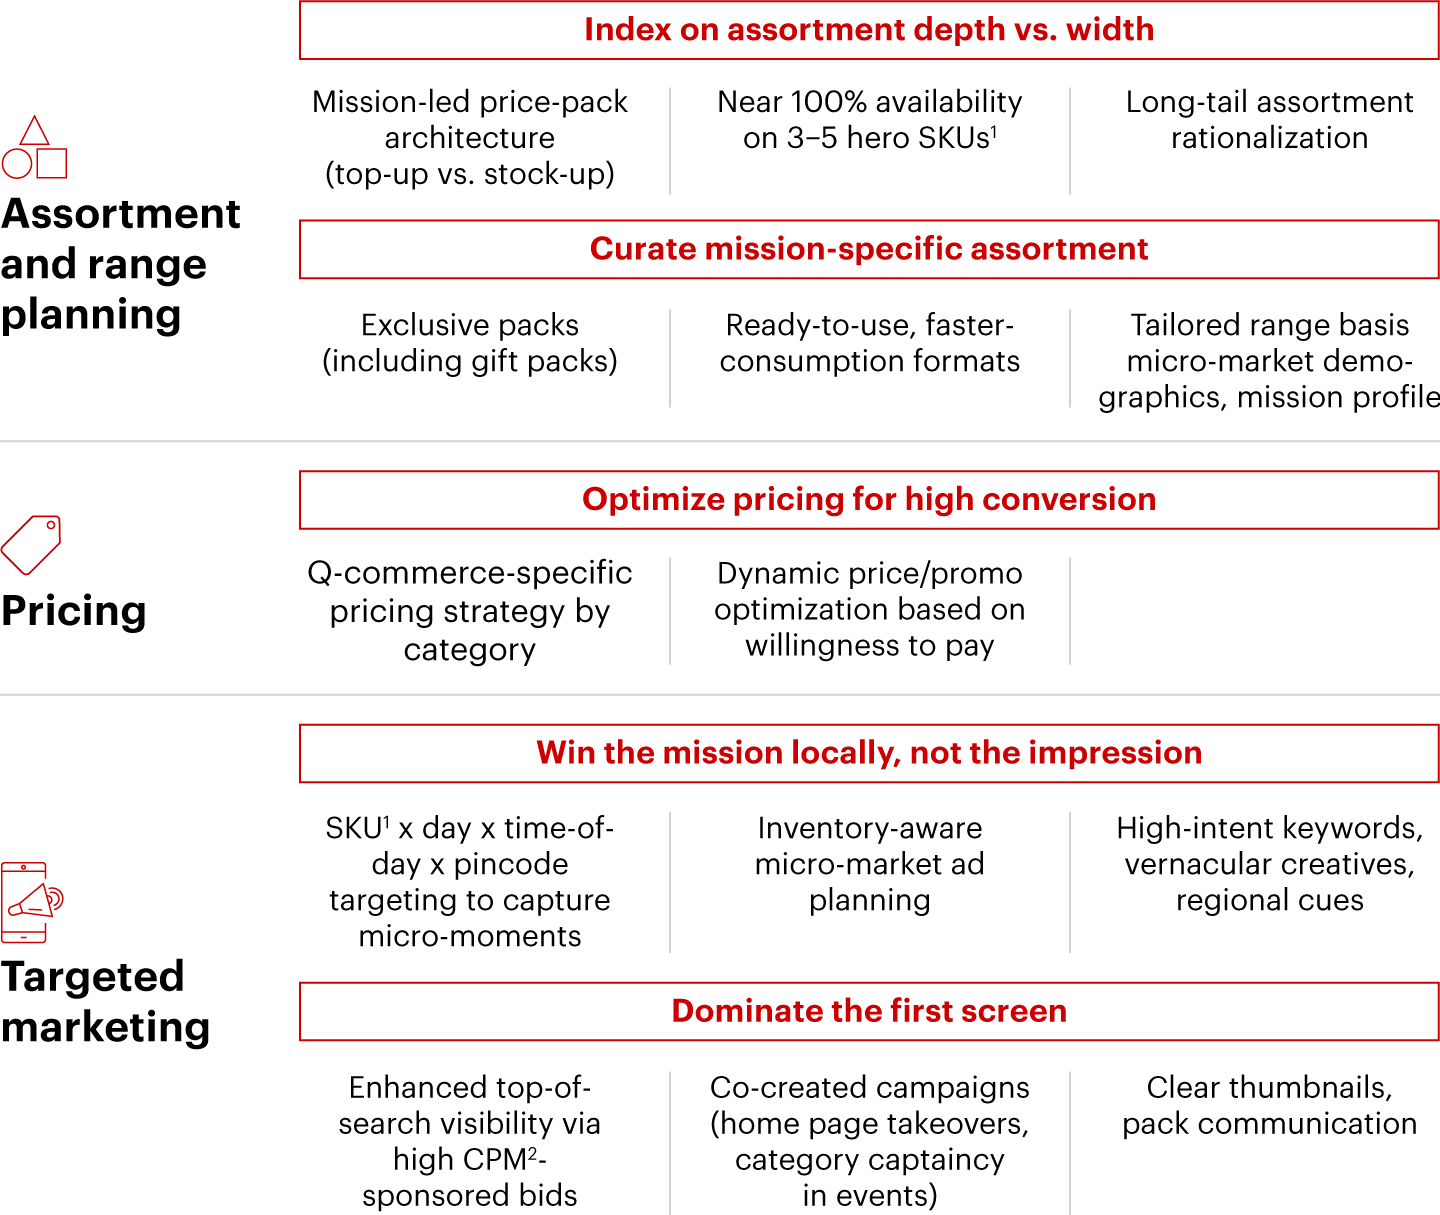

Notes: 1) Stock keeping units; 2) Cost per impression Source: Market participant interviews
Figure 28
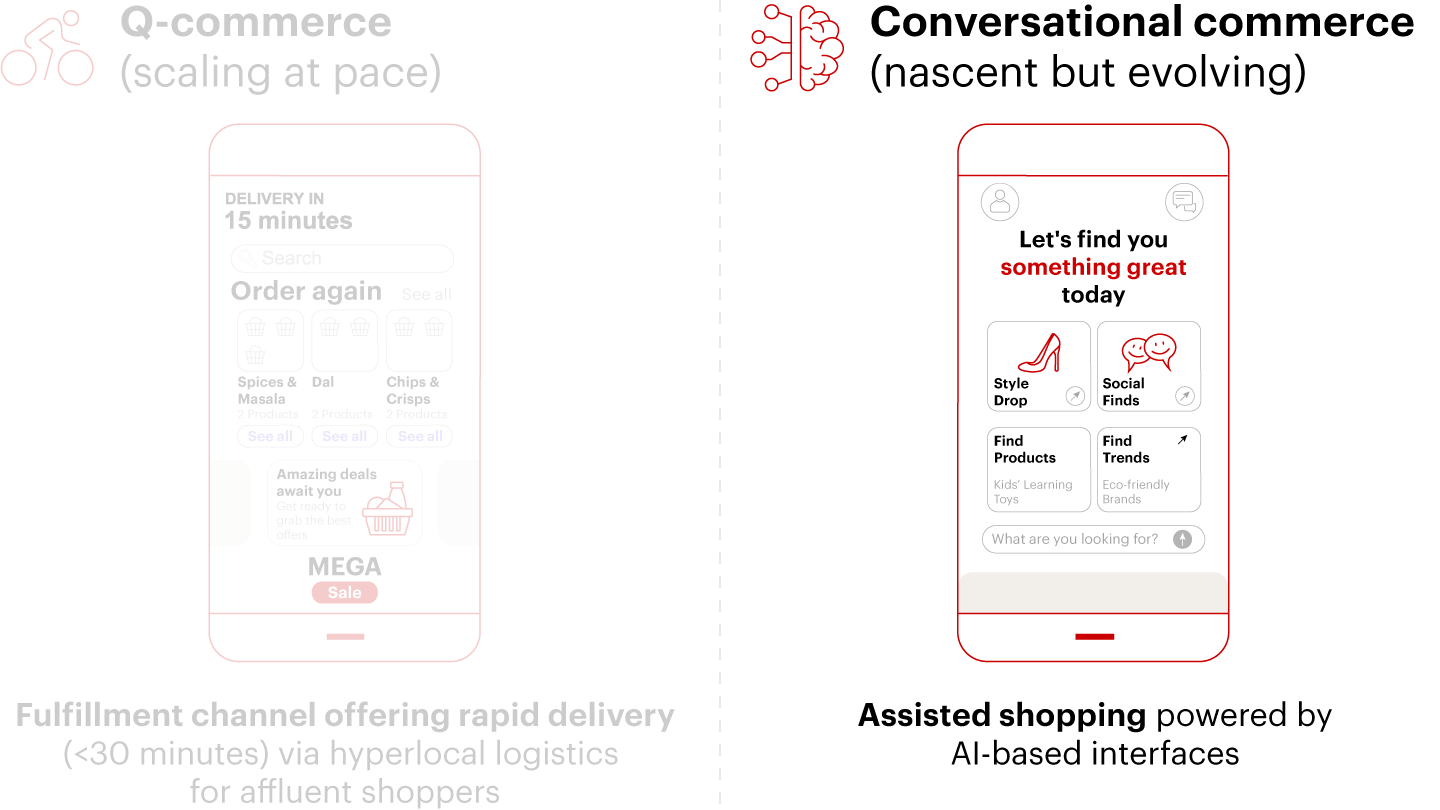

Figure 29
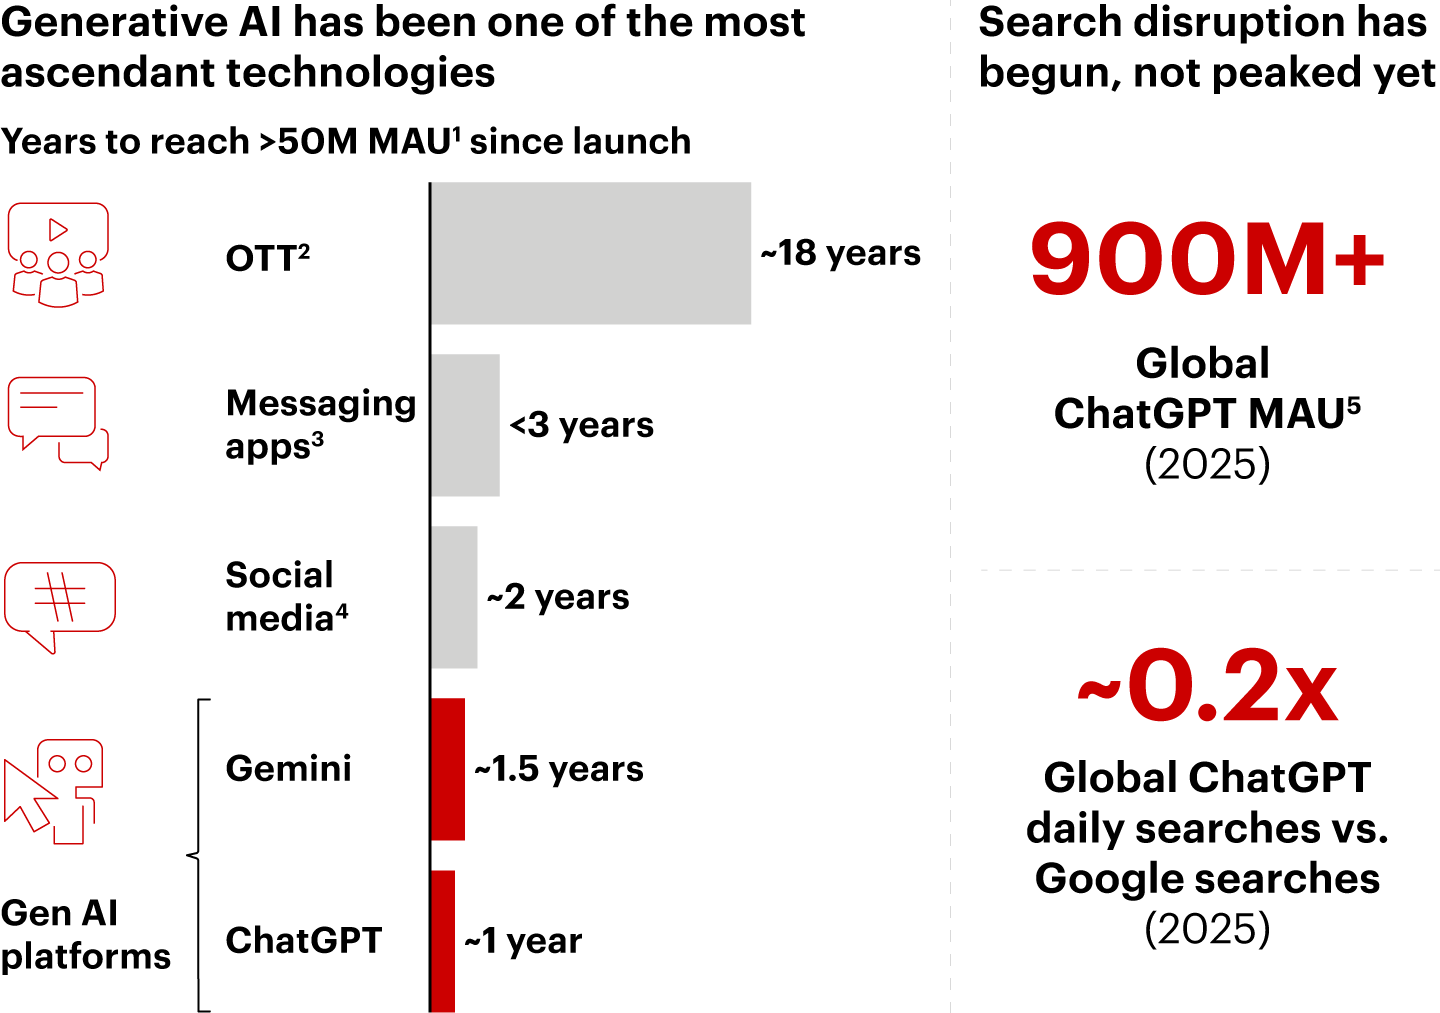

Notes: 1) Monthly active users; 2) Includes over-the-top content platforms like Netflix; 3) Includes WhatsApp; 4) Includes Facebook, Instagram, and X; 5) Monthly active users as of Dec 2025 Sources: Sensor Tower; OpenAI; press releases; market participant interviews; Bain analysis
Figure 30
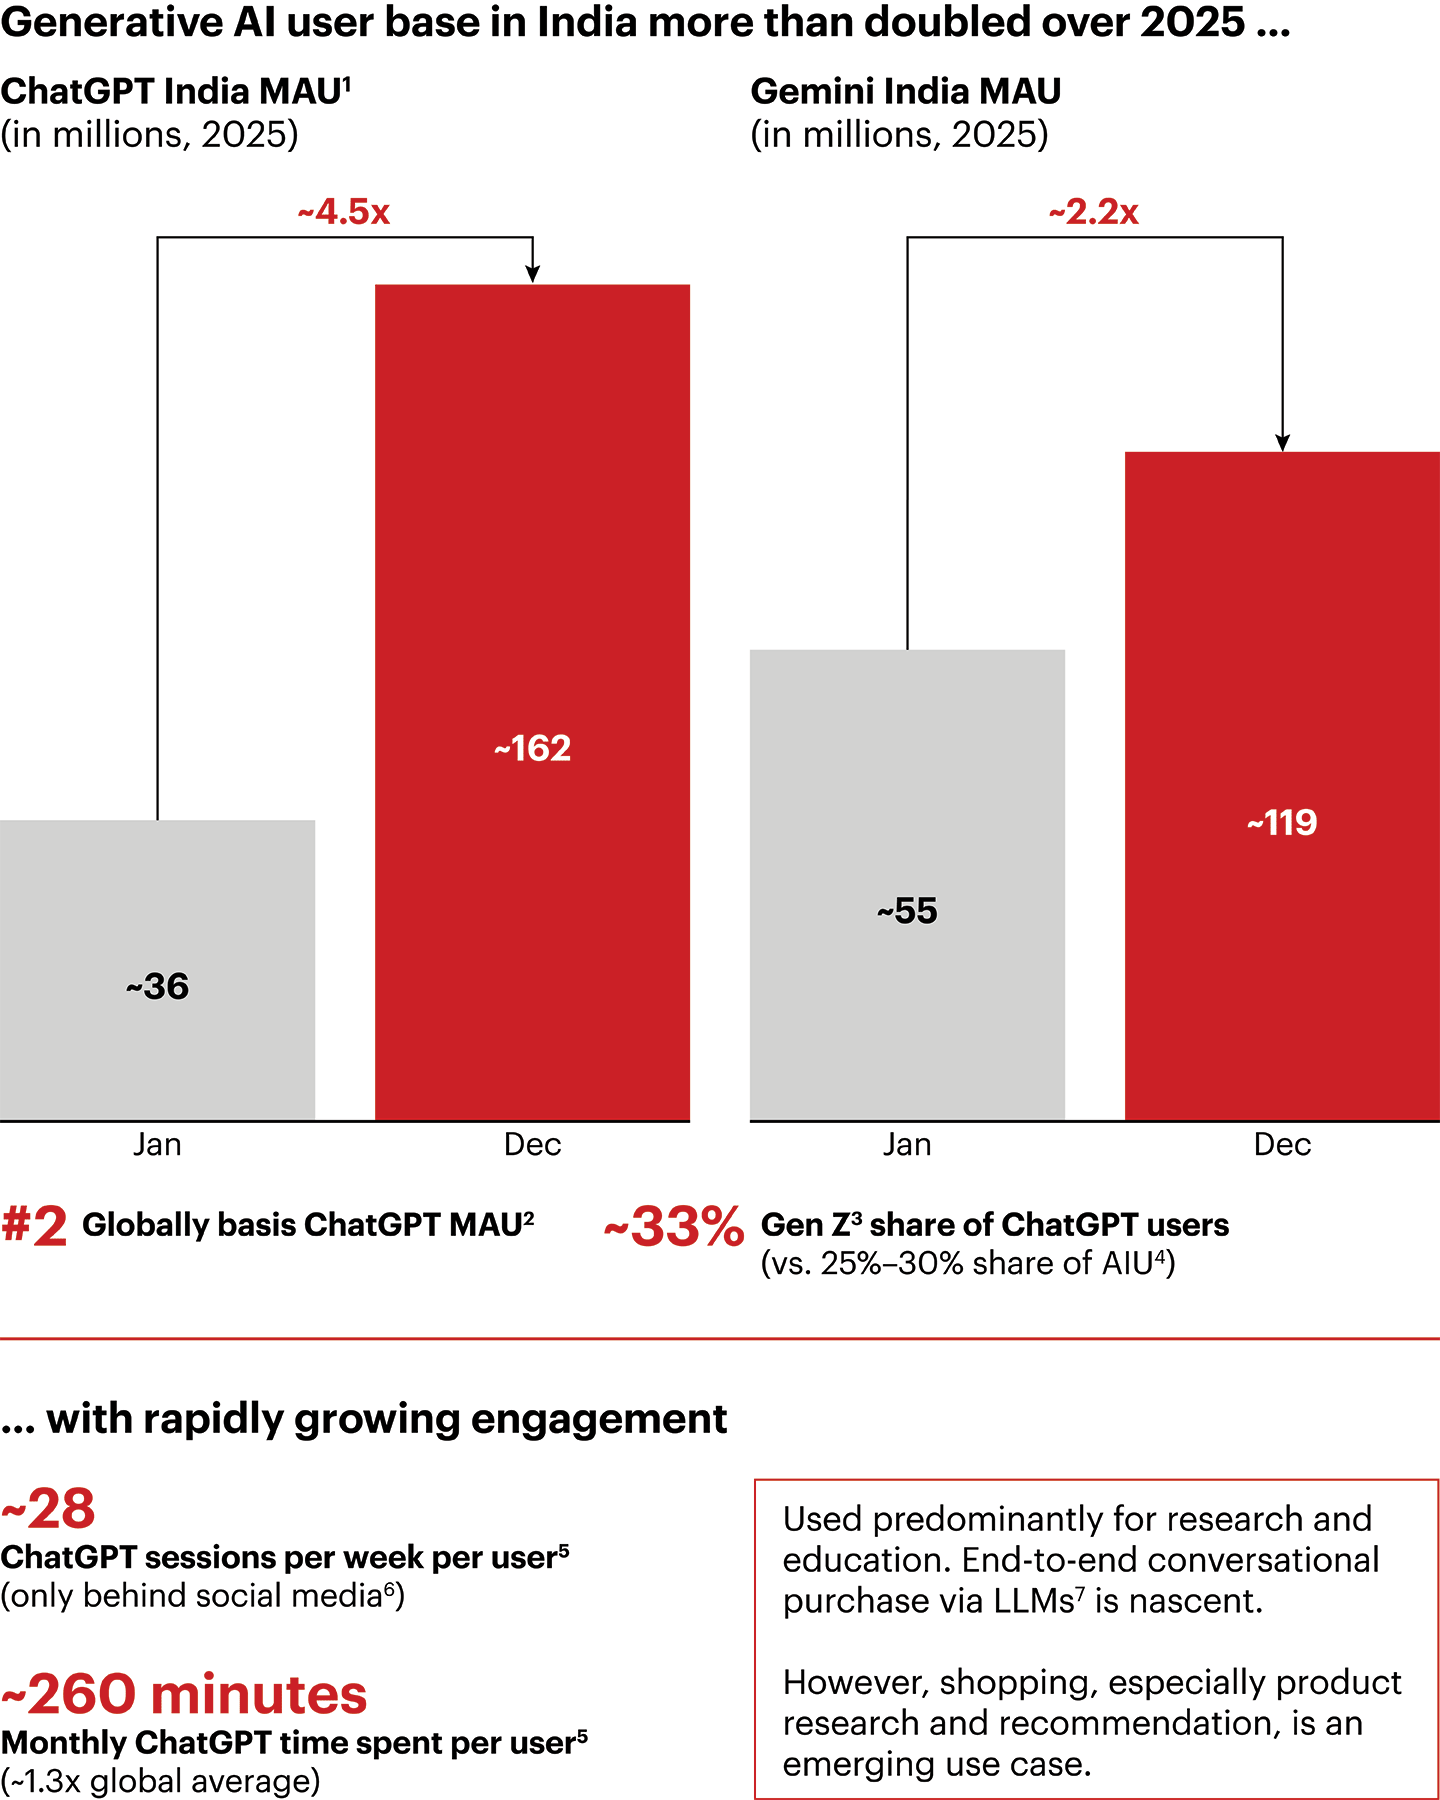

Notes: 1) Monthly active users; 2) Based on app usage as of Dec 2025; 3) Individuals born between 1997 and 2012; 4) Active Internet users, refers to users who have accessed Internet in the past month; 5) As of Dec 2025; 6) Includes Instagram, Facebook; 7) Large language models Sources: Sensor Tower; OpenAI; ICUBE 2025; market participant interviews; Bain analysis
Figure 31
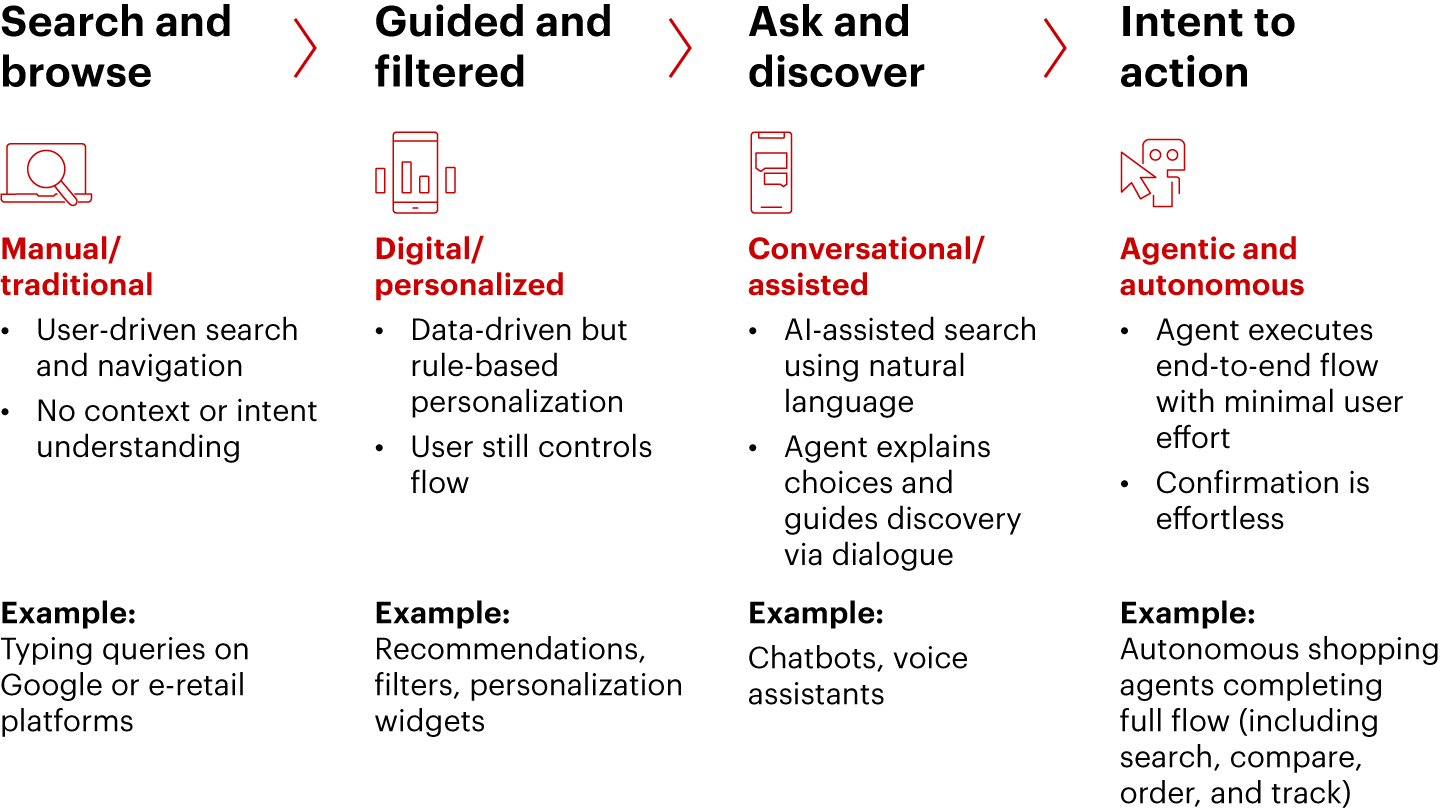

Figure 32
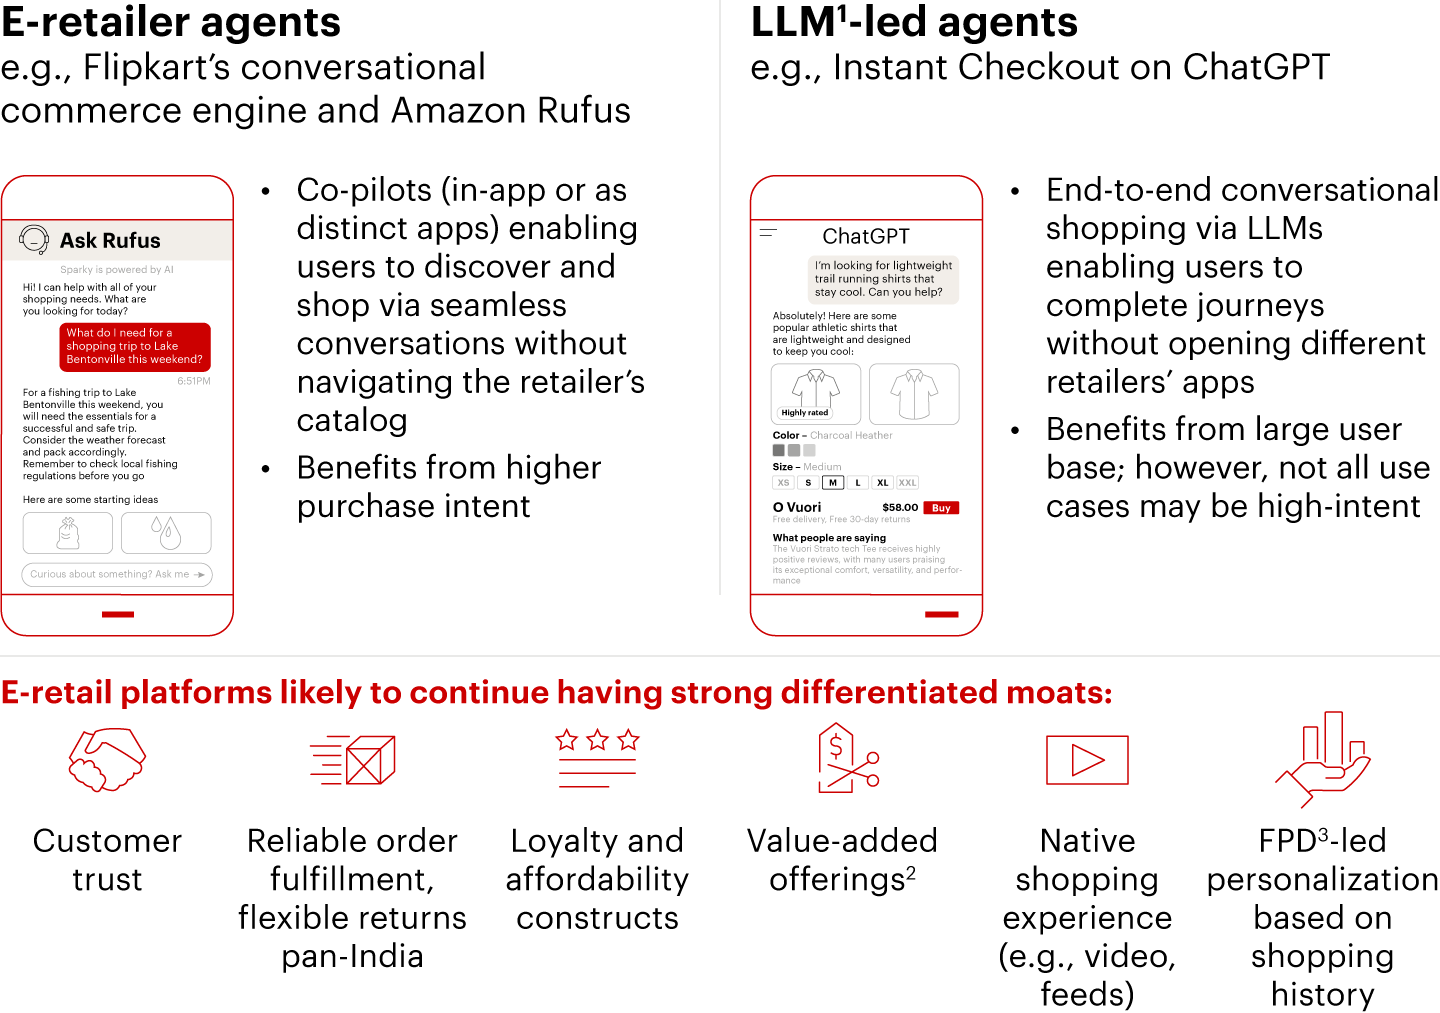

Notes: 1) Large language model; 2) Examples include product exchange and warranty; 3) First-party data: Shopper data collected through interactions on e-retailer apps Sources: Platform websites and app interfaces; market participant interviews
Figure 33
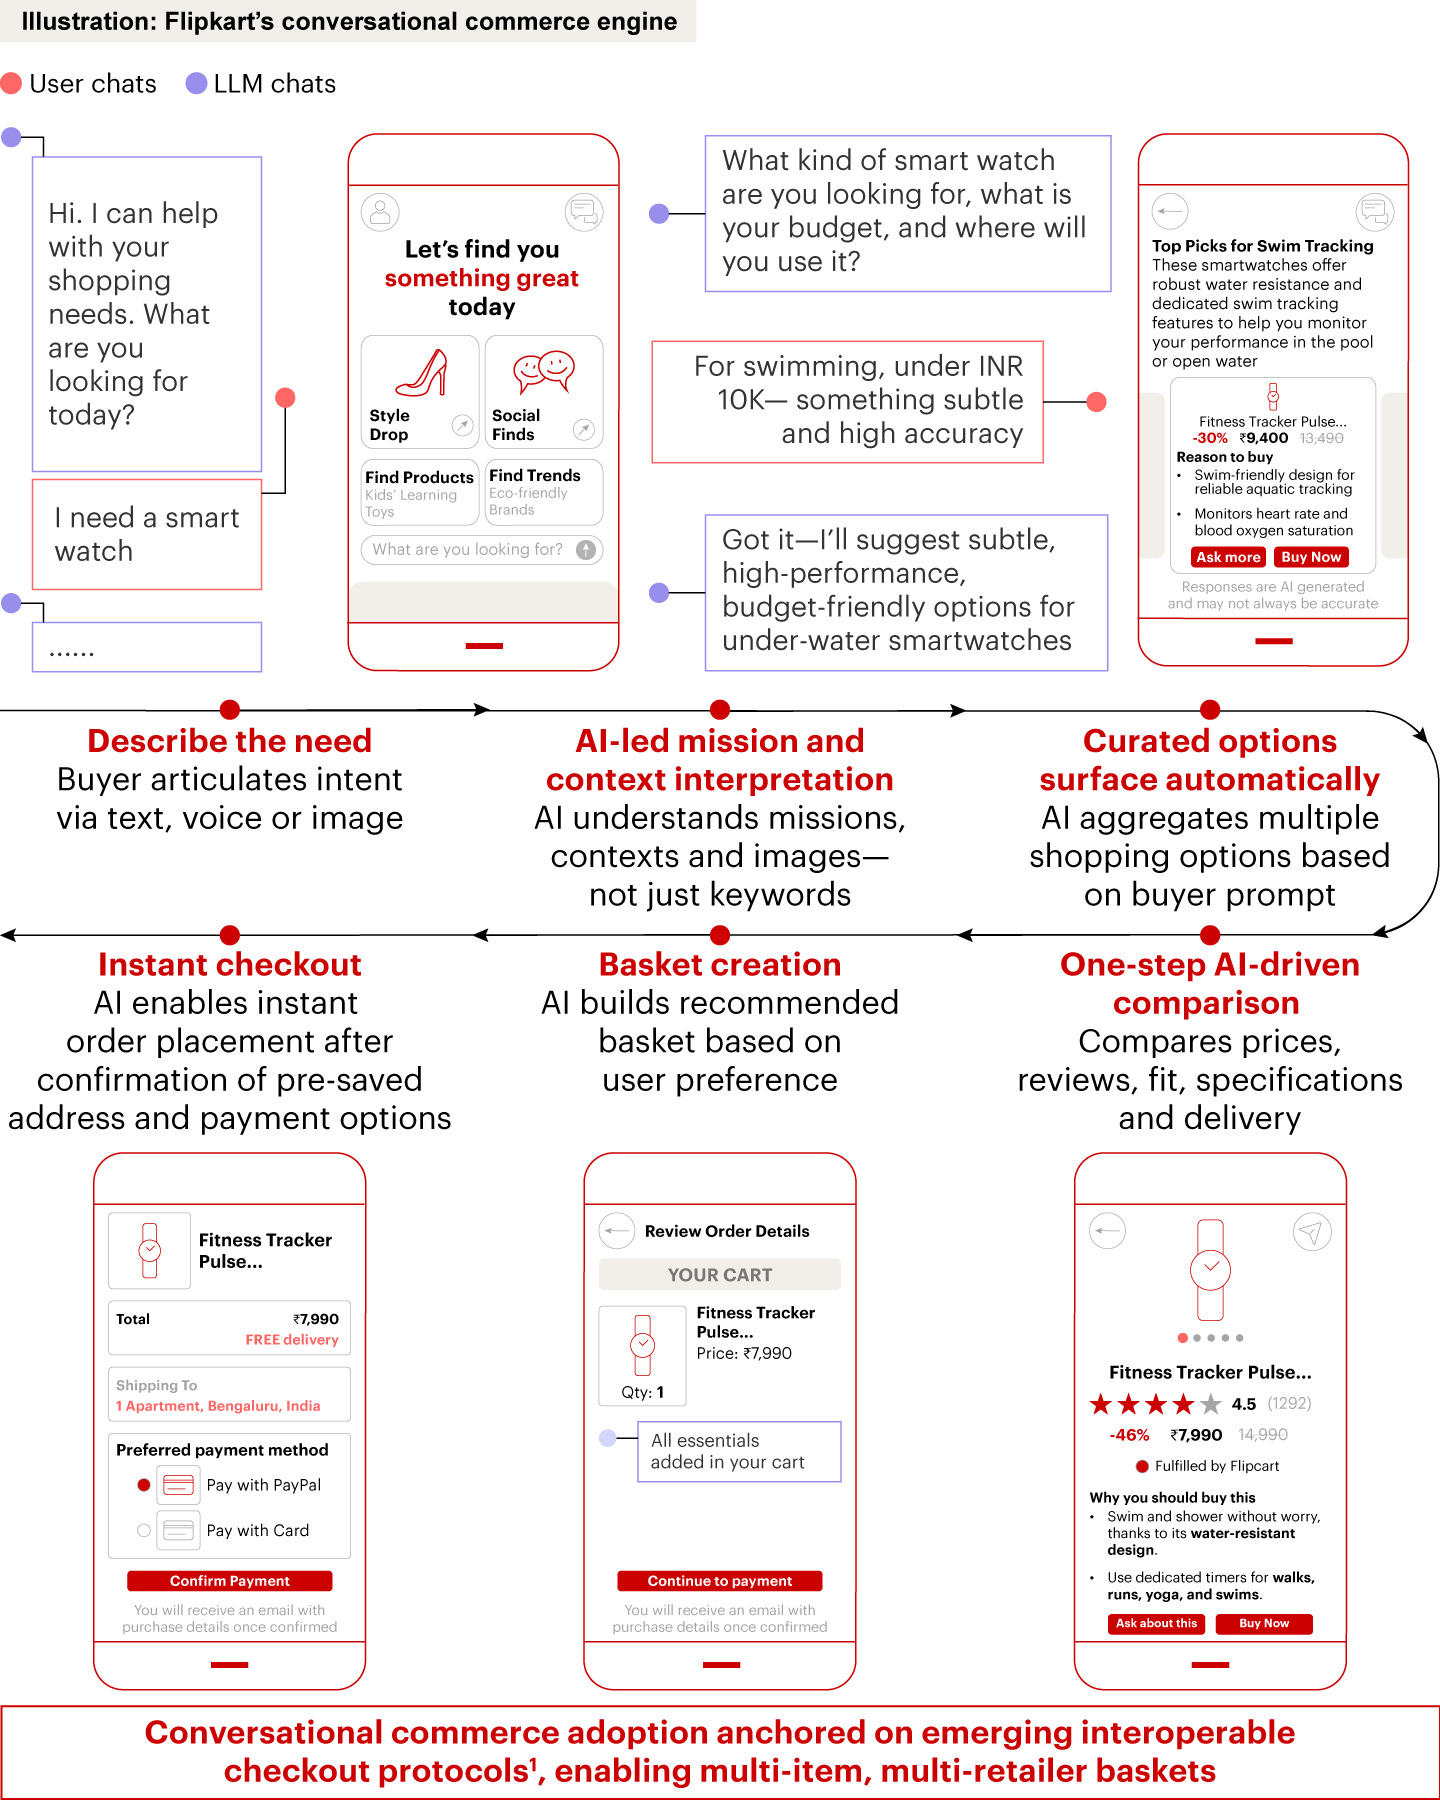

Note: 1) Examples include Google’s Universal Commerce Protocol in collaboration with Shopify, Walmart, Target, Etsy, etc., and OpenAI’s Agentic Commerce Protocol in collaboration with Stripe Sources: Platform websites and app interfaces; market participant interviews
Figure 34
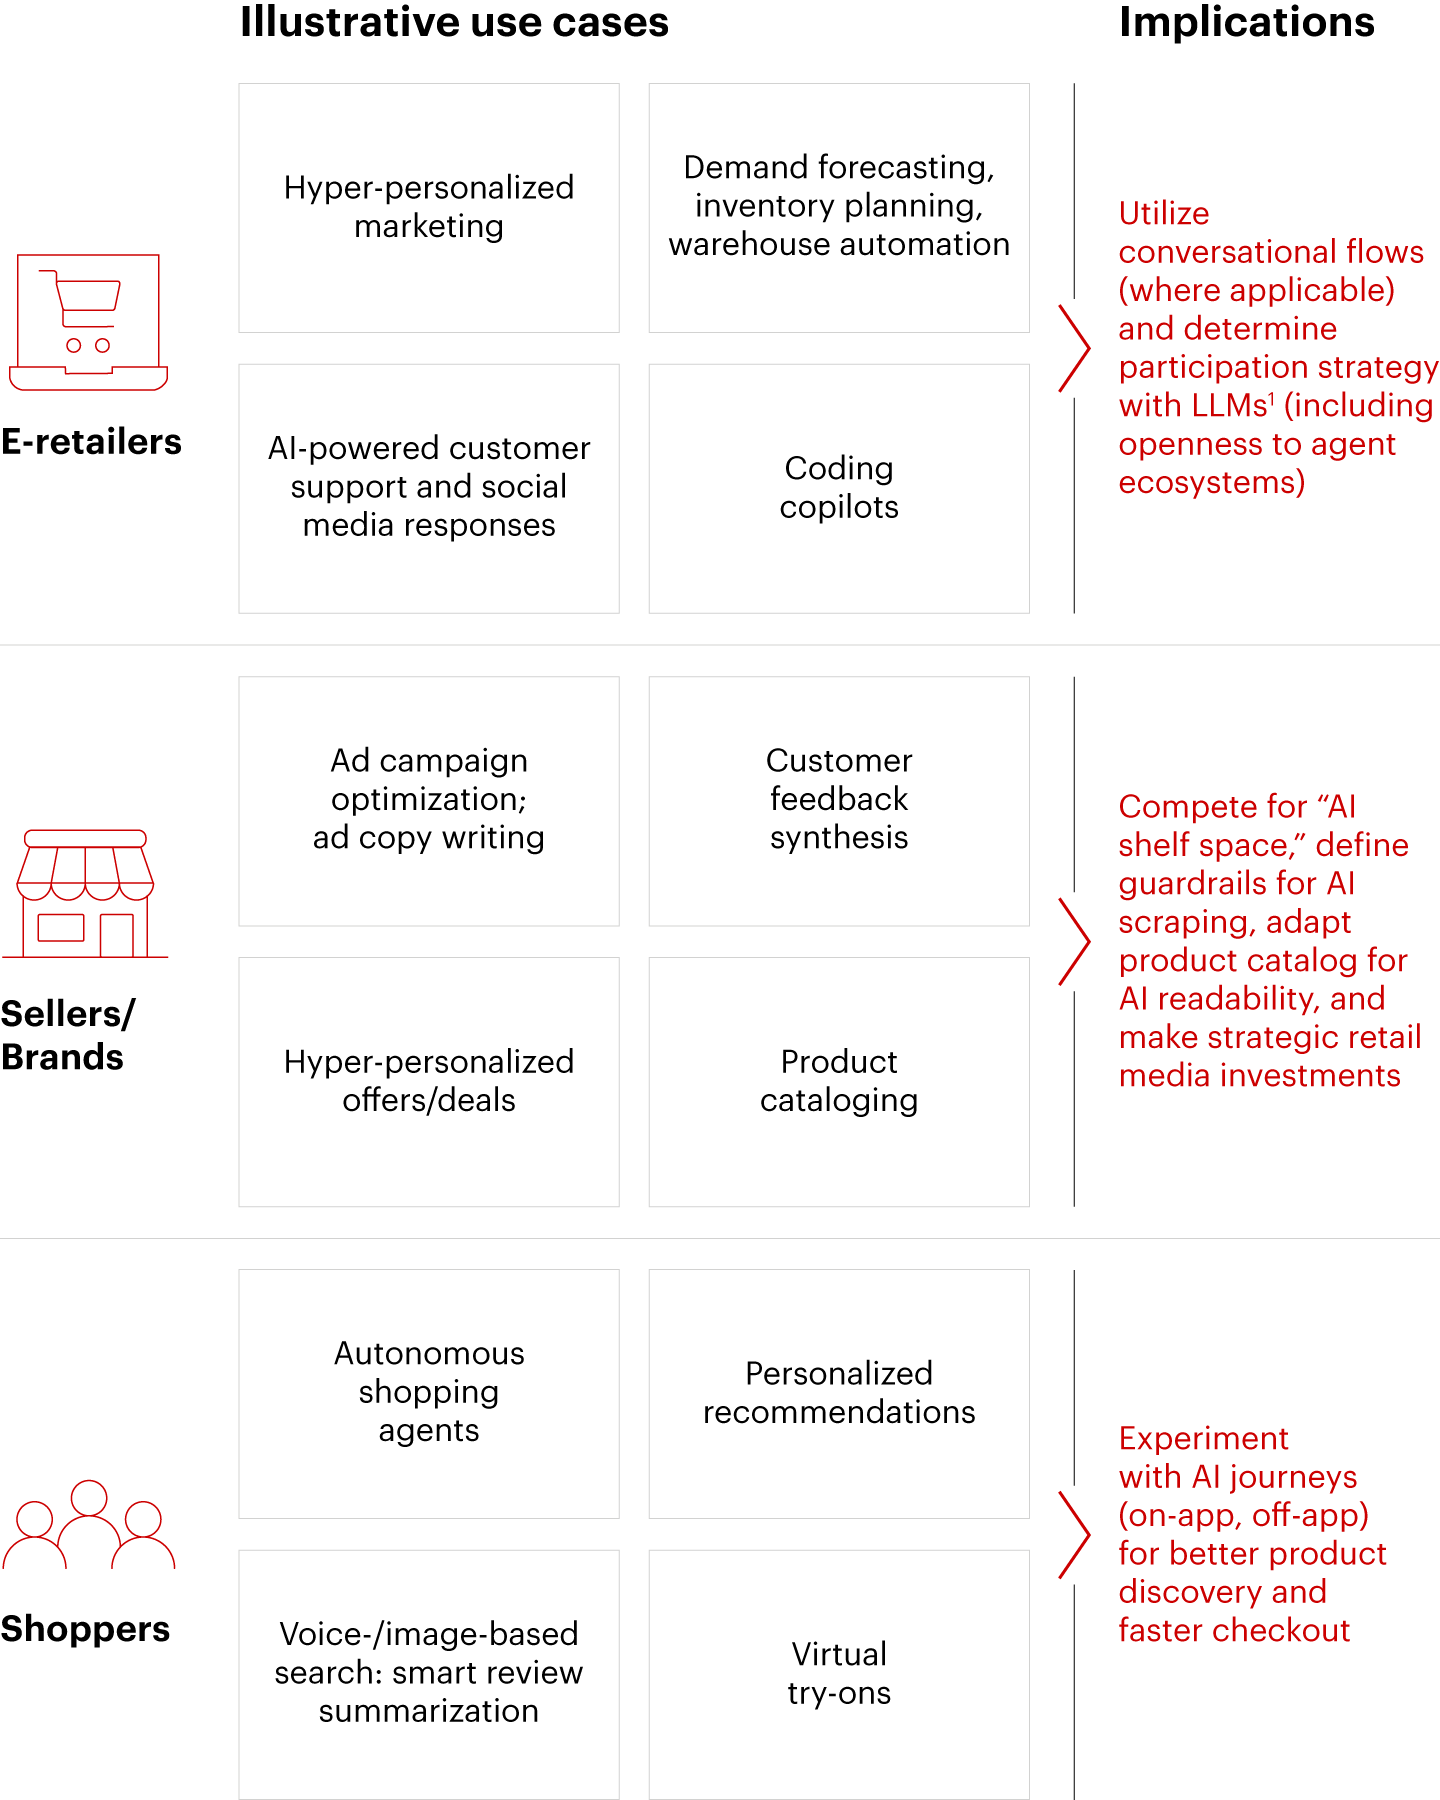

Note: 1) Large language models; not exhaustive, illustrative implications only Source: Market participant interviews
About FlipkartThe Flipkart Group is one of India’s leading digital commerce entities with a strong technology-first foundation and includes group companies Flipkart, Myntra, Flipkart Wholesale, Cleartrip, and super.money. Established in 2007, Flipkart has enabled millions of sellers, merchants, and small businesses to participate in India’s digital commerce revolution. With a registered user base of more than 500 million, Flipkart’s marketplace offers over 150 million products across 80+ categories. Today, there are over 1.4 million sellers on the platform, including Shopsy sellers. With a focus on empowering and delighting every Indian by delivering value through technology and innovation, Flipkart has pioneered services such as Cash on Delivery, No Cost EMI, Easy Returns, and UPI payments. Beyond shopping, Flipkart continues to create jobs, empower entrepreneurs, and strengthen India’s digital economy. |