Report

Executive summary
Macroeconomic overview
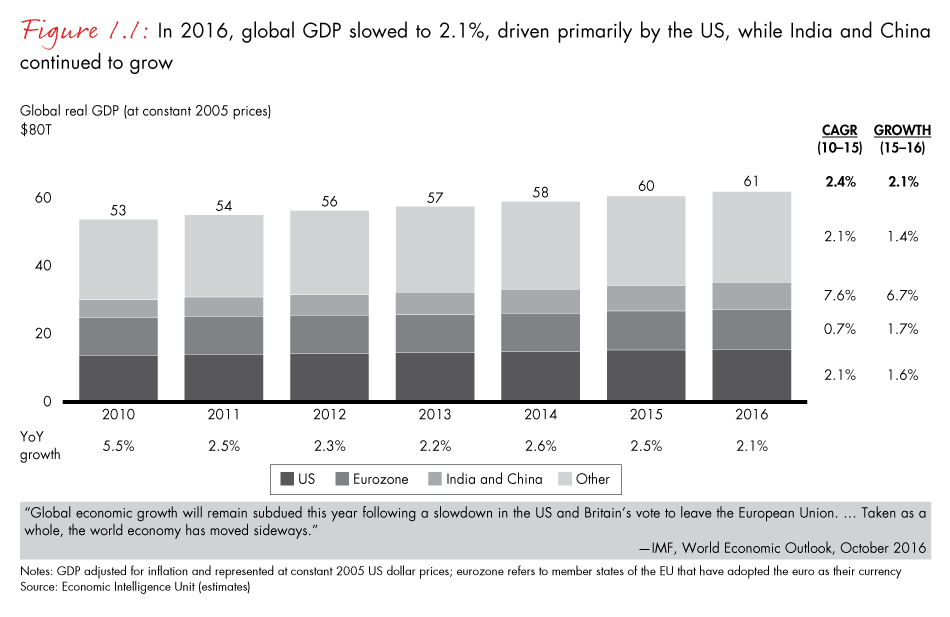
The global economy continued to remain stable but slowed down marginally in 2016, as shown by global GDP growth of 2.1%, compared with 2.4% growth in the previous year. This was partly due to a slowdown in the US economy, where a weak business environment slowed GDP growth from 2.1% in 2015 to 1.6%. The eurozone continued to witness signs of recovery with an overall GDP growth of 1.7%; this was primarily due to exchange-rate depreciation, a boost in consumer spending, quantitative easing by the European Central Bank and declining headline unemployment figures.
In contrast, growth in the top emerging economies increased marginally over the past year. The Economist Intelligence Unit estimates that the economies of BRICS (Brazil, Russia, India, China and South Africa) grew at 4.5%, a marginal increase from 4.3% in 2015.
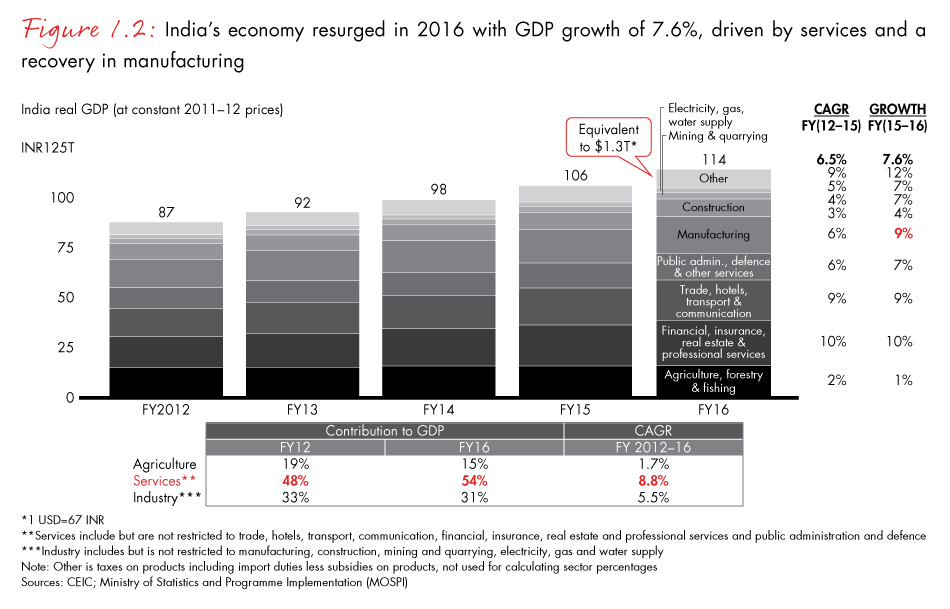
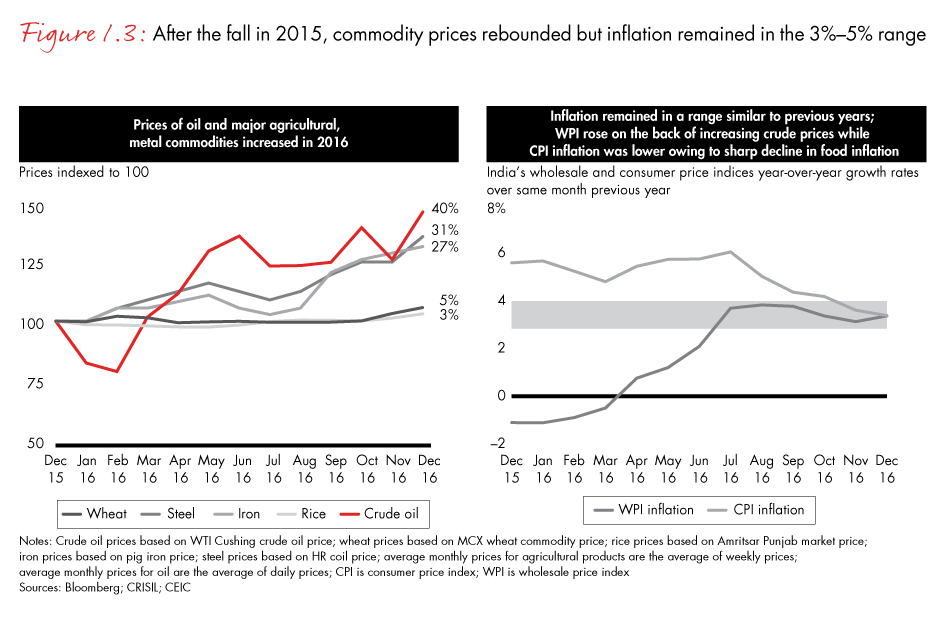
Within BRICS, India grew faster at 7.6% in FY16, compared with 6.5% growth in 2015. The services sector experienced particularly strong growth as its contribution to GDP increased to 54%. In particular, financial services, insurance, real estate and professional services grew at around 10%, leading the sector’s overall growth. Manufacturing witnessed a recovery as well and grew at around 9% in 2016, compared with 6% in 2015. After a dip in 2015, commodity prices for oil, major agricultural items and metal commodities increased in 2016, and inflation remained in the 3% to 5% range. Consumer price index inflation fell sharply in the second half of the year, due to a decline in food grain prices. At the same time, wholesale price index inflation increased due to costlier input material, especially crude oil.
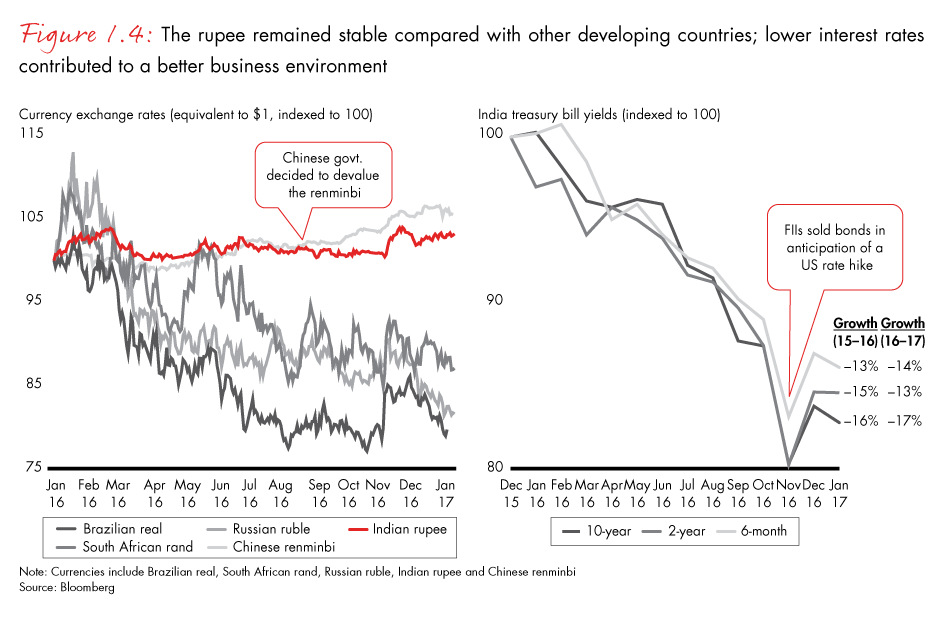
Bond markets in India also do not indicate any inflationary trend as yields on 10-year government bonds continue to drop. They were around 6.4% in January 2017, compared with 7.8% in January 2016.
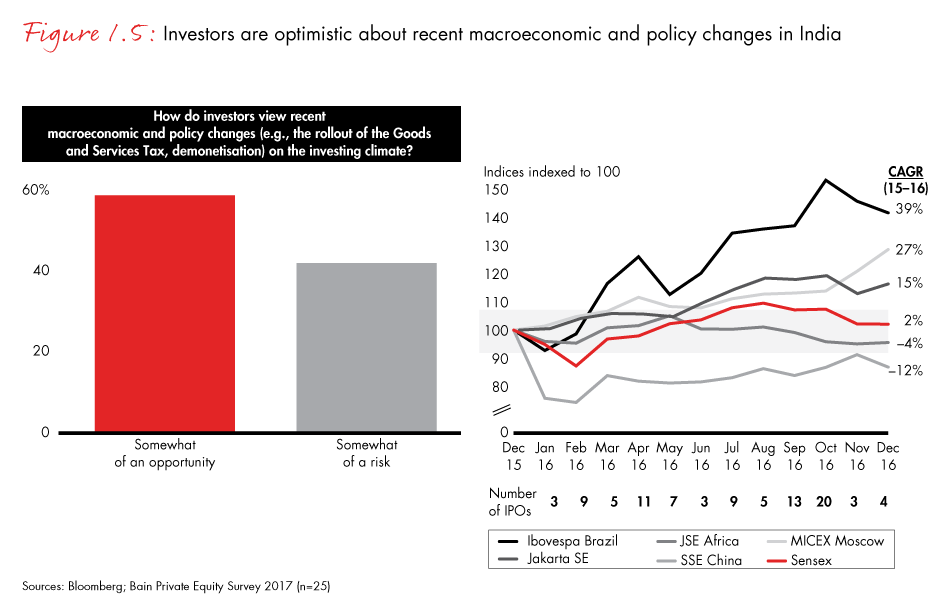
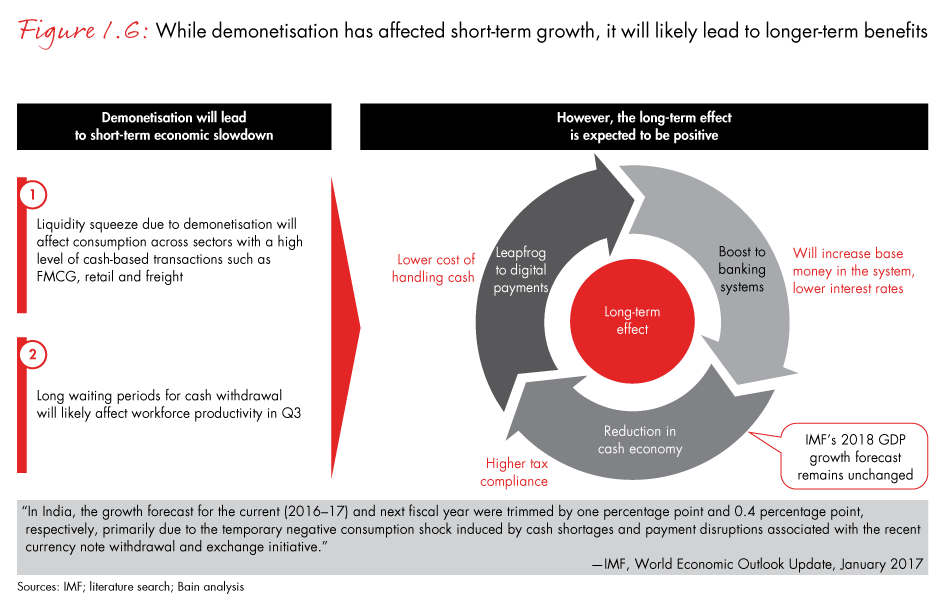
India witnessed some significant macroeconomic and policy changes in 2016, which include the passing of the Goods and Services Tax (GST) Act and “demonetisation,” which on November 8, 2016, rendered Indian 500- and 1,000-rupee currency notes, about 85% of the total bank notes in circulation, illegal. However, most surveyed investors in India believe these changes are a positive step and an opportunity. They believe that while demonetisation may affect short-term growth due to a sudden liquidity squeeze and long waiting periods for cash withdrawal, it should have a long-term benefit. The intended benefits and outcomes of demonetisation include turbocharging digital payments, boosting traditional banking by increasing the base money in the system and reducing the cash economy, which should result in higher tax compliance. Today, the implications of demonetisation are still being determined. However, despite these policy changes, the Indian stock market (Sensex) also remained more or less stable during this period. To attract investment, India will need to continue making it easier to do business in the country, a large part of which involves a regulatory environment that is more conducive to business growth. Towards this goal, the government has encouraged investments through policies such as Make in India, tax regime rationalisation and Startup India, and it has set up the National Investment and Infrastructure Fund (NIIF) to enhance infrastructure financing in India. The government is also fast-tracking approvals for industry and infrastructure projects, as well as relaxing Foreign Exchange Management Act (FEMA) rules to provide easier access to capital for domestic investment funds.
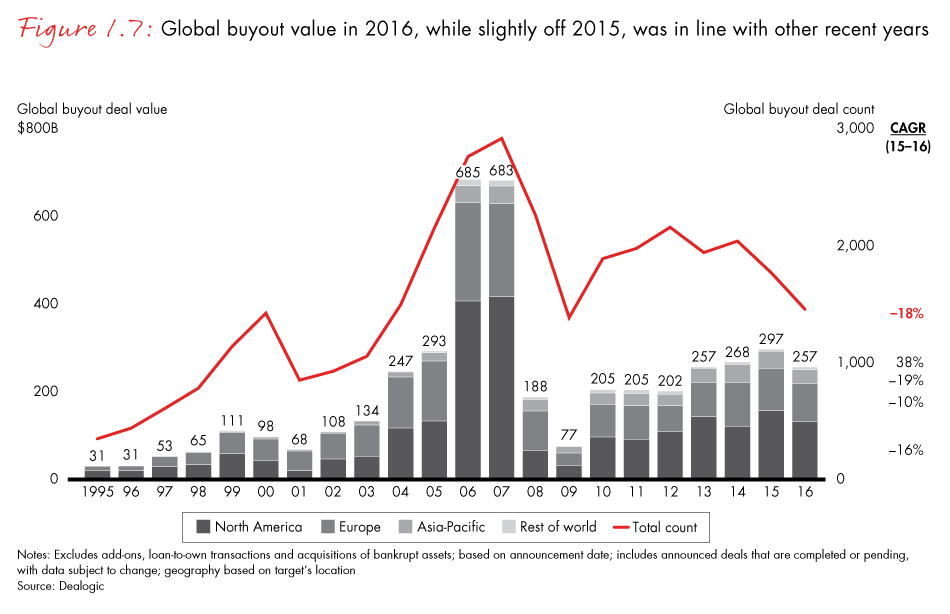
In 2016, the global buyout value dipped to $257 billion from the 2015 level of $297 billion. North America saw a 16% decrease to $132 billion, and Asia-Pacific saw a 19% decrease to $31 billion. What we saw in the Asia-Pacific region over the past year was a rapidly maturing private equity (PE) industry. Instead of getting blown around by global crosswinds, it performed—surprisingly well—according to its own fundamental strengths and weaknesses. Returns kept growing and limited partners (LPs) remained cash positive, indicating that the PE investment cycle is solidly self-sustaining.
Fund-raising
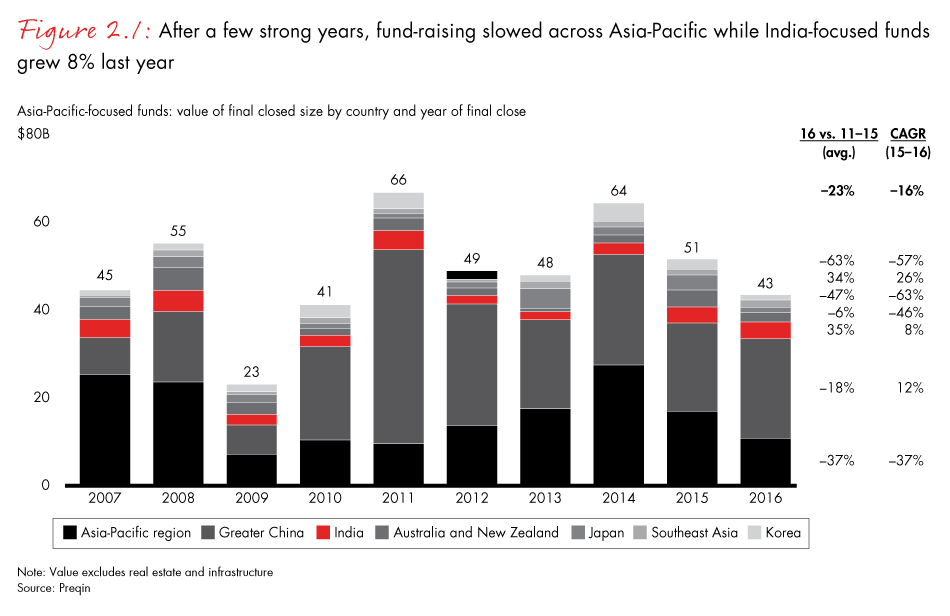
After allocating $115 billion to funds focused on the Asia-Pacific region over the previous two years, it’s unsurprising that investors looked elsewhere in 2016. Total funds raised in the region dropped almost 16% from a year earlier to $43 billion and slipped to 9% of the global total from 11% in 2015. Results from the Bain Private Equity Survey indicate that general partners (GPs) sitting on a mountain of dry powder may not have been giving fund-raising their full attention during 2016. Their priorities were buying companies and working on their existing portfolios— not beating the bushes for fresh capital. That may change in the coming year, however. Deals and portfolio management will continue to be priorities, but many GPs indicated they will be refocusing on fund-raising as well. Close to 70% said they will launch a new fund in the next 12 to 24 months.
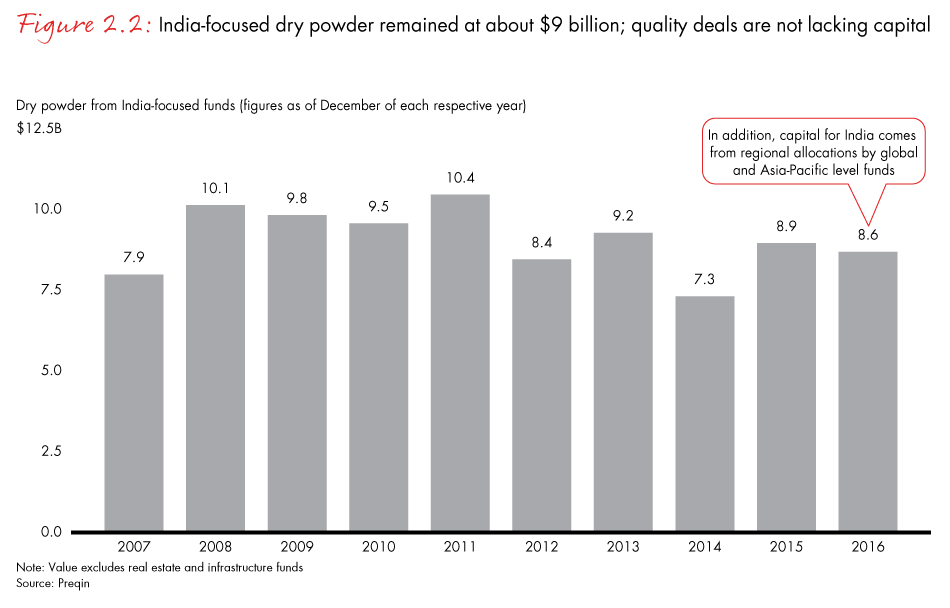
However, India continued to be an attractive destination for investments, as funds allocated to India increased by 8% over the previous year. Standing at $9 billion, Indian dry powder remained at levels similar to 2015, indicating no dearth of capital for good-quality deals. In addition, India sees incremental capital from regional allocations from global and Asia-Pacific-focused funds, which is not reflected in the above number.
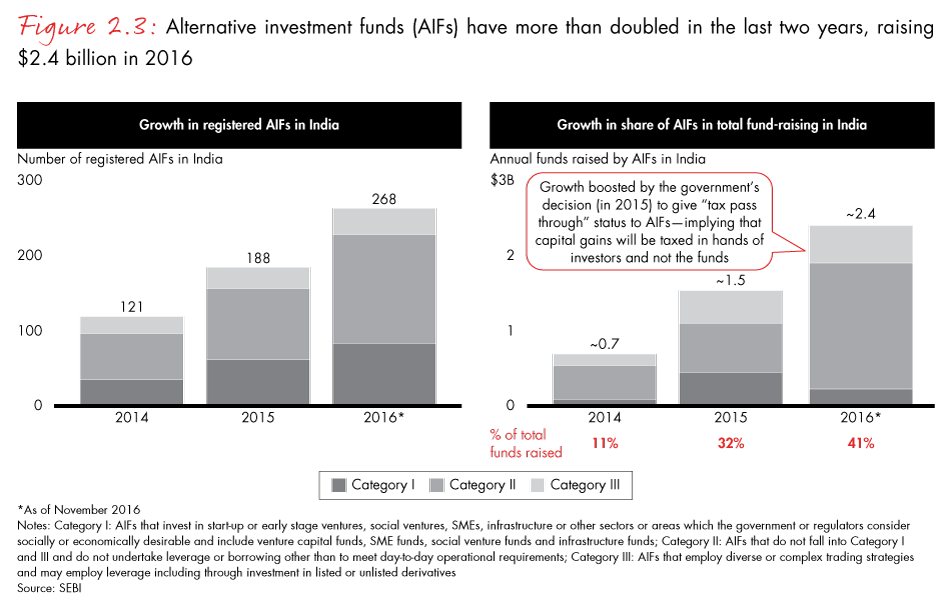
New asset classes like alternative investment funds (AIFs) have grown in the Indian market, aided by government regulations and tax breaks. Registered AIFs in India have more than doubled over the past two years and stood at approximately 270 in 2016. AIFs have also been a significant contributor to overall fund-raising in the Indian market and contributed to 41% of the total India-focused funds raised in 2016, compared with only 11% in 2014.
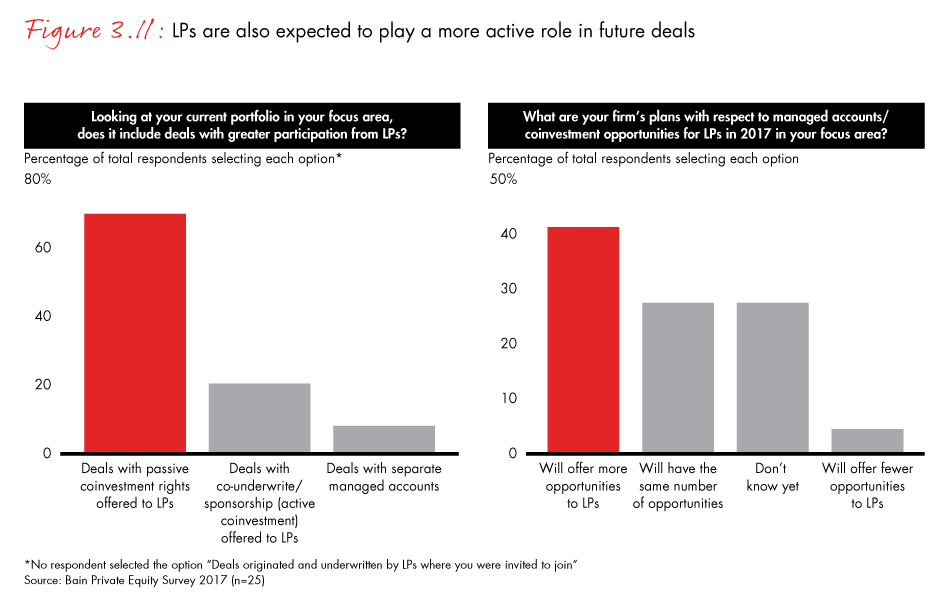
A majority of funds reported greater participation from LPs in the form of passive coinvestment rights in their current portfolio. Funds expect LPs to play a more active role in 2017 and will likely offer more coinvestment opportunities.
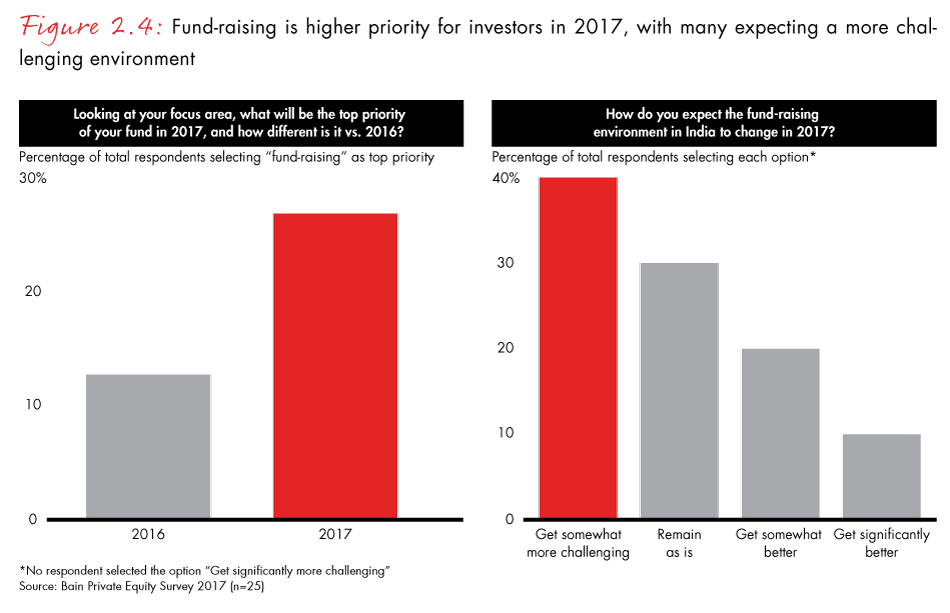
Fund-raising is expected to be a higher priority for funds in 2017. However, most believe that the fund-raising environment will become even more challenging in the coming year.
Deal making
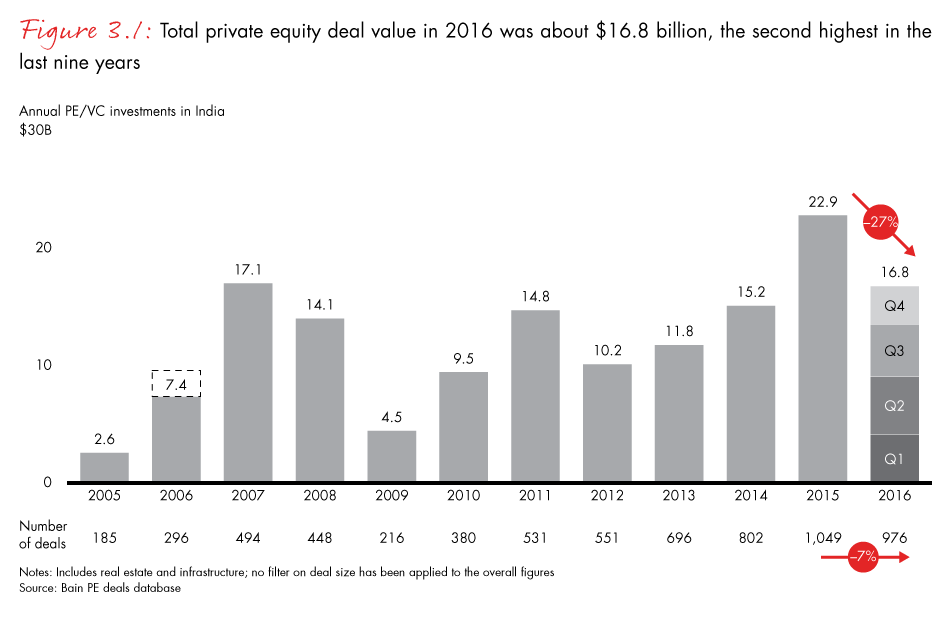
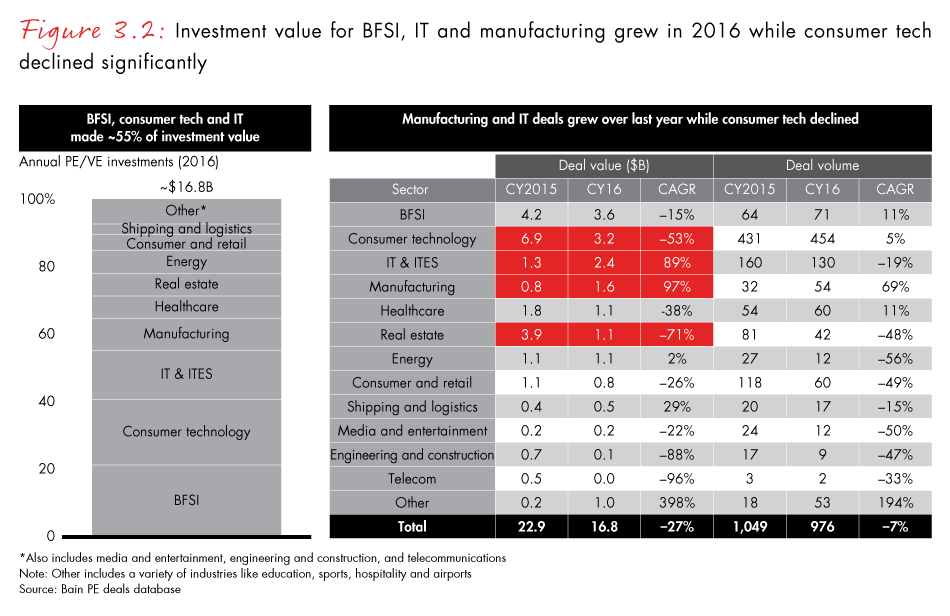
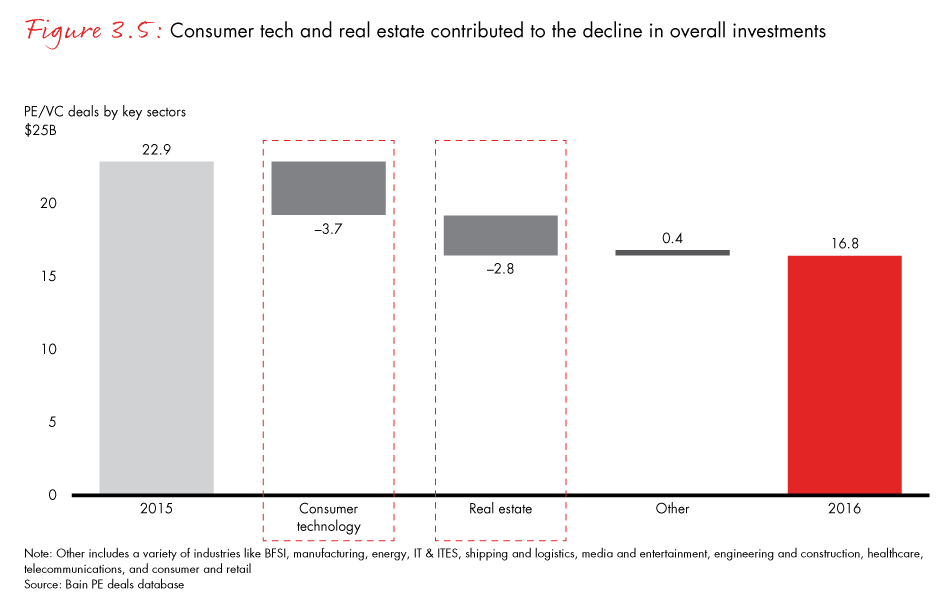
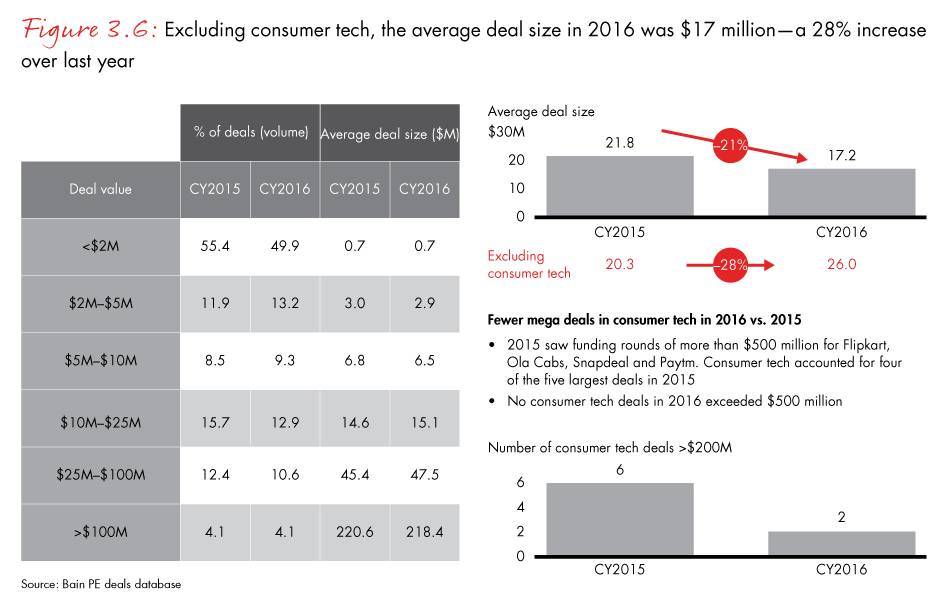
India continued to be a healthy market for deal making in 2016. At $16.8 billion, its total deal value in 2016 was the second highest in the past nine years. While the deal value in 2016 was lower than the high point of 2015, the drop is primarily the result of a slowdown in large consumer technology deals. While consumer technology remains an exciting sector with plenty of opportunities and potential to grow, significantly high levels of investment in previous years, questions about the economic sustainability of the business models and high valuations cautioned investors in 2016. Excluding consumer technology and real estate, investment value in 2016 was actually marginally higher than it was the previous year.
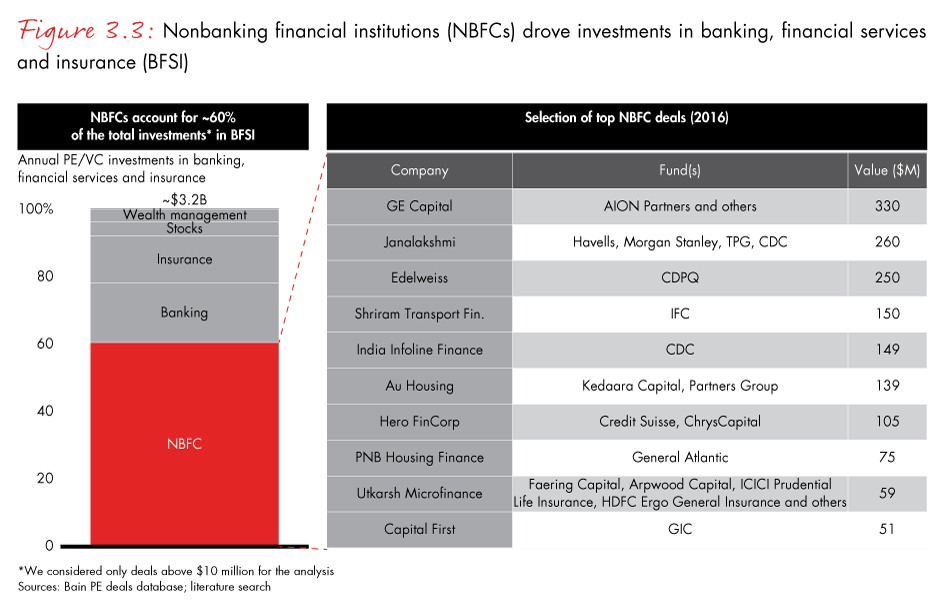
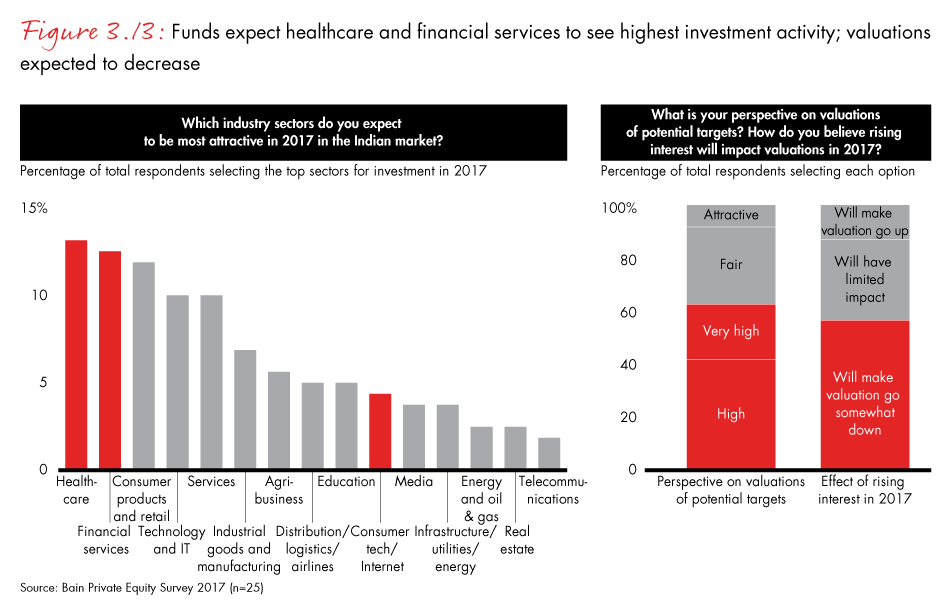
Banking, financial services and insurance (BFSI), IT and manufacturing were high-growth sectors and contributed to half of the total deal value. Deals in the BFSI sector were fuelled by multiple investments in nonbanking financial companies (NBFC) that have thrived in segments that are either inaccessible or unattractive for traditional banks. NBFC business models demand heavy infusions of capital, and investors were ready to deploy capital in strong-performing pure-play NBFCs, housing finance companies and microfinance institutions. Investments in Janalakshmi Financial, Edelweiss and Shriram Transport Finance were some of the large NBFC deals of 2016. Consumer technology, while declining in deal value, still remains an important focus sector and contributed to 20% of the total deal value. Most surveyed GPs expect healthcare and BFSI to be key sectors of investment in 2017. However, most also believe that current asset valuations are high and will likely be tempered in the coming years.
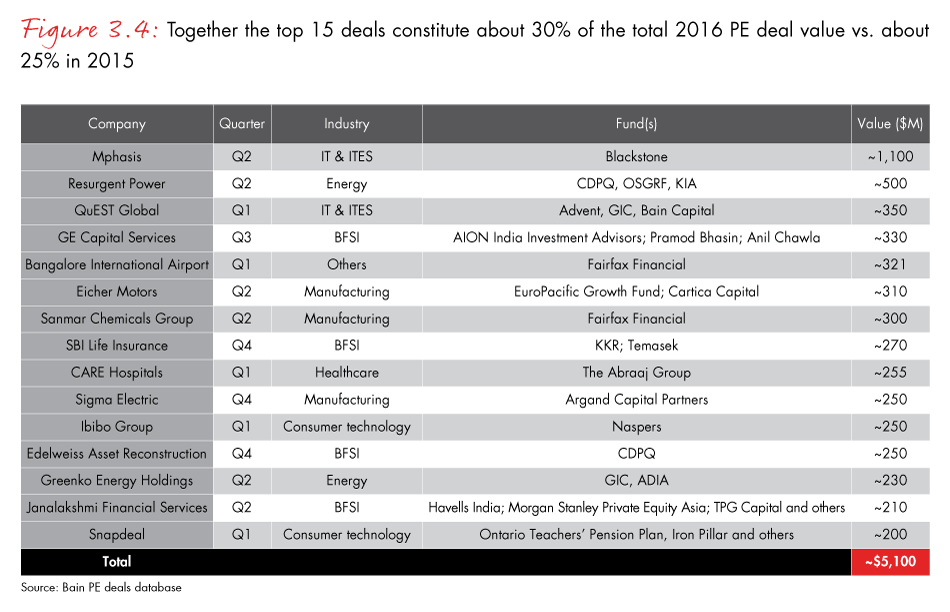
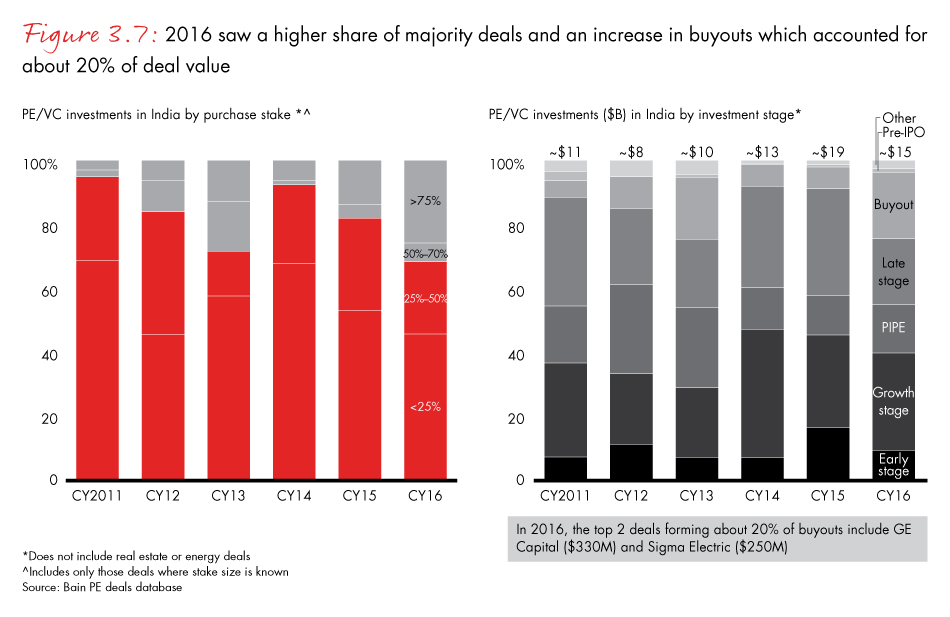
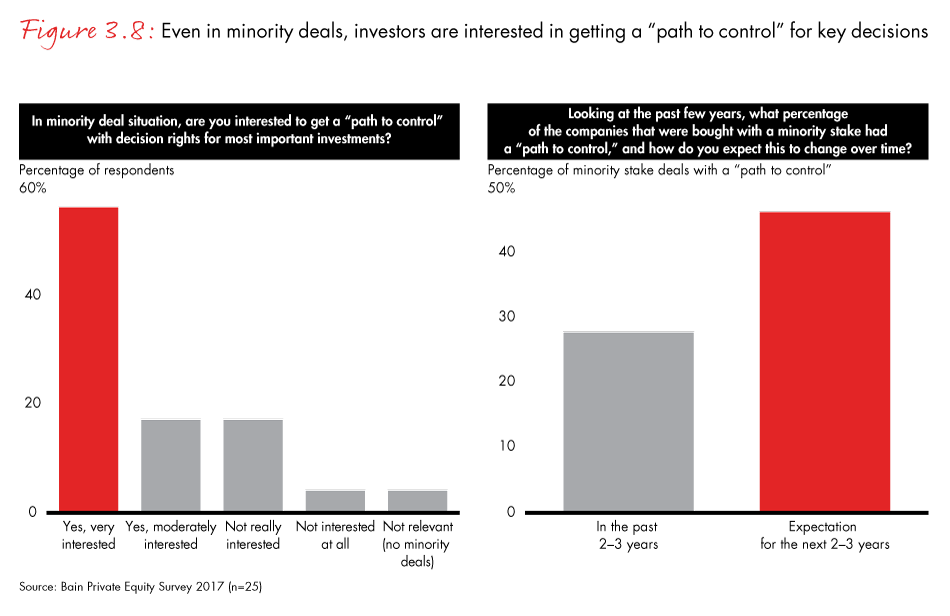
A few large deals dominated the market in 2016. The top 15 deals contributed to 30% of total investment value in 2016, compared with 25% in 2015. Average deal size came down from $22 million in 2015 to $17 million in 2016. However, excluding consumer technology, average deal size actually increased by 28% over 2015. The overall decline reflected a lack of mega deals in the consumer technology sector—while 2015 had seen multiple deals greater than $500 million, there was no deal greater than that sum in 2016. The share of majority deals grew in 2016. Even in minority deals, surveyed investors are interested in getting a path to control for key decisions. While early-, growth- and late-stage deals are still prominent investment types, buyout deals spiked in 2016 and contributed to 20% of total deal value.
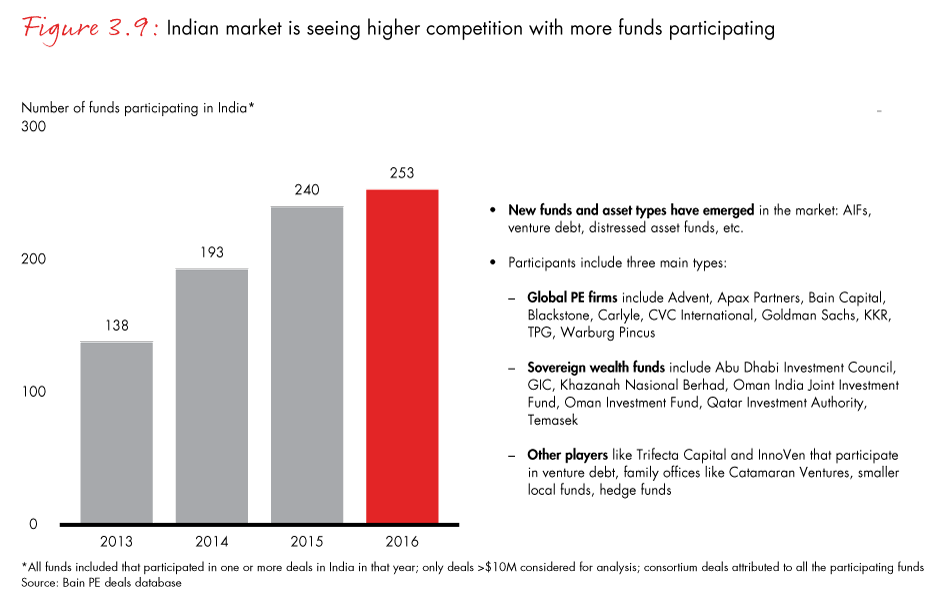
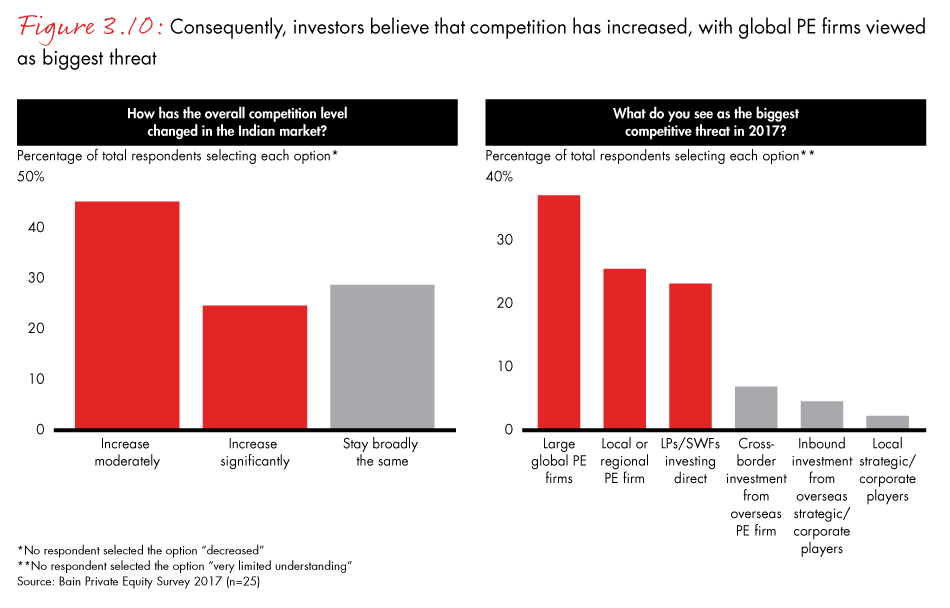
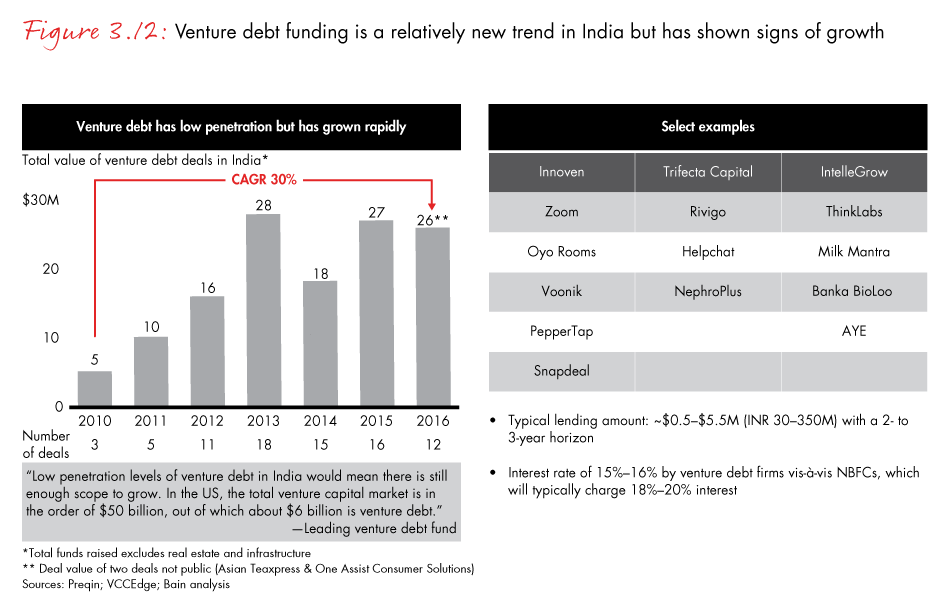
Competitive intensity in the Indian investment market has progressively increased, and we now have more than 2501 participating and active funds. Surveyed investors believe that large global private equity funds looking at India as an investment destination will be the most important source of competition in the future. New deal structures such as venture debt are also fast emerging as a trend in the Indian market, with companies like InnoVen Capital, Trifecta Capital and IntelleGrow showing increased activity.
Exits and portfolio management
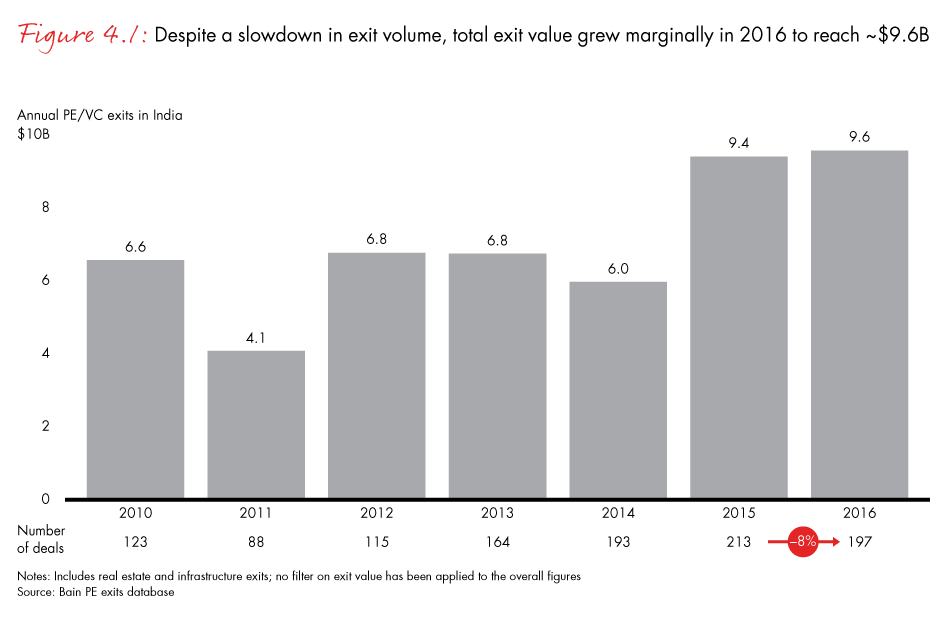
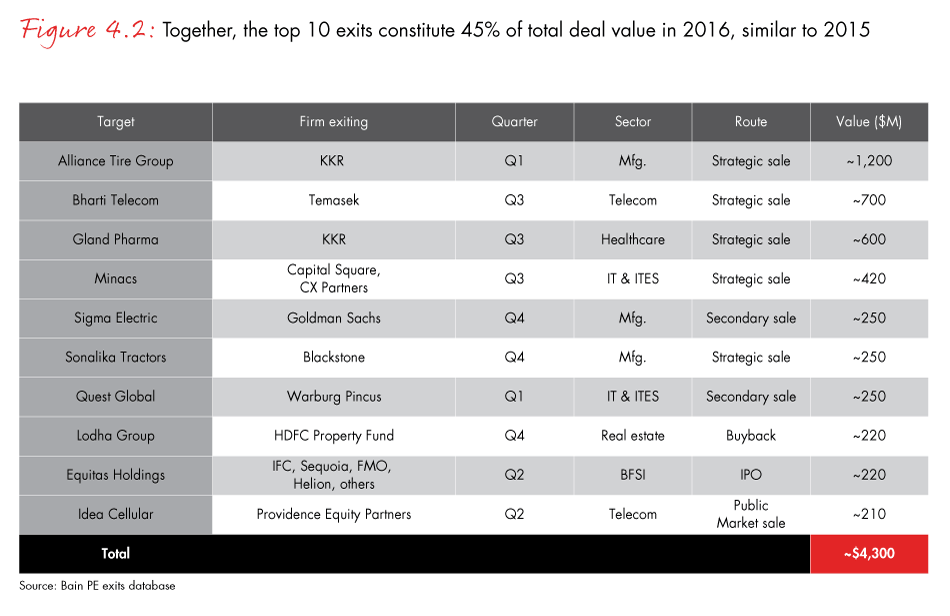
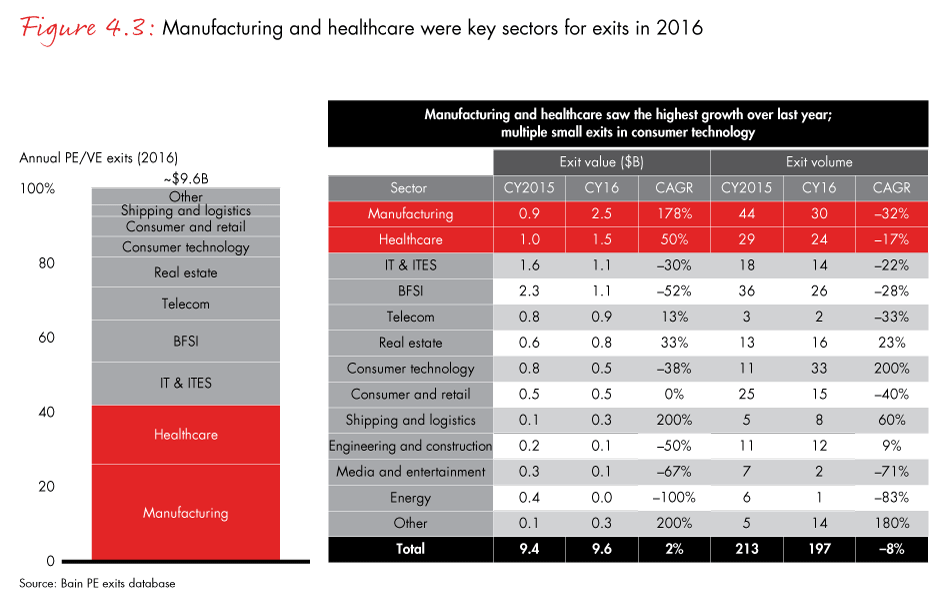
Last year was a good one for exits, which should signal confidence to investors and funds. Total exit value grew marginally by 2% to reach $9.6 billion from $9.4 billion in 2015. This happened even as the total reported exits declined by 8%. Top 10 exits constituted around 45% of total exit value, similar to 2015. Manufacturing, healthcare and IT were key sectors that contributed to almost half of the entire exit value.
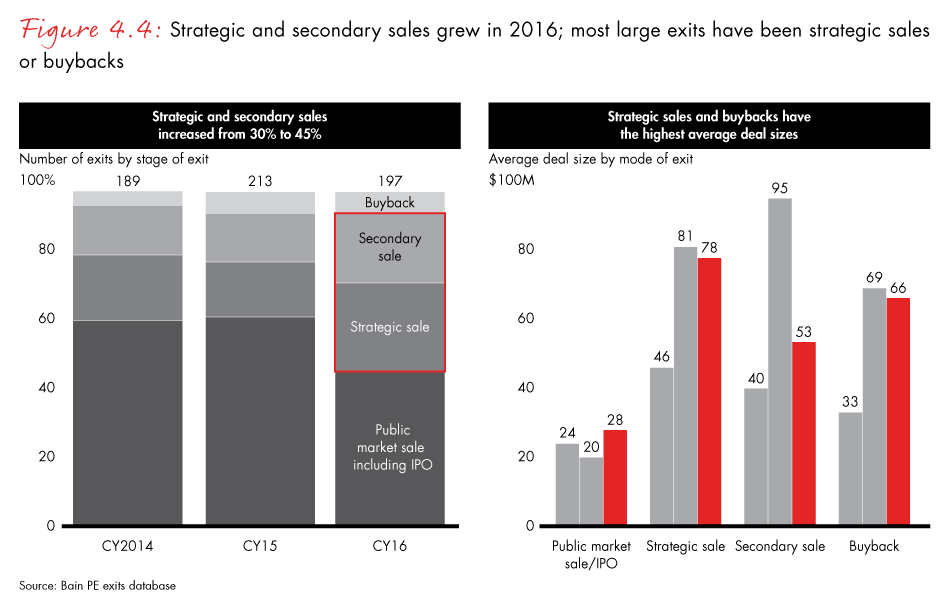
Public market sales including IPOs were subdued last year, and there was a marked increase in the number of strategic and secondary sales. Average deal sizes were significantly higher for strategic sales and buybacks.
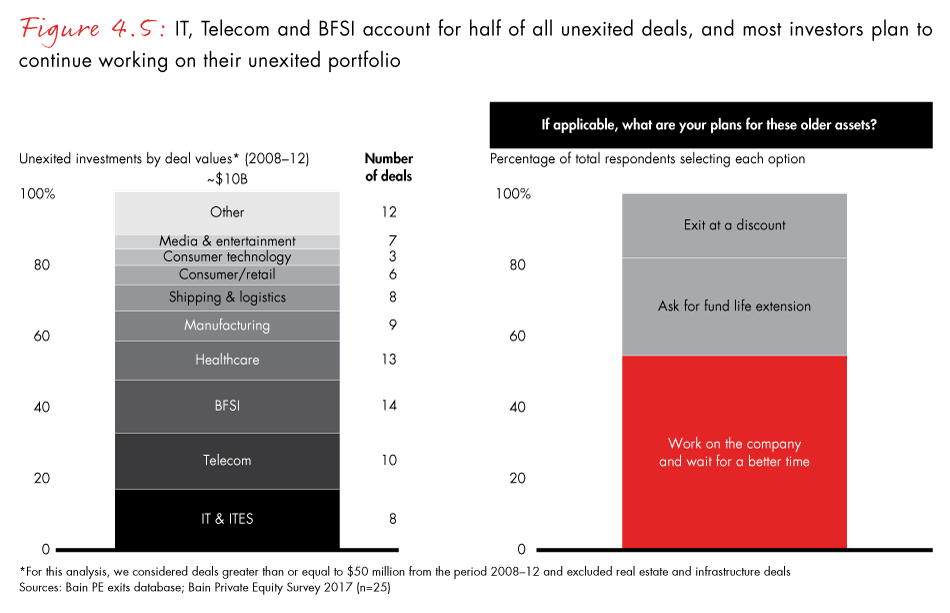
Of the several unexited deals from the 2008–2012 vintage, most are in the IT, telecom and BFSI sectors. PE funds aim to adopt a wait-and-see policy for these deals in 2017 and plan to continue working on the portfolio in the meantime.
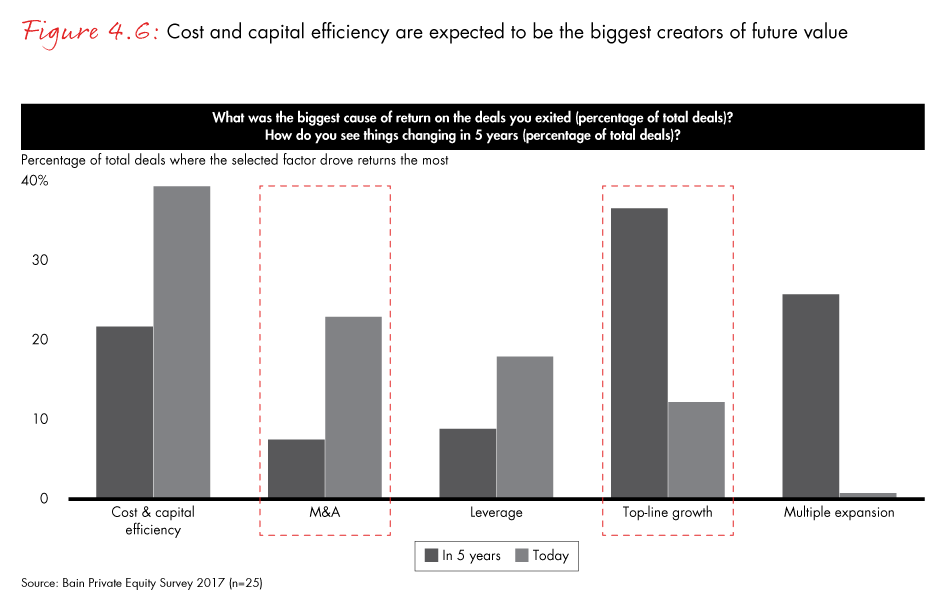
While majority funds believe that top-line growth is a key factor in value creation today, they expect this to change over the next few years. Cost and capital efficiency, as well as inorganic M&A, are expected to be key value-creation levers in the future.
In focus: Value creation in portfolio companies
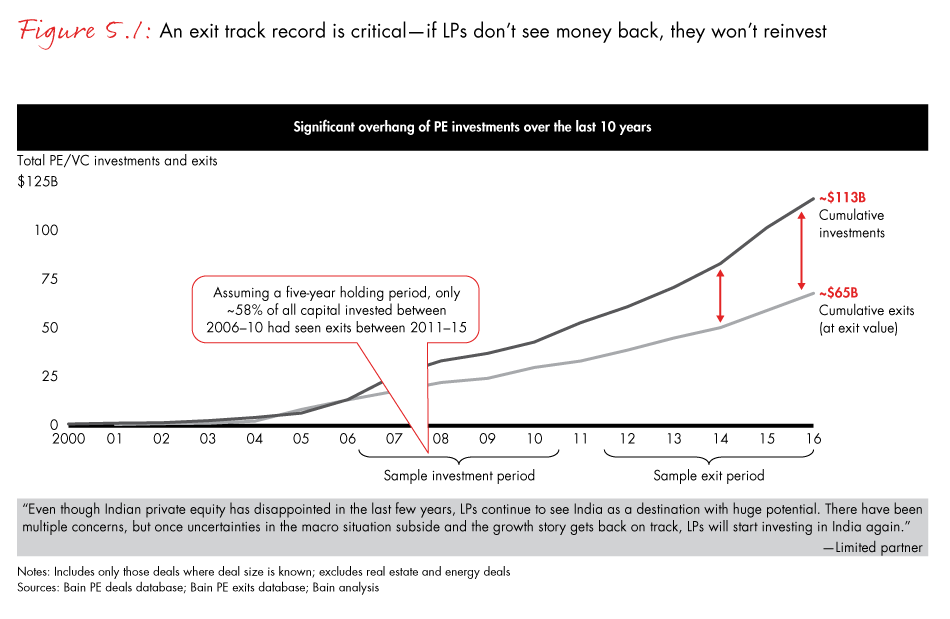
The exit track record is critical for continued investment in private equity in India. If LPs don’t see their money back, they will likely not reinvest. Exits signal confidence in the market and an ability to recover capital. Today, there is an overhang of approximately $50 billion in the Indian market. Consequently, being able to consistently create and unlock value in portfolio companies becomes even more important.
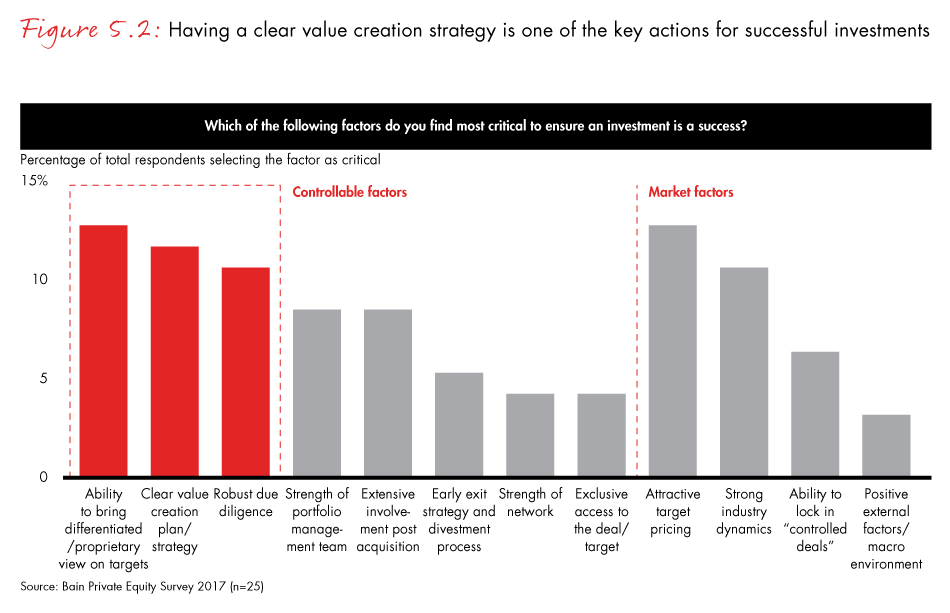
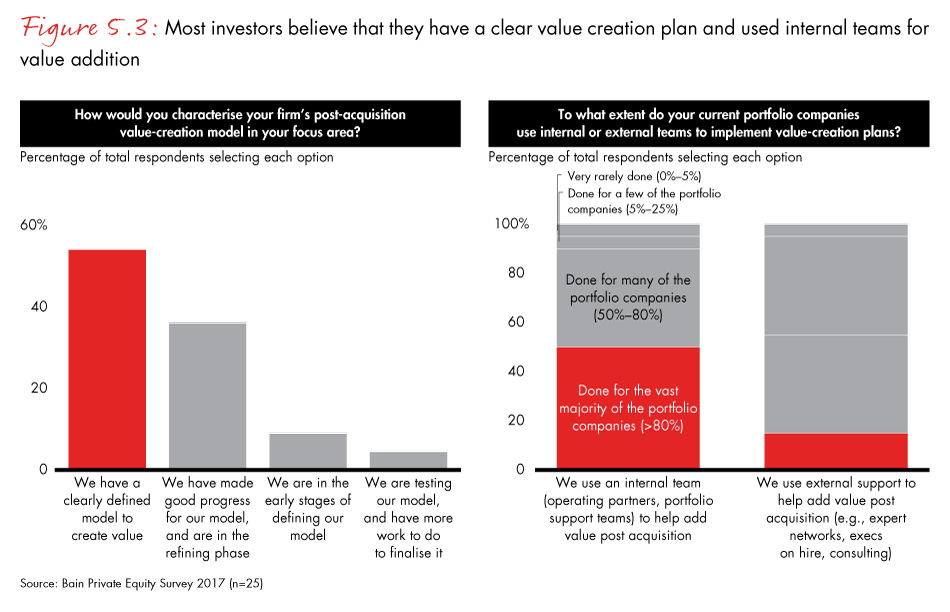
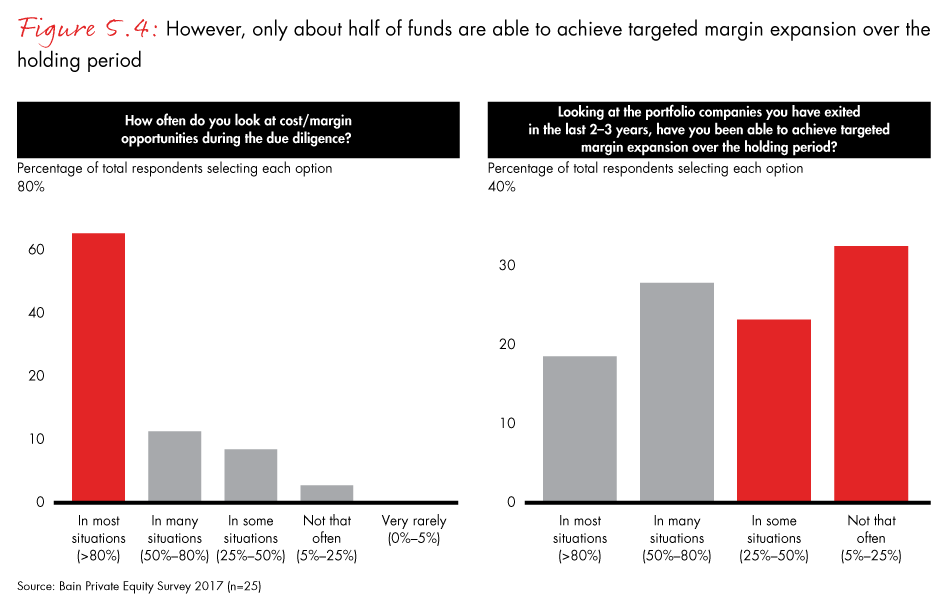
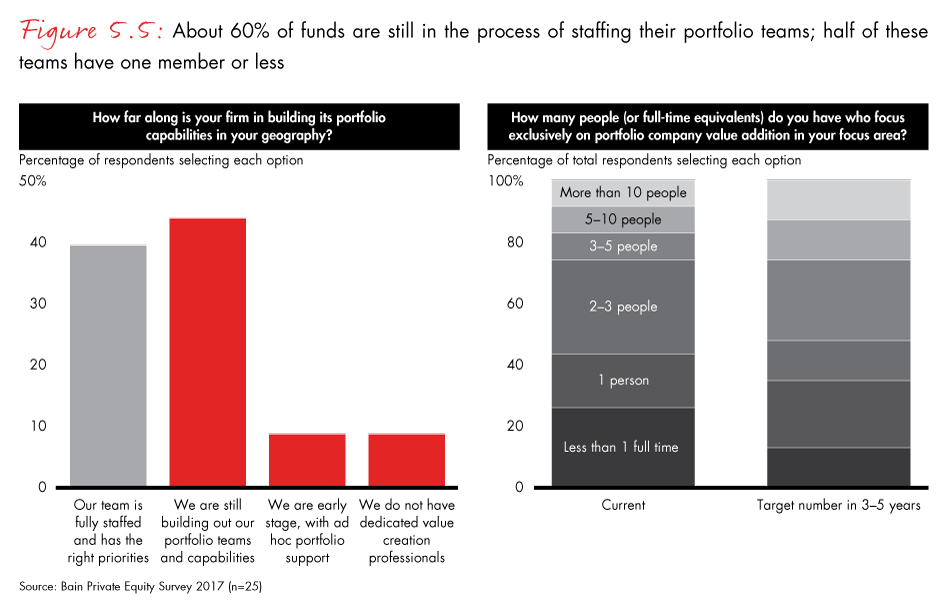
Surveyed investors identify a differentiated view on the target company and a clear value-creation plan as key levers for successful investments. Most investors believe they almost always have a clearly defined value-creation plan and strategy. Additionally, most GPs leverage internal teams, including operating partners and portfolio-support teams, to help add value to the company after acquisition. However, investors face several challenges in realising their plans: Only half of the surveyed funds achieve the targeted margin-expansion plans during the holding period. Additionally, 40% of the surveyed funds have one team member or less in charge of adding value to the portfolio company. This is in sharp contrast to the stated ideal of having anywhere from three to five people in portfolio teams.
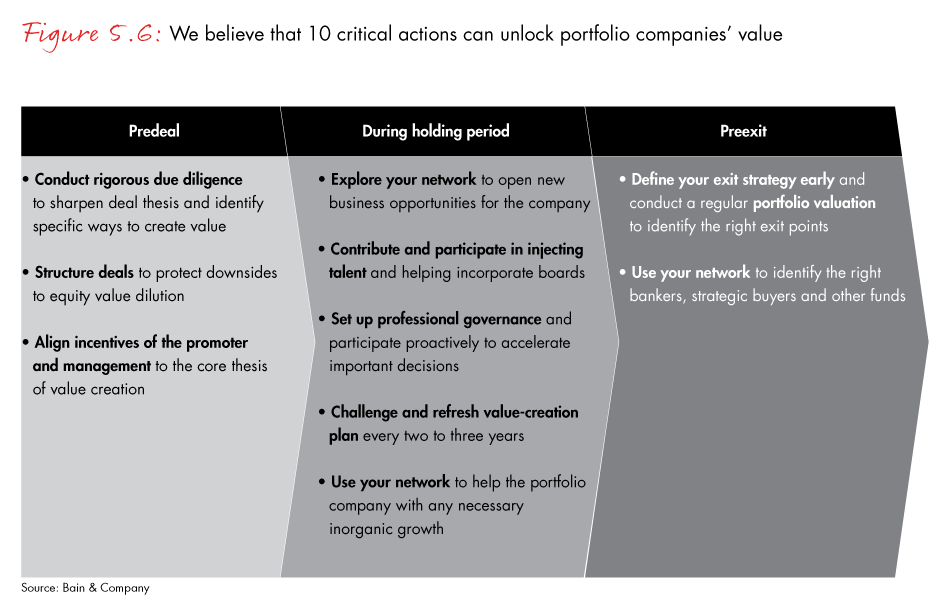
As mentioned before, 2016 was a good sign for exits and gave us several examples of successful value creation. There were a number of large exits at attractive return multiples across various sectors. We believe there are 10 critical actions to unlock value in portfolio companies across the different life stages of a deal.
Predeal:
- Conduct rigorous due diligence to sharpen deal thesis and identify specific value-creation levers.
- Structure deals creatively to protect against dilution of equity value.
- Align incentives of the promoter and management with the thesis of value creation.
During holding period:
- Sweat the network to open new business opportunities for the company.
- Contribute and participate in injecting talent and helping incorporate boards.
- Set up professional governance and participate proactively to accelerate select decisions (balanced activism).
- Challenge and refresh the value-creation plan every two to three years.
- Leverage your network to help the portfolio company with any necessary inorganic growth.
Preexit:
- Define the exit strategy early and conduct regular portfolio valuation to identify the right exit points.
- Leverage the network to identify the right bankers, strategic buyers, other funds and so on.
Case study 1
One of the largest exits of 2016 was KKR’s sale of Alliance Tire Group (ATG), a global off-highway tire manufacturer with a presence in more than 120 countries across six continents.
KKR acquired the company in a secondary buyout in 2013. By that time, ATG had scaled to a capacity of approximately 73,000 tonnes annually, yet it had potential to elevate to the next level with the assistance of the right financial and operational partner by achieving even greater capacity, further expanding its global reach and increasing its market share.
In the three years of KKR’s ownership, members of both the KKR private equity deal team and KKR Capstone—a team whose mission is to create value by identifying and delivering sustainable operational performance within KKR portfolio companies—pinpointed a number of early financial and operational initiatives that could maximise ATG’s potential and position it for growth. These included introducing ATG’s team to original equipment manufacturers, which could enable its expansion into newer areas, and leveraging ATG’s strong procurement expertise in Asia to help streamline some of the company’s sourcing. KKR also focused on enhancing ATG’s “go-to-market” effort in North America, strengthening distributor relationships in Europe, and unlocking supply chain and manufacturing constraints in India and Israel—all while maintaining a cost focus.
KKR and KKR Capstone members further assisted ATG in proactively sourcing M&A targets to scale the company and optimised the company’s working capital through the KKR Capital Markets team. An executive in KKR Capstone served as ATG’s interim COO for nine months to fill a management gap while the team assisted ATG in hiring a permanent COO.
In July 2016, KKR completed the sale of ATG to Yokohama Rubber Company, a top-10 global tire manufacturer based in Japan. During KKR’s investment period, ATG’s volume rose by more than 40%, and production capacity and global market share rose by approximately two times.
Case study 2
Another successful exit in 2016 was Advent’s exit from Care Hospitals. Advent had bought a stake in Care Hospitals, a multispecialty healthcare provider, in 2012 at a price of around $125 million. Over the next four years, Advent developed and implemented several value-creation initiatives in the portfolio company.
Advent defined a clear set of value-creation factors at the onset—procurement optimisation, greenfield growth, expansion into new specialties and broader management strengthening, including a new CEO and a greenfield projects team. Despite having close to 15 hospitals, there was room for improving centralised procurement at Care Hospitals. The company ran a three-year procurement exercise and set up a clinical committee of some of the most senior doctors to push for procurement cost optimisation. The team set up a robust governance cadence of monthly reviews of compliance and takeaways to ensure the procurement optimisation plan was on track.
The company also succeeded in expanding the services offered at Care Hospitals. Care Hospitals originally specialised primarily in cardiac sciences and emergency. Over the last few years, they built new practices like orthopaedics, organ transplant and laparoscopy while also reinvigorating other practices such as neurology. For greenfield expansion, Advent got an operating partner on board who had built several hospitals himself and was deeply involved with the portfolio company for the first couple of years. Advent also invested in refurbishing large existing units, such as the Banjara Hills, Hyderabad, facility, and built a large standalone outpatient centre.
By the time of Advent’s exit from Care Hospitals, the hospital saw robust growth in patient volume and double-digit growth in both operating revenue and EBITDA. Advent exited Care Hospitals through a strategic sale to the Abraaj Group.
Implications
Overall, 2016 was a good year for private equity in India. Even after accounting for a slowdown in consumer technology, deal value and volume were the second highest of the last nine years. BFSI emerged as a key sector of interest for private equity and venture capital in 2016. New asset classes and fund types emerged, which include alternative investment funds and structuring deals through venture debt. LPs are continuing to focus on returns from India, even as competitive intensity in the market grows with an increasing number of funds. The exit climate was healthy in both value and volume. Value creation is a clear focus area for most investors, with capital and cost efficiency expected to be a key lever for unlocking value in portfolio companies.
1. Macroeconomic overview
- On the macroeconomic front, 2016 was a mixed year. The US economy slowed down on the back of weak business investment that picked up only in the second half of 2016. However, the eurozone economies had a resurgence of private consumption. India and China continued to maintain healthy growth rates of about 7%, similar to 2015.
- The macro environment in India showed signs of strengthening in 2016. GDP growth was strong in key sectors, and inflation remained in the 3% to 5% range. The currency was stable when compared with most emerging market peers. And interest rates decreased, which helped bolster the business climate.
- Investors remain quite optimistic about the effect of recent macroeconomic and policy changes, such as the GST and demonetisation, on the investment climate. Investors believe that demonetisation is likely to affect only short-term economic growth while being more beneficial in the longer run.
2. Fund-raising
- Fund-raising in Asia-Pacific declined by about 16% to $43 billion in 2016 (vs. $51 billion in 2015); India continued to be an attractive destination for investments, as India-focused funds increased by 8% in aggregate to reach $4 billion.
- India-focused funds are carrying approximately $9 billion in dry powder, similar to 2015 levels, reaffirming the potential for investments in the Indian market.
- New asset classes and fund types continue to emerge in India. AIFs showed robust growth in 2016 and became 41% of total funds raised vs. 11% in 2014.
- While fund-raising is a high priority for investors in 2017, they believe the fund-raising environment will get more challenging.
- LPs are expected to play a more active role in deals in 2017, and investors are likely to offer more coinvestment opportunities to them in the coming year.
3. Deal making
- Total PE deal value in 2016 was the second highest since 2008 at about $16.8 billion. Excluding consumer technology and real estate, investment value in 2016 was higher (by $0.4 billion) vs. 2015.
- BFSI attracted the highest investments and continues to be an attractive sector for investors. Deal making spiked in IT/ITeS and manufacturing, but consumer tech, while still substantial, saw a decline in investment value.
- The top 15 deals contributed to 30% of total investment value vs. 25% in 2015.
- Early- and growth-stage deals continue to be the most dominant stages of investment (40% of deal value); majority and buyout deals have increased in 2016, indicating an inclination for more control by investors.
- Competition for deals is increasing with growth in the number of participating funds. India-focused funds believe that competition from large global PE firms is a key concern.
- New asset classes such as venture debt and distressed assets are emerging in India, offering more opportunities for capital deployment.
- Making new deals will be the top priority for funds in 2017. Funds expect BFSI and healthcare to see maximum investment activity in 2017.
- Investors view the current valuations as high, but expect a slowdown in 2017.
4. Exits and portfolio management
- 2016 was a good year for exits, which should signal confidence for investors. The total exit value grew marginally by about 2% to reach $9.6 billion, while the number of exits declined by 8%.
- Top 10 exits together constitute 45% of total PE deal value in 2016, similar to 2015.
- The healthcare and manufacturing sectors saw the highest exit activity and accounted for 40% of the total exit value. IT, telecom and BFSI accounted for 50% of unexited deal value from the 2008 to 2012 investment period.
- Although public market sales continued to be prominent modes of exit, secondary and strategic sales increased by 15% in volume. Strategic interest appeared in a few large deals, while large-scale portfolio companies were bought by other private equity investors.
- While top-line growth is the most important factor in returns today, investors believe cost and capital efficiency will be the most important factors in value creation.
5. In focus: Value creation in portfolio companies
- The exit track record is critical for continued private equity investments in India; currently there is $50 billion of investment overhang in the industry.
- Most investors look for cost-reduction opportunities during due diligence; however, only 50% can fulfil them before exiting.
- While investors indicate that they have a clear value-creation model in place, 60% are still in the process of staffing their portfolio teams. Today, 40% of portfolio teams have one member or less vs. an ideal of three to five members desired by most funds.
- Funds believe that the ability to operate according to the proprietary view, having a clear value-creation plan and conducting robust due diligence are the most important criteria for successful investments.
- We believe a successful value-creation playbook has 10 critical steps across 3 life stages of the deal journey: predeal, during the holding period and preexit.
- Large, successful exits in 2016 (such as KKR’s exit from ATG and Advent’s exit from Care Hospitals) demonstrate a few of these best practices to unlock portfolio value.
About the authors
Arpan Sheth is a partner with Bain & Company in Mumbai and leads the Private Equity practice in India. Madhur Singhal is a partner with Bain’s Mumbai office and is a leader in the Private Equity practice in India. Srivatsan Rajan is a partner with Bain’s New Delhi office and is a leader in the Private Equity practice in India. Aditya Shukla is a manager with Bain’s Mumbai office and is a member of the Private Equity practice in India.
Acknowledgements
The authors would like to thank Samir Jain and Poorna Chandra for their contributions to the report.
1 Based on deals greater than $10 million


