Report

Executive summary
This is the eighth consecutive year that Bain & Company and Kantar Worldpanel have tracked the shopping behaviors of Chinese consumers. Our continuing research has given us a valuable long-term view across 106 fast-moving consumer goods (FMCG) categories purchased for home consumption in China. As in each of the past seven years, we conducted a deep analysis of the key 26 categories1 that span the four largest consumer goods sectors: packaged food, beverages, personal care and home care. We also looked at another 19 categories2 to form a more comprehensive view of the market. Combined, these sectors represent 80% of all FMCG.
In addition, we looked at FMCG and channel trends for 22 food and beverage categories3 purchased for out-of-home consumption in Tier-1 and Tier-2 cities.
Category performance: The premiumization factor
Our fundamental finding is that, despite much talk about the economy slowing down, FMCG consumption has remained robust. In 2018, total FMCG spending continued its rebound, growing at a rate of 5.2%, slightly faster than the previous year’s 4.7%. The two-speed growth phenomenon we identified in 2016 has staying power: The food and beverage sector and personal care and home care sectors continue to expand at different speeds, with personal care and home care leading the charge. Spending on packaged foods grew by 4.7% in 2018 thanks to solid volume growth, while beverage spending growth stalled at 1.5%, the result of a volume decline coupled with higher average selling prices (ASP). By comparison, the value of personal care categories grew by 10.3% in 2018, mostly due to premiumization, while home care grew by 7.2%, primarily the result of volume growth.
As the total FMCG market recovers, it is clear that premiumization plays a big role and holds prospects for continued importance, as Chinese consumers favor goods that promise to improve their health and lifestyle. While penetration4 and purchase frequency may be reaching their limits in some categories, there appears to be ample room for average selling prices to rise. The past two years of data on shopper behavior have shown that brands can still encourage trading up. This is especially true in such personal care categories as skin care, which grew at a brisk 13.7% in value as ASP rose 7.7%. Premiumization also helped some categories that suffered drops in volume. Consider hair conditioner. The category value grew by 7.3% in 2018, despite a 0.8% drop in volume. What accounted for the rise in value? The average selling price jumped by 8.1%.
Indeed, premiumization can help categories in which volume is growing, flat or slumping. Carbonated soft drinks (CSD) is a category with stagnant volume growth, yet its premium drinks are experiencing healthy gains. By comparison, volume is rising in skin care and makeup. Diving deeper into shopper behavior, however, we see that it’s not only super-premium and premium skin care and makeup products that are gaining popularity; mass products now sell briskly, too. This suggests an opportunity for companies to develop a portfolio of brands appealing to a range of skin care and makeup consumer segments. Of course, each category is different. In infant formula, for example, the evidence shows that consumers distinctly favor premium and super-premium brands, eschewing mass brands.
Channel changes: Growth limits for e-commerce?
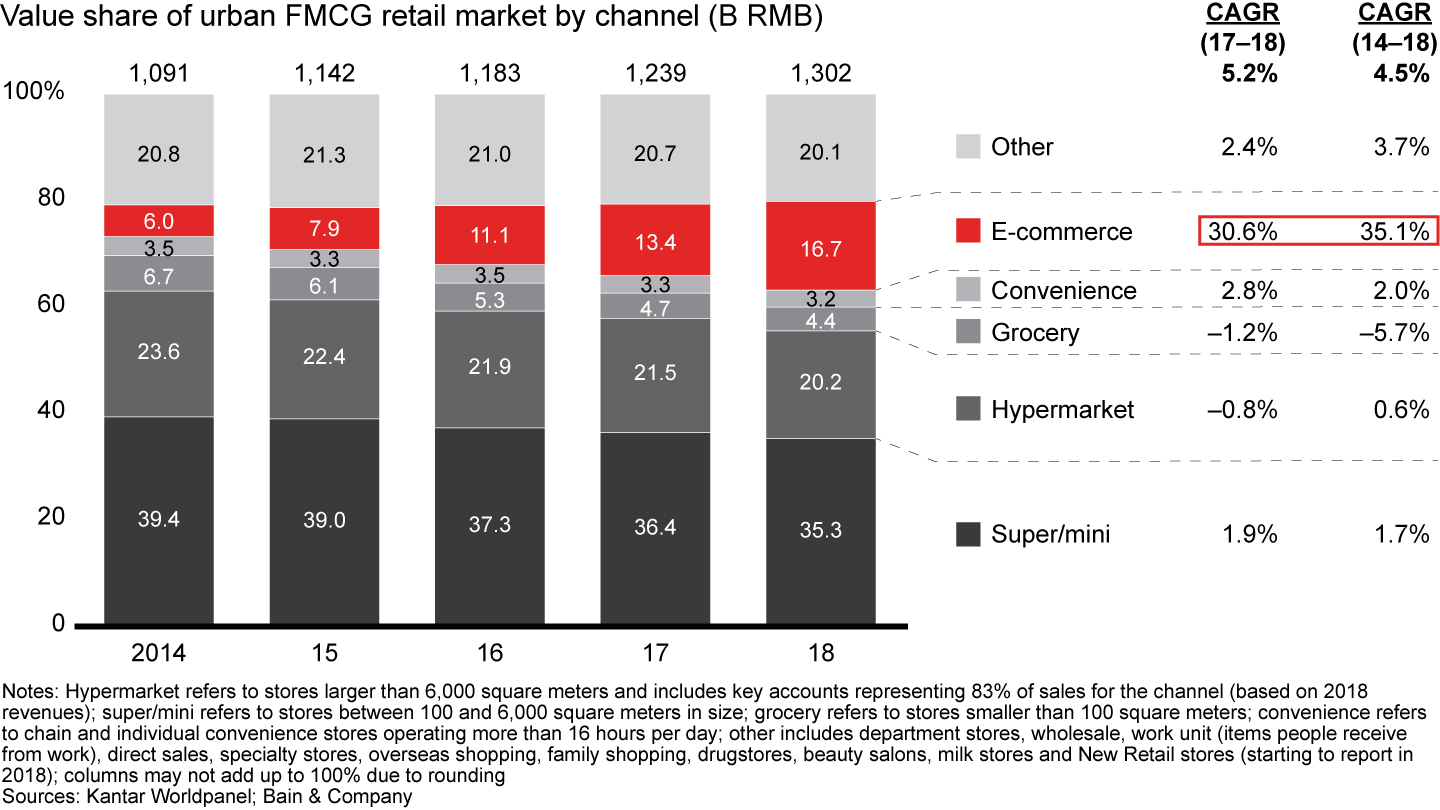
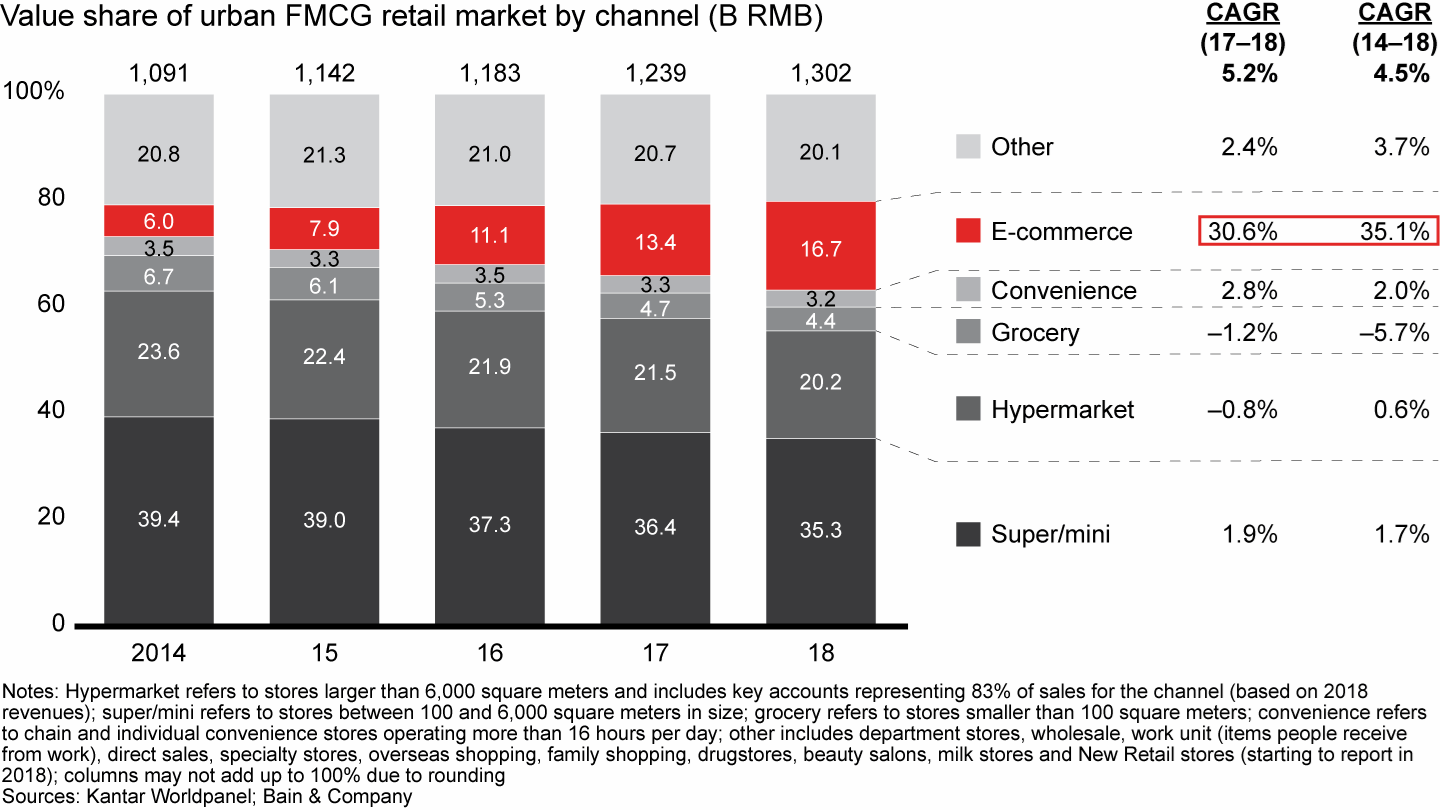
In 2018, Kantar Worldpanel adjusted its online channel database to reflect new market realities and the rapid pace of e-commerce growth. In this refreshed channel view, e-commerce represents 16.7% of the urban FMCG market for at-home consumption, vs. 10% under the previous methodology. E-commerce channel growth slowed slightly to 30.6% between 2017 and 2018 (compared with 35.1% annual growth between 2014 and 2018). Similar to previous years, increasing penetration and purchase frequency remain the key growth drivers, with volume per order and ASP remaining stable.
Yet for the first time, we are seeing the growth limits of online penetration.5 For example, in Tier-1 cities, online penetration has plateaued at around 80% and purchase frequency at 20 times per year. Lower-tier cities have more growth headroom and can expect at least three or four years of continued penetration growth, in our view.
Since 2012, we have identified three clusters of categories based on their relative online penetration6 and online penetration growth trajectory. This year we have highlighted four clusters to reflect a more pronounced separation across categories.
- The first is categories with high relative online penetration and high online penetration growth. These 4 baby and beauty categories comprise about 70% of overall online spending on the 26 FMCG categories we studied. Shoppers in these categories care about high-quality brands (imported goods are often perceived as higher quality) and discovering new brands, making online a fitting fulfillment and discovery channel.
- The second cluster of categories centers on personal care, including personal wash, hair care and oral care. These categories have midlevel relative online penetration, with high rates of online penetration growth since 2016. In large part, the significant increase in penetration is the result of promotions by e-tailer platforms, as well as heavy online investments by small and leading brands alike.
- The third cluster includes mostly food and home care categories, spanning instant noodles, candy, chocolate and kitchen cleanser. These categories have achieved midlevel relative online penetration but experience low online penetration growth.
- The last cluster is the same as in previous reports: categories with low relative online penetration and limited online penetration growth. Within this cluster, we find impulse categories like chewing gum and most of the beverage categories, which come with a high fulfillment cost for online purchases.
As we have seen in previous years, online channels typically have higher average selling prices compared with the category average. In fact, brands in some categories rely on online channels to boost premiumization. Yet these ASP gains are sometimes offset by promotions. While the rate of online promotions has stabilized at around 40% (compared with a steady 22% for offline channels), it still is relatively high.
There is encouraging news for offline channels. While 2018 doesn’t necessarily represent a turning point, we did begin to detect renewed hope for offline retailers. Previously, offline stores in most formats had been steadily losing share with the rapid rise of online channels. Now there are new and interesting opportunities for offline retailers to regain their momentum, in many cases with smaller and more flexible formats.
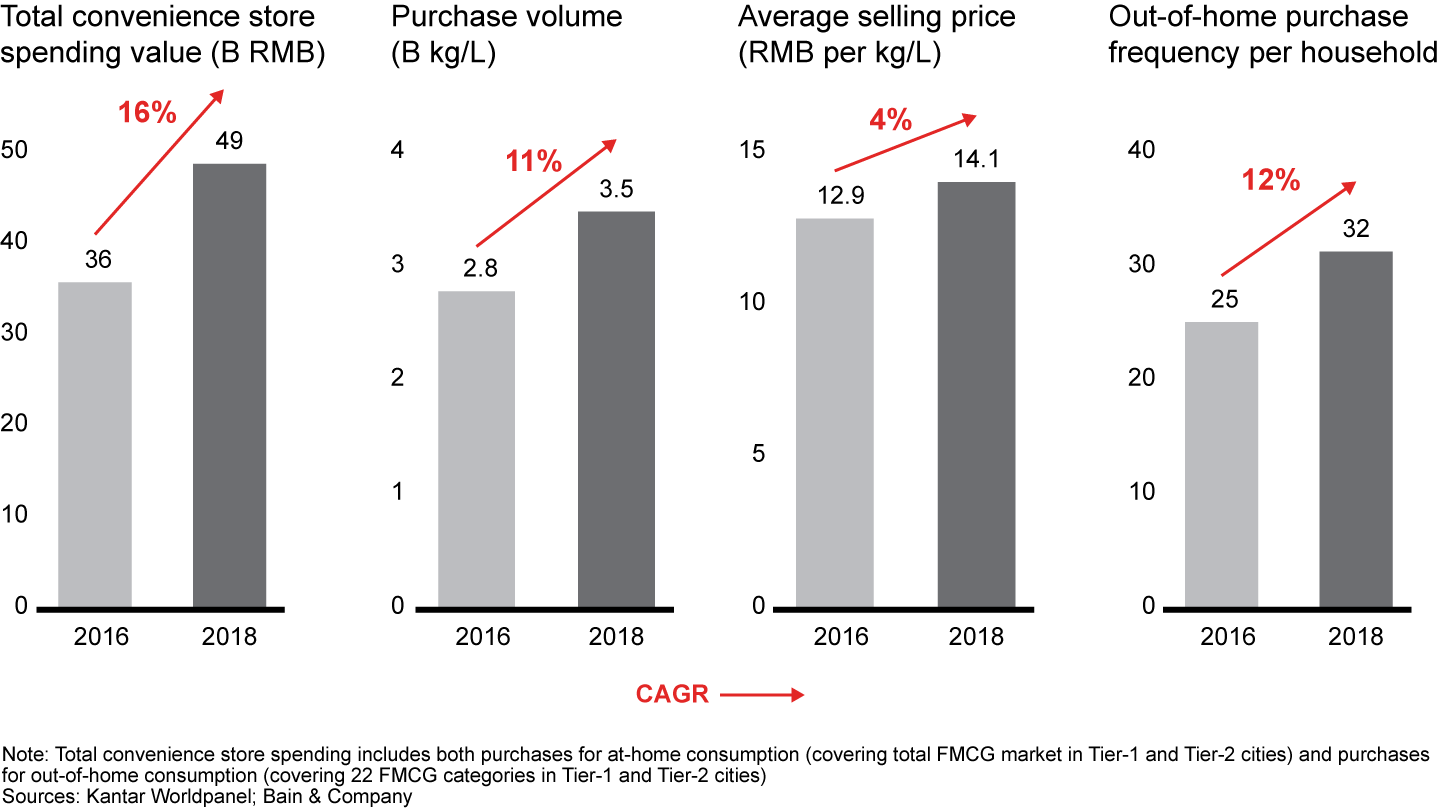
Hypermarkets continue to lose market share at a regular pace, dropping from 23.6% in 2014 to 20.2% in 2018. However, smaller formats are watching their losses decelerate, and in some cases are even gaining ground. For example, super- and minimarket channels lost share but enjoyed growth of 1.9% in 2018. Also, within traditional trade (grocery), food and beverage sales intended for out-of-home consumption have risen by 14% annually since 2016, accounting for nearly 80% of grocery spending in 2018, based on 10 of the categories we tracked.7 Out-of-home consumption made similar contributions to convenience store sales, which have experienced 16% annual growth in Tier-1 and Tier-2 cities since 2016.
Even large store formats show potential for growth, but it will require them to take on new roles. In recent years, hypermarkets have started to reignite some of their momentum by serving as a logistics base for 30-minute delivery of goods ordered online via the leading delivery platforms. Another opportunity: Big chains can reinvent themselves by upping their game in fresh food.
In addition to examining these ongoing trends, we looked at two other developments: the dramatic impact of fast-growing small brands on larger brands, and the emergence of the uniquely Chinese phenomenon of New Retail—futuristic supermarkets devoted in equal measure to in-store dining, online ordering and delivery.
Big competition from small brands
In China Shopper Report 2018, Vol. 2, Local Insurgents Shake Up China’s “Two-Speed” Market, we showed how China’s insurgent brands are taking a disproportionate share of FMCG growth. As that trend continues, we now address a fundamental question facing many companies: Can big brands get bigger and continue to be successful?
The proliferation of insurgent brands like Pechoin skin care, ChaoNeng fabric detergent and Classy Kiss yogurt, combined with the fragmentation of markets and segments caused by online channels, has forced established brand owners to decide whether to continue growing an existing big brand or to create a portfolio of brands that serve different consumer segments. The new reality is that many incumbent brands watch small brands doing an impressive job of serving raw consumer needs, responding in everything from R&D to digital marketing with agility and flexibility. Whether to focus on growing big brands or building a portfolio of different brands to serve different segments is something that nags at every FMCG executive. It’s a decision that sometimes calls for a major strategic transformation; billion-dollar brands are vastly different animals than $25 million brands and require significantly different management approaches.
New Retail stores take hold
The other big emerging trend we consider involves New Retail. As in past years, we looked deeply into online channels and the out-of-home market for food and beverages. In any of its forms, New Retail blurs the line between online and offline sales, with potentially major implications for how FMCG products are sold. In this report, we focus exclusively on FMCG categories in New Retail stores, such as Alibaba’s Hema supermarkets. Now largely limited to Tier-1 and Tier-2 cities, and with penetration levels comparable to regional supermarkets, New Retail stores will become more broadly relevant in the future—and we will continue to track their development.
How brands can win
The three key implications for brands that we mentioned last year still hold true:
- Take advantage of channel dynamics, grow with the winning channels and anticipate retailers’ consolidation;
- Develop high-value and personalized products to make the most of the premiumization trend; and
- Become a data-driven, consumer-centric organization by collaborating with platforms but also by developing your own set of consumer data.
This year we add a fourth important implication, based on the success of insurgent brands: Develop a portfolio of brands to grow overall share in a category, taking advantage of the fragmentation of consumer needs and shoppers’ thirst for innovations.
How retailers can win
The acceleration of New Retail presents opportunities for retailers to transition from today’s mass-oriented, offline approach to tomorrow’s seamless, multichannel world of shopping. Physical stores have a future, but offline retailers need to refine their moves to play in this new environment. Specifically, they’ll need to:
- Redesign store portfolios in the New Retail format;
- Make the store experience more attractive by leveraging new technologies like augmented reality; and
- Digitalize operations to deliver a seamless experience to consumers, whether they buy online or offline, and start to monetize consumer data for better cooperation with brands.
Full report: China Shopper Report 2019, Vol. 1
No slowdown for FMCG
China's market for fast-moving consumer goods (FMCG) for at-home consumption remained robust in 2018, despite general concerns about a slowdown. Total spending on FMCG rose 5.2%, a slight increase over last year’s 4.7% gain. Overall, the two-speed growth scenario we identified in 2016 has continued to evolve, with home care and personal care categories growing at a fast clip while food and beverages maintain a slower pace (see Figure 1).
Fast-moving consumer goods (FMCG) growth remained steady in 2018, with personal and home care categories growing faster than food and beverage categories
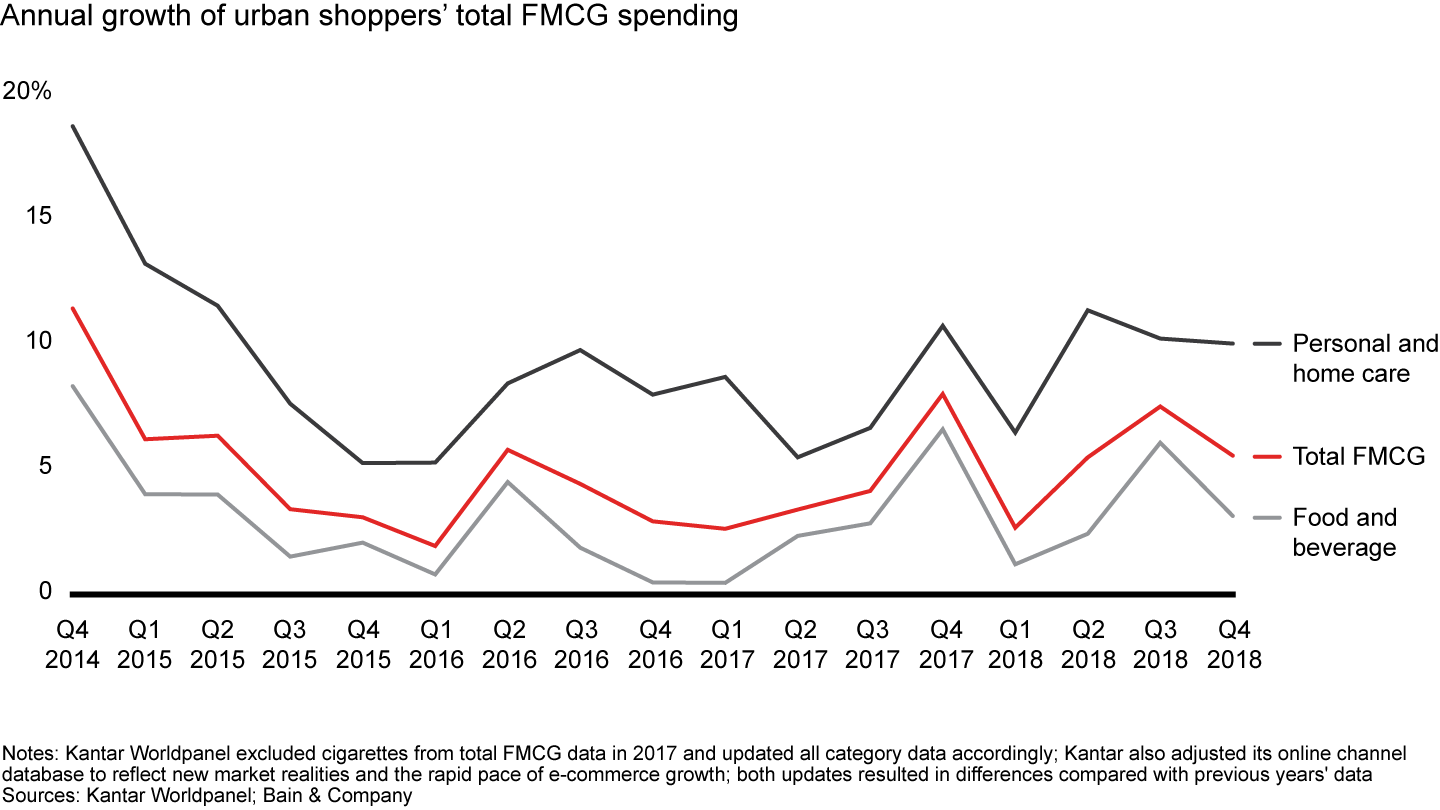
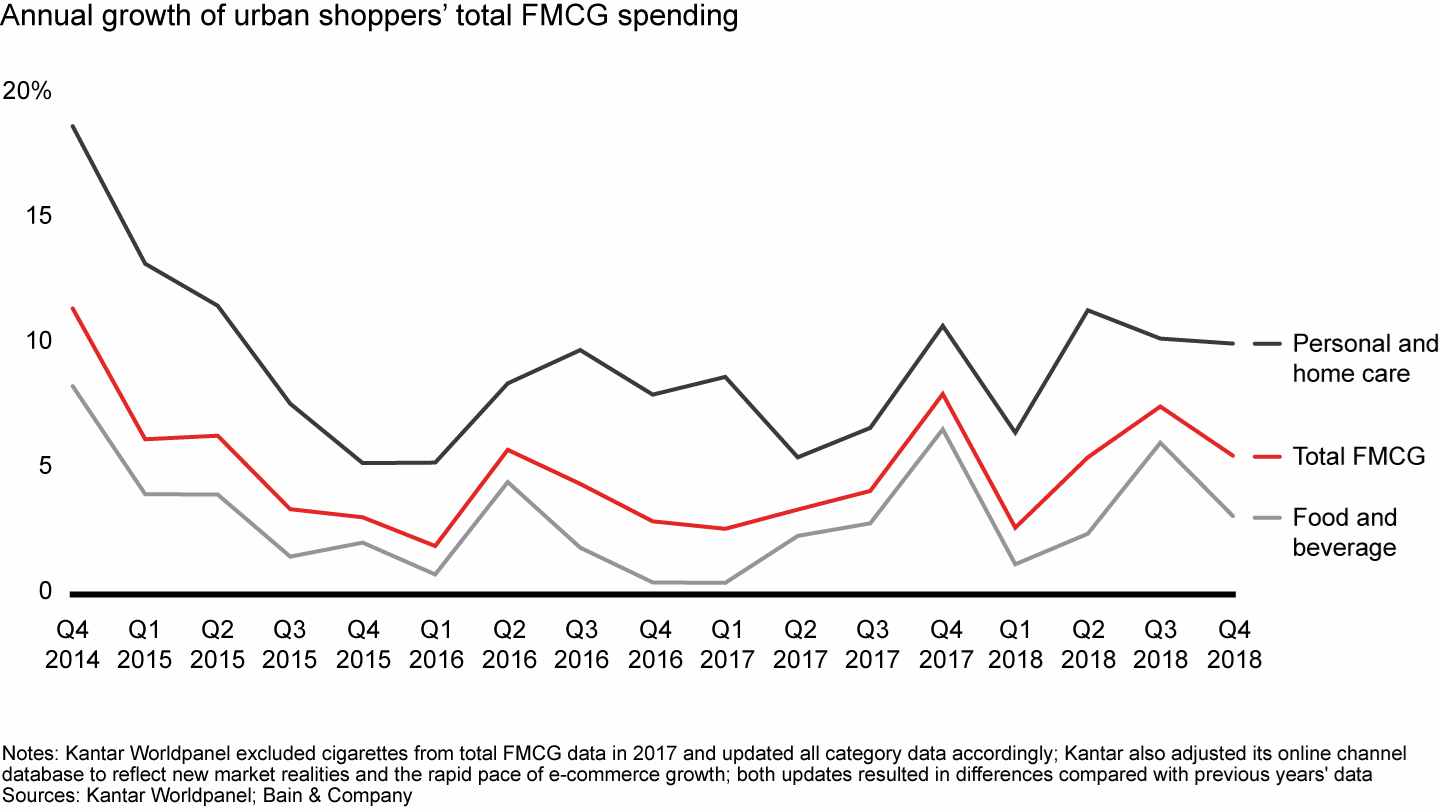
Personal care categories showed the healthiest gains, growing by 10.3% compared with 10.1% in 2017. Premiumization was a big factor in that stellar performance: Average selling prices (ASP) rose by 9.8% as consumers demonstrated a willingness to trade up. For example, volume growth in the hair conditioner category declined by 0.8%, but the average selling price rose by 8.1%. In shampoo, volume grew by only 1% but prices rose 5%; L’Oréal and Pantene saw ASP rise by 6% and 4%, respectively. Home care categories delivered strong growth of 7.2%, a rebound from their 3%–4% annual growth rate between 2014 and 2017. In home care, it was volume growth, not price increases, that led to the gains.
In the food sector, categories with perceived health benefits, such as nutrient supplements, led the growth, while impulse categories such as chewing gum declined. Overall, food categories registered 4.7% growth, slightly outpacing their 3.4% growth in 2017.
Beverage categories’ value grew by only 1.5%, a drop from the 2.8% growth rate in 2017. That value growth came exclusively from an ASP increase of 1.8%. Within beverages, packaged water reflected a different dynamic. Packaged water’s market size increased due to volume gains—mostly in bulk purchases and large package sizes—not rising prices. Nongfu Spring, the leading packaged water brand, saw volume increase by 20% but ASP growth drop by 2%. For its part, C’estbon, the No. 2 water brand, watched volume increase by 17% while prices decreased by 3%.Yogurt, which had enjoyed successive years of steady gains, saw growth drop to 1.6%, mostly due to stalling volume growth. Top brand Bright experienced a 17% volume decline in 2018.
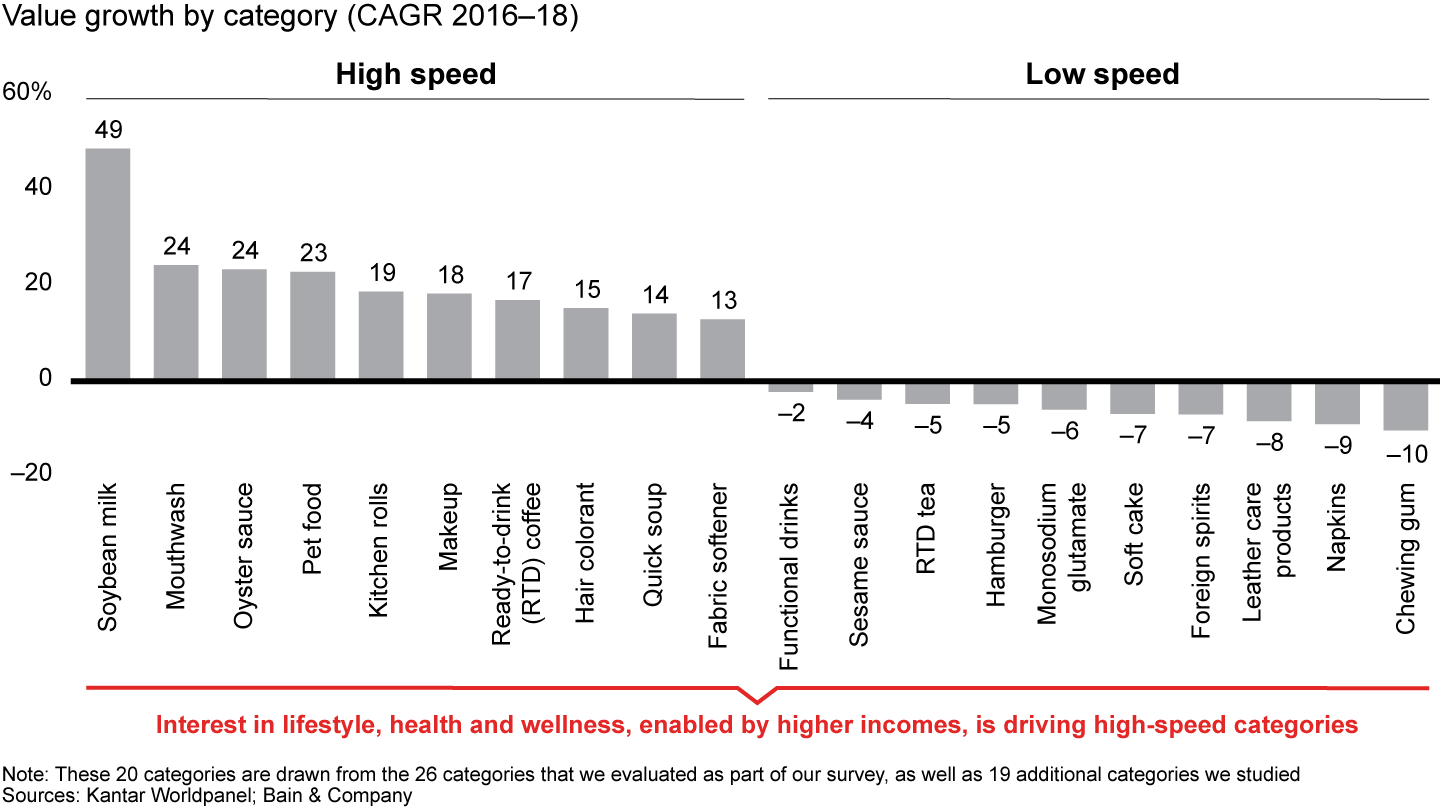
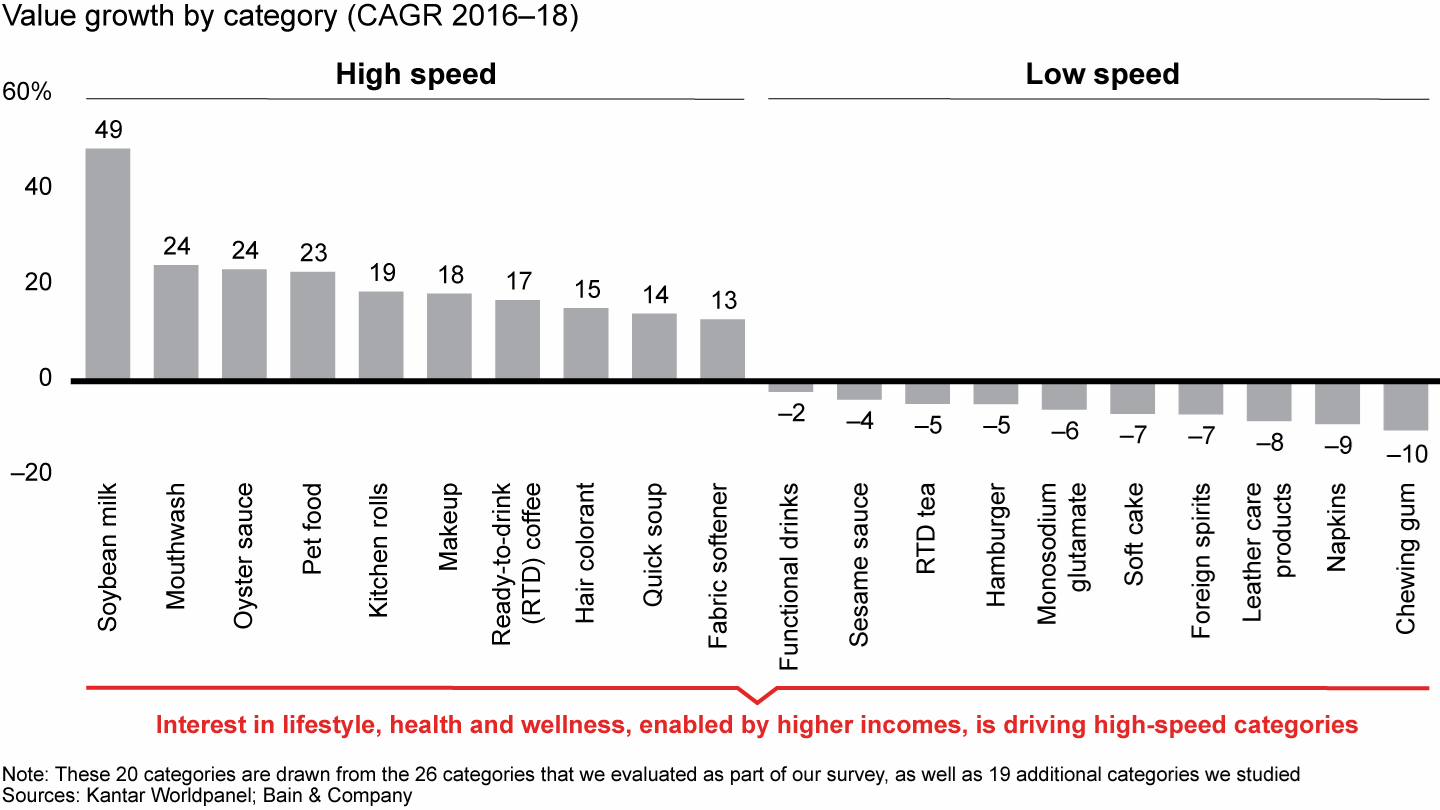
Some beverage companies have found a way to make solid gains, serving as a lesson for FMCG companies across many categories. Carbonated soft drinks (CSD) has grown by 6.6% per year since 2016, due to a combination of big brands’ innovations in packaging and product formula and small brands’ thoughtful moves to benefit from the popularity of “made for China” products. Coca-Cola contributed more than 50% of the category’s growth with the success of such advances as Sprite Fiber Plus, while local brands like Beibingyang introduced distinct Chinese flavors such as sour plum. These domestic companies are winning by making local flavors hip, tapping into a burgeoning “buy China” sentiment. By contrast, consumers are showing less enthusiasm for ready-to-drink (RTD) tea, which saw a 5.1% drop in value since 2017. Part of the reason for the decline: RTD tea consumption has been cannibalized by the popularity of tea shop chains like HeyTea and coffee shop retailers like Luckin Coffee. Coffee is swiftly gaining widespread appeal in China; RTD coffee enjoyed average annual value growth of 17% from 2016 to 2018.
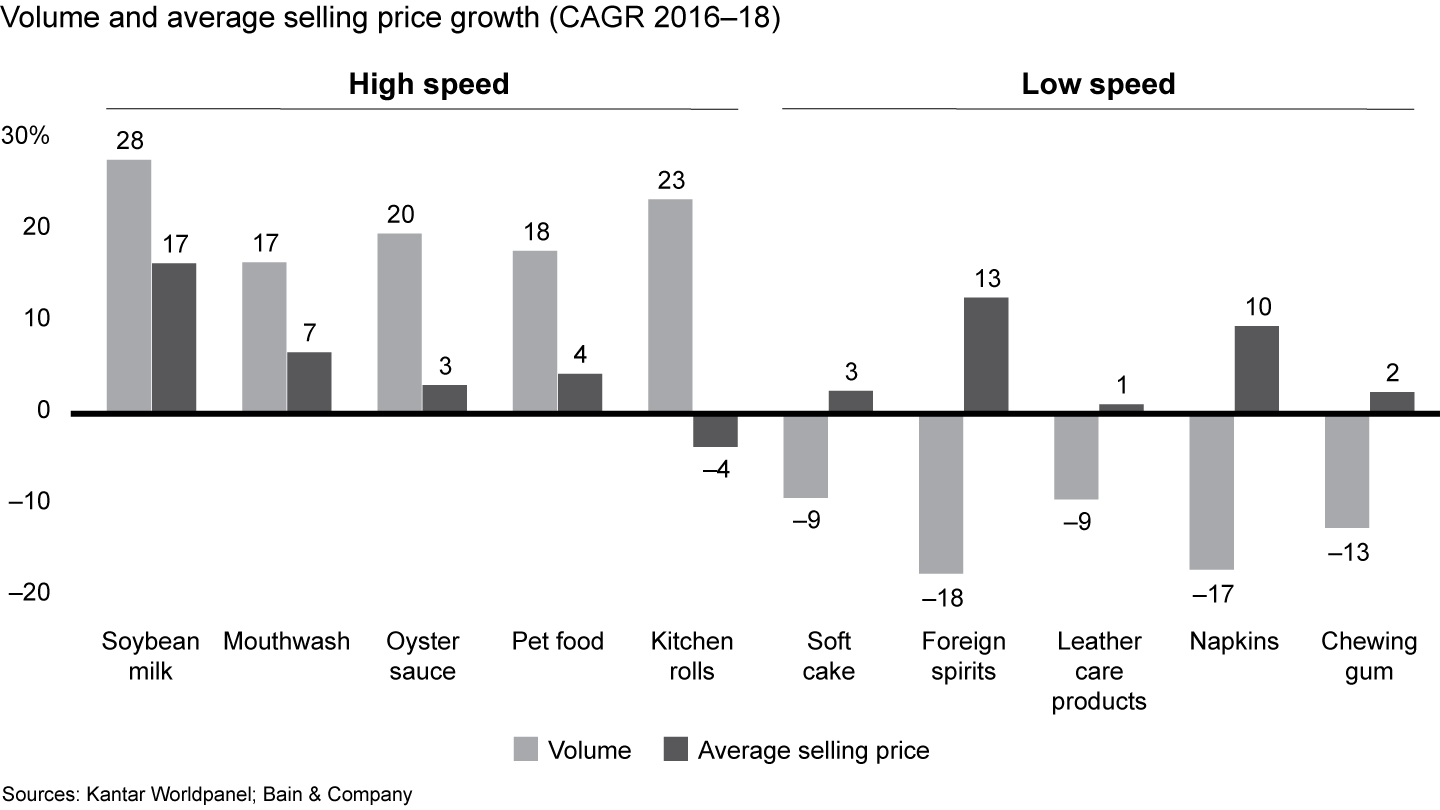
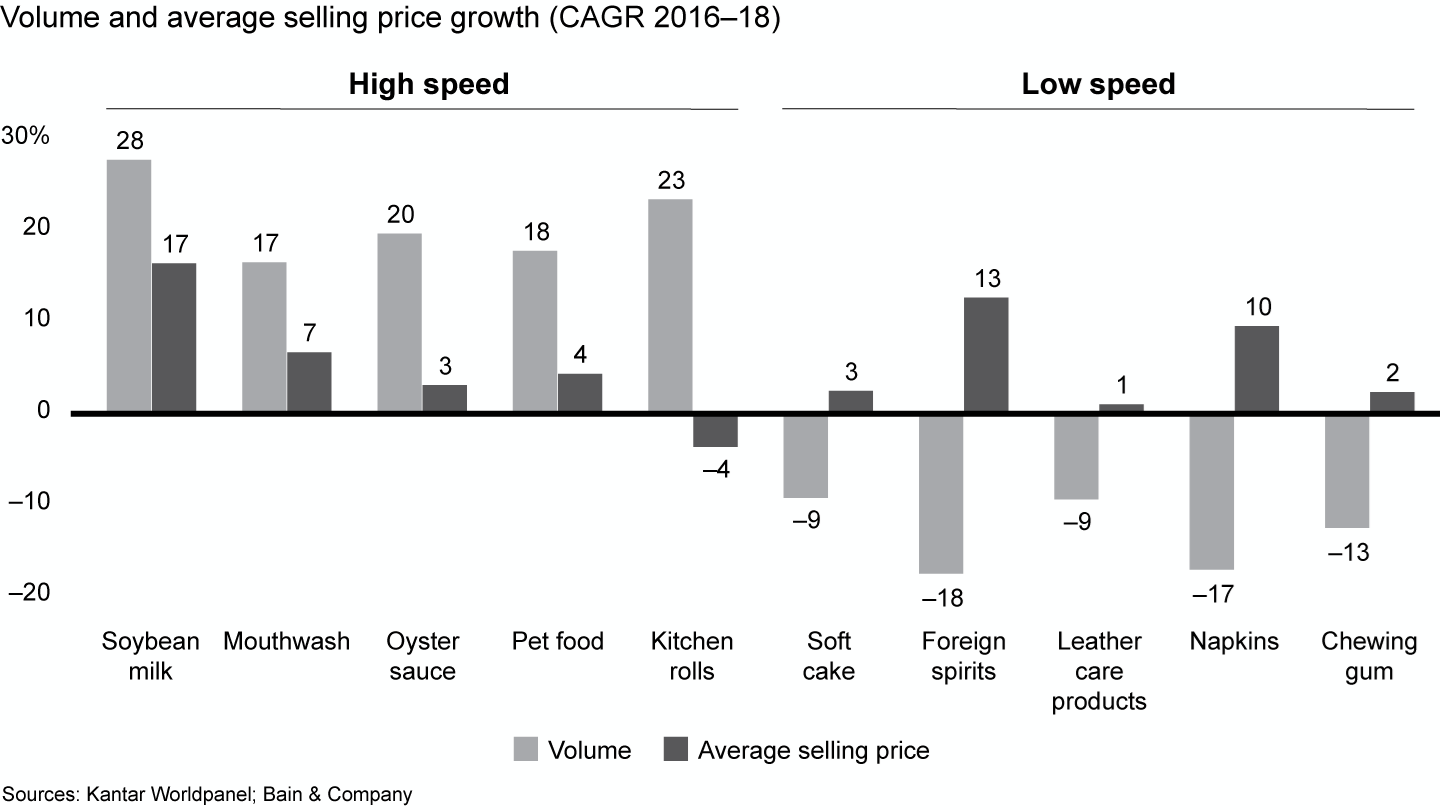
In fact, RTD coffee landed among the top 10 high-speed categories, along with soybean milk, mouthwash, oyster sauce, pet food, kitchen rolls, makeup, hair colorant, quick soup and fabric softener. All of these categories have been propelled by consumers’ interest in improving their lifestyle, health and wellness, a passion enabled by higher incomes (see Figure 2). The top 10 low-speed categories include chewing gum, monosodium glutamate, soft cake, hamburger and other categories that are not marketed with the promise of healthier living. Volume growth, more than average selling prices, contributed to high-speed categories’ strong momentum (see Figure 3). For example, soybean milk brands watched volume rise at an average 28% annual rate from 2016 to 2018 while prices rose by 17%. Similarly, declining volume was the bigger factor for categories landing among the low-speed top 10. The soft cake category saw volume drop by 9%, offsetting a 3% rise in prices.
China’s two-speed growth phenomenon continued, with distinctly different performance for the top 10 high- and low-speed categories
Volume growth contributed to high-speed categories’ strong momentum
Paths to premiumization
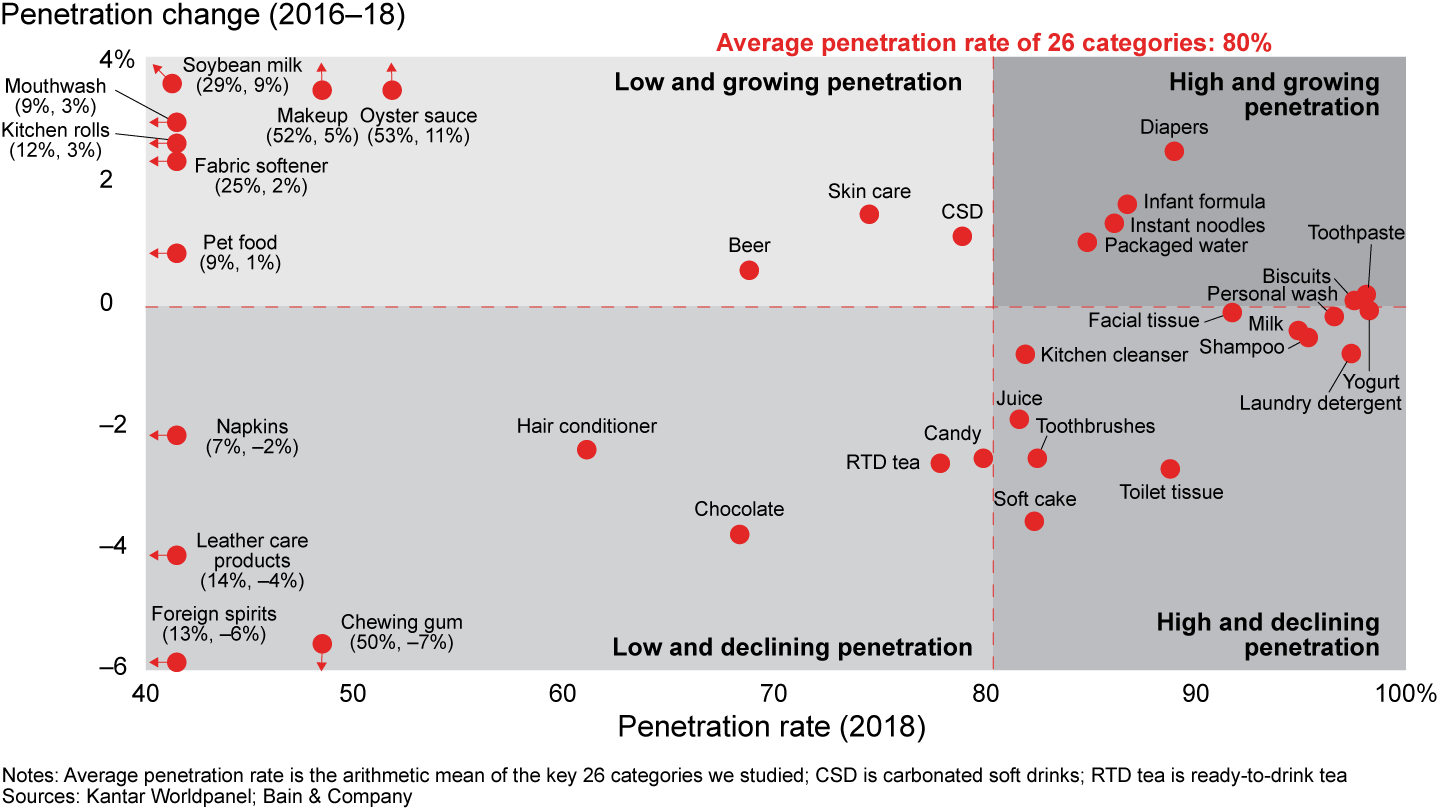
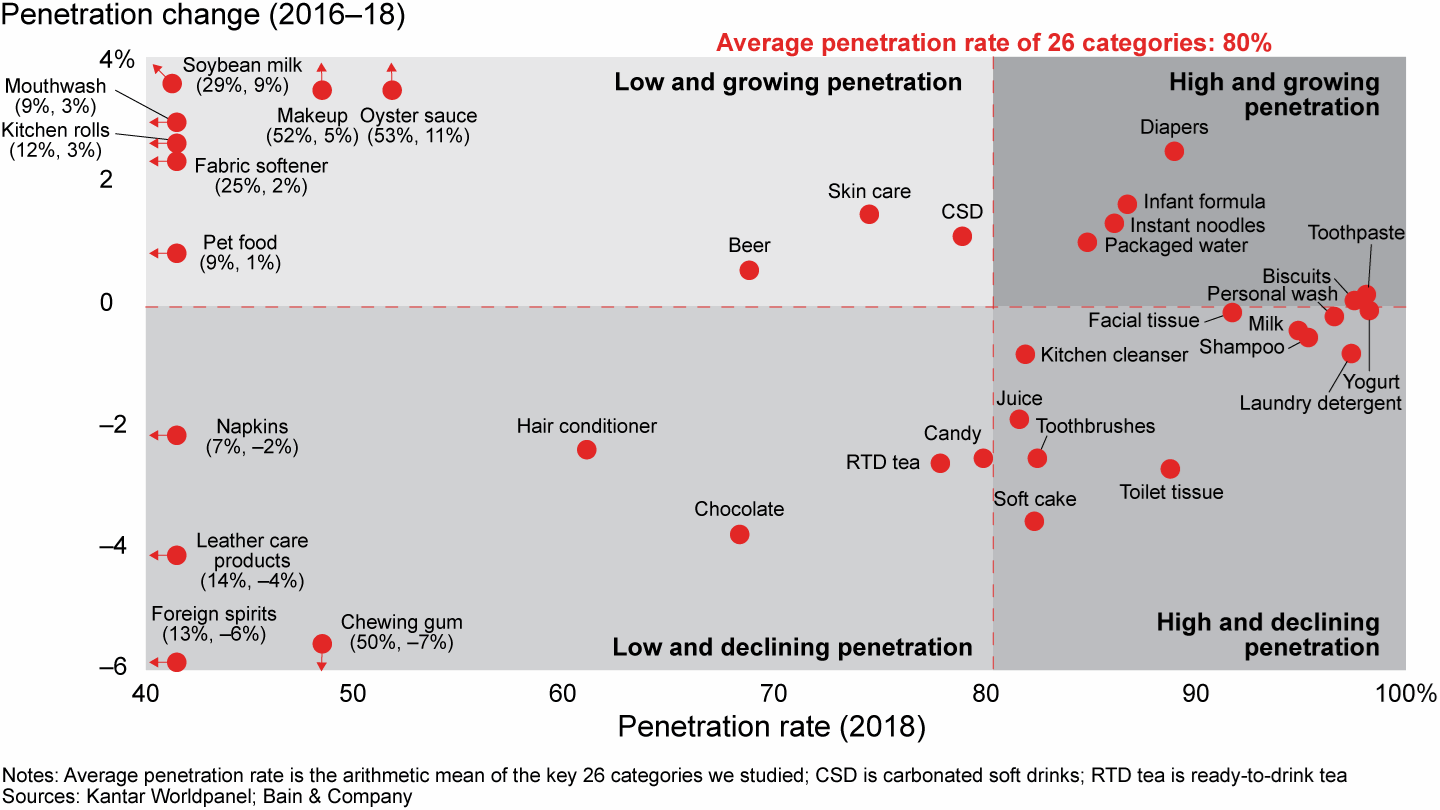
Our research found that most FMCG categories have reached a penetration plateau and are now experiencing declining penetration (see Figure 4). In fact, the average penetration rate of all 26 categories is 80%. As we’ve learned by tracking FMCG activity over the years, when penetration eases, brands typically turn to premiumization (see Figure 5). While many categories may be increasing their average selling prices, few are truly premiumizing with ASP growth that’s consistently above the rate of inflation, as determined by the consumer price index (roughly 1.8% as of this writing).
Most categories have reached a penetration plateau and are experiencing declining penetration
In the last three years, most categories have offset saturation or a penetration decline by using premiumization to boost growth
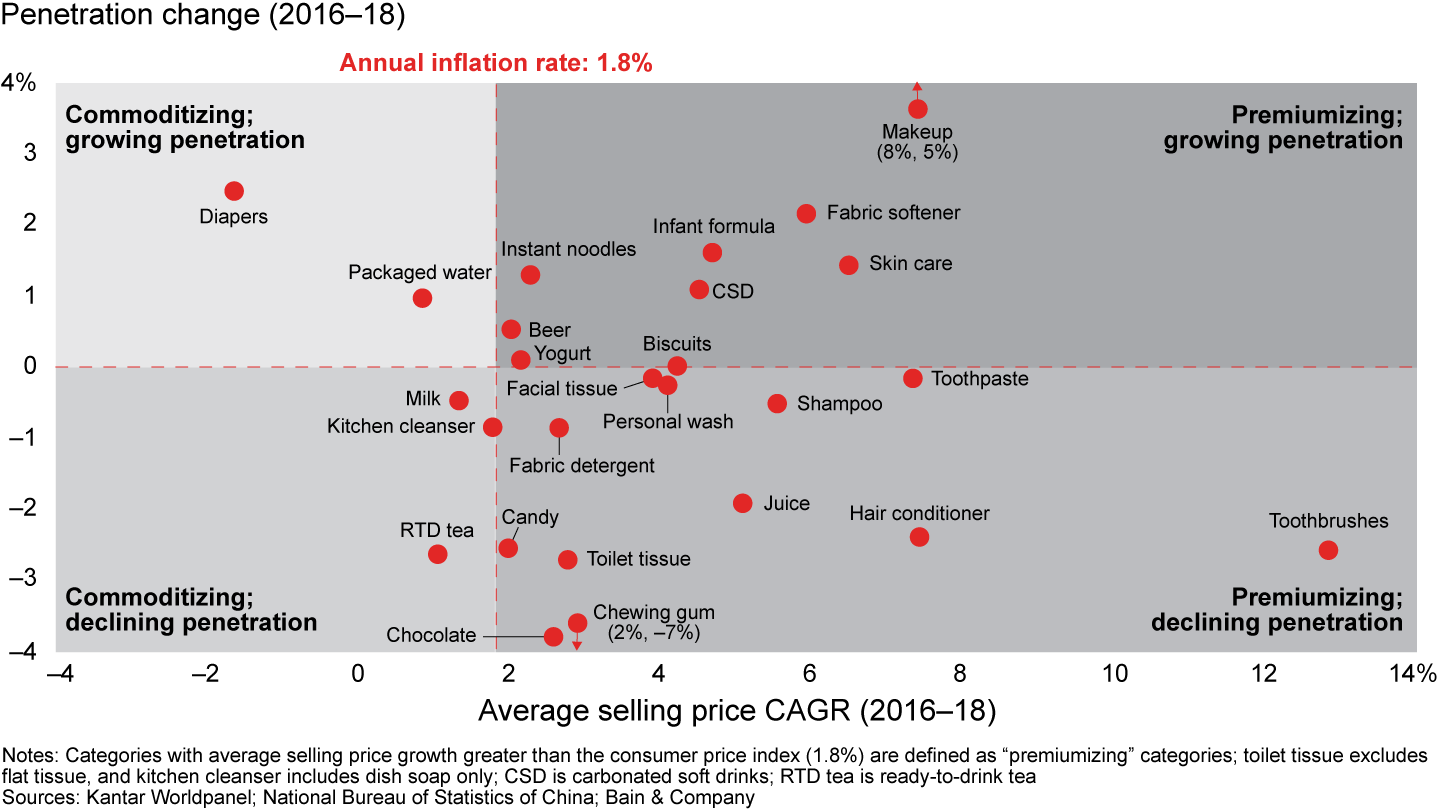
Among categories with “true” premiumization, one group comprises those that are premiumizing in response to declining penetration. This is the case with many personal care categories such as shampoo and hair conditioner, both of which have experienced drops in penetration and purchase frequency over the past two years. Chinese companies Adolph and See Young, both premium hair care players, show how it is possible to outpace competitors in a category with stagnant volume. Adolph grew at an annual rate of 176%, and See Young of 34%, between 2016 and 2018. In fact, the two companies combined contributed to fully half of all hair care growth during that period.
How did they do it? Adolph relied on a single-layer distribution model that helped improve margins as it increased availability. The company also entered lower-tier cities first before expanding into higher-tier cities and invested heavily in well-trained in-store promoters. For its part, See Young gained widespread visibility with celebrity endorsements, massive advertising campaigns and popular TV show sponsorships. It invested heavily to expand online and explore opportunities in emerging social commerce platforms.
Another group of categories isn’t struggling against stagnant volume. Companies in this group, which includes makeup, skin care, fabric softener, infant formula and carbonated soft drinks, are fortunate enough to increase both prices and penetration. However, not all of the volume gains are coming from the high end. For example, while the growth in fabric softener, infant formula and CSD is largely generated by the premium and super-premium segments, in makeup and skin care, both the high and low ends of the pricing spectrum are expanding. This signals an opportunity for brands in these beauty categories to grow both premium/super-premium and mass/low-end products alike.
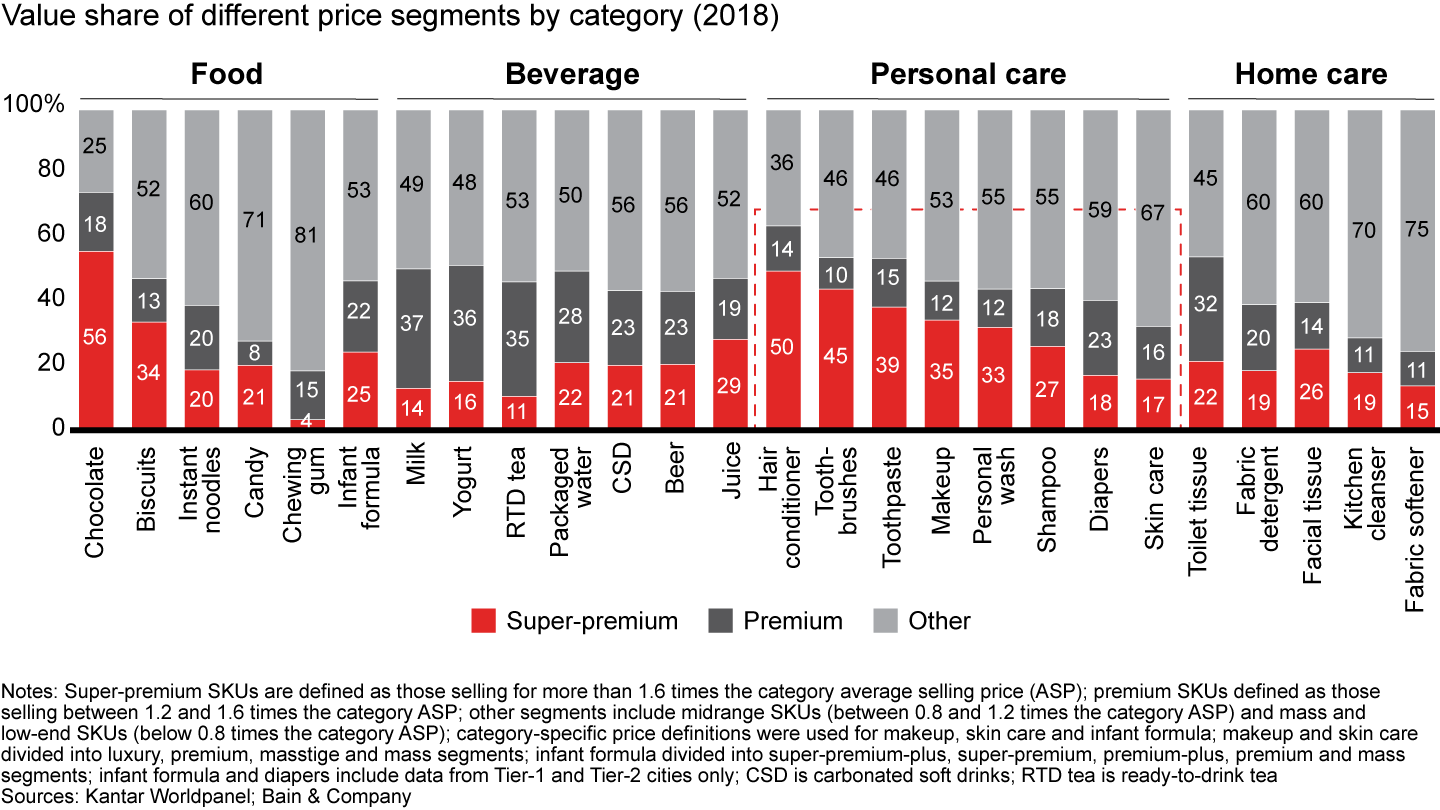
To better understand pricing dynamics, we assigned four pricing tiers to each of the 26 categories:
- Super-premium SKUs are those priced at more than 1.6 times the category average selling price.
- Premium SKUs are priced between 1.2 and 1.6 times the category ASP.
- Midrange SKUs are priced between 0.8 and 1.2 times the category ASP.
- Mass and low-end SKUs are priced at less than 0.8 times the category ASP.
This more nuanced segmentation allows us to see the premiumization dynamics within each category more clearly—and to find out how price increases and improvements in product assortment can have a bigger impact on some categories than on others. For example, among all sectors, personal care derives the most value from premium and super-premium products (see Figure 6).
Pricing segments differ among categories, with personal care deriving the most value from premium and super-premium products
Shopping by channels
This year, Kantar Worldpanel adjusted its database to reflect the changing market reality and fast evolution of online channels. In this refreshed view, e-commerce represents an even bigger share of the urban FMCG market—16.7% in 2018 compared with 10% using the previous methodology. The data showed that e-commerce channel growth actually slowed slightly for the first time. It grew at a 35.1% annual rate from 2014 to 2018, but by 30.6% between 2017 and 2018. That’s still robust by any standard and stands in stark contrast to the 0.8% decline for hypermarkets and 1.2% drop for grocery stores in 2017–18 (see Figure 7). As in previous years, online channels witnessed strong growth in penetration and purchase frequency, with stable volume per order but slightly declining average selling prices (see Figure 8).
Online sales growth remained robust in 2018, while sales growth continued to decline for hypermarkets and groceries
Online channels saw strong penetration and purchase frequency growth, with stable volume per order and average selling prices
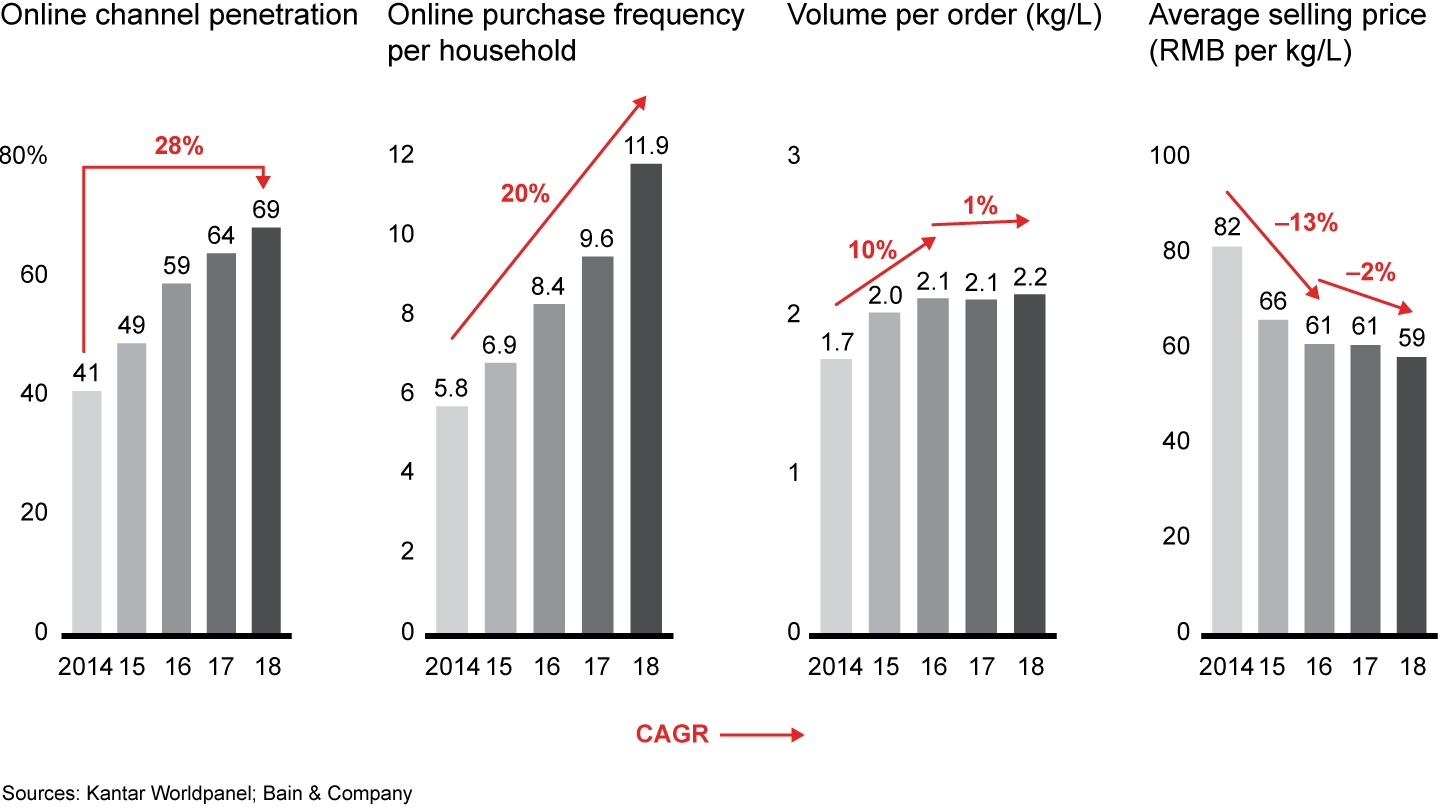
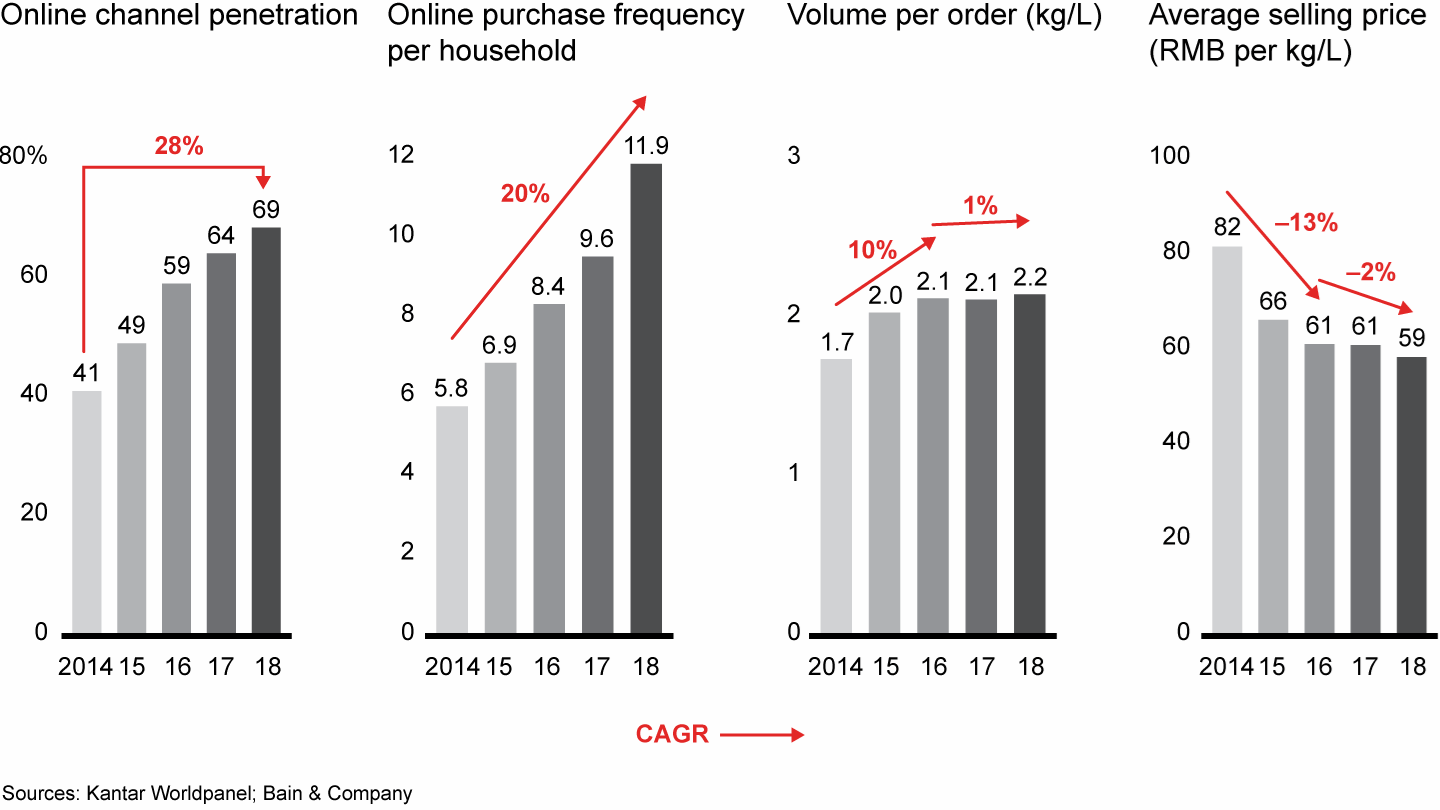
In a trend that has been building for the past few years, Tier-1 cities are reaching a plateau in penetration and purchase frequency. Indeed, Tier-1 cities have the highest online channel spending and online penetration, but that penetration has leveled off at around 80%. Average annual online purchase frequency in Tier-1 cities almost matches that of hypermarkets—20 orders for online vs. a national average of 26 trips for hypermarkets. However, the story is different in lower-tier cities, where we expect growth to continue for at least three or four more years. These cities are catching up fast and will serve as the engine of online expansion.
In previous years, we have clustered categories into three groups based on their relative online penetration and online penetration growth trajectory. This year, we have grouped the categories into four clusters to reflect some additional distinctions (see Figure 9).
Four clusters of categories reflect different online penetration rates and dynamics
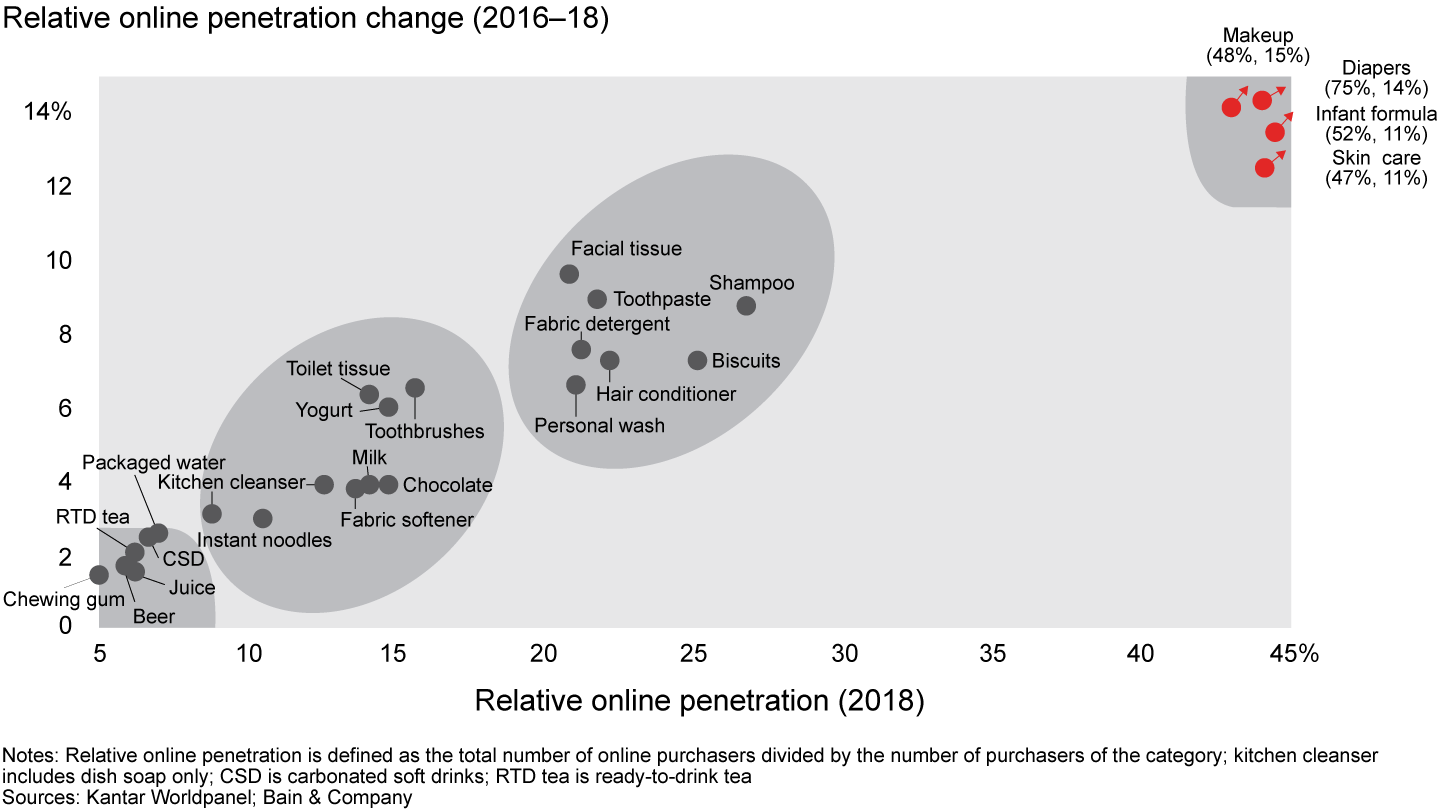
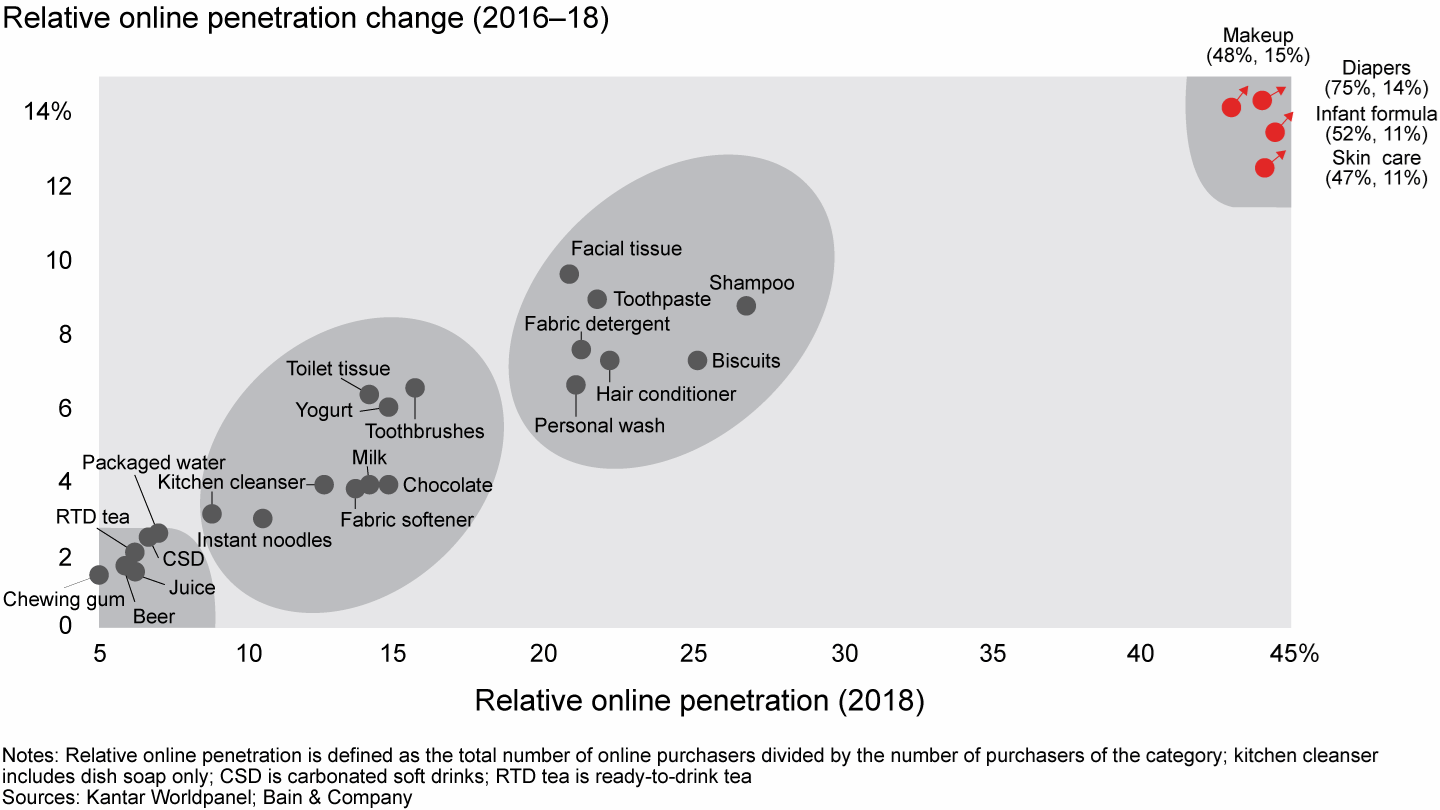
- The first cluster has high relative online penetration and high online penetration growth. These 4 baby and beauty categories comprise about 70% of online spending among all 26 FMCG categories. Shoppers in these categories care about high-quality brands, often preferring imported goods. For example, they are more willing to trust foreign brands for baby categories such as infant formula and diapers. In fact, diapers maintained its status as the category with the highest relative online penetration at 75%—a 14% increase from 2016—and the highest online sales value share at 51%. Meanwhile, China’s shoppers go online to discover new brands in beauty categories. About half of all skin care and makeup shoppers buy online, thanks in part to social media marketing platforms like Red and marketing formats like livecasts that educate consumers on new products and brands. Additionally, online channels have lowered the barrier to entry for small foreign brands such as Mistine from Thailand and Age 20’s from Korea, which target Chinese consumers in lower-tier cities.
- The second cluster consists mostly of personal care categories, such as personal wash, hair care and oral care. These categories have midlevel relative online penetration (higher than 20%) and have experienced higher online penetration growth rates since 2016. That growth has been aided by strong promotions launched by e-tailer platforms and online investments made by leading and smaller brands alike.
- The third cluster includes home care categories such as toilet tissue, fabric softener and kitchen cleanser, as well as toothbrushes and some food categories, such as instant noodles, candy and chocolate. These categories have midlevel relative online penetration (lower than 20%) and lower online penetration growth rates.
- As in previous reports, the last cluster consists of categories with low relative online penetration and limited online penetration growth. Within this cluster, we find predominantly impulse-driven categories like chewing gum. Also in this cluster: most of the beverage categories, which carry high fulfillment costs for online sales. It's interesting to note that other impulse categories, such as chocolate and biscuits, have higher online penetration, primarily driven by shoppers buying large packages and gift boxes online.
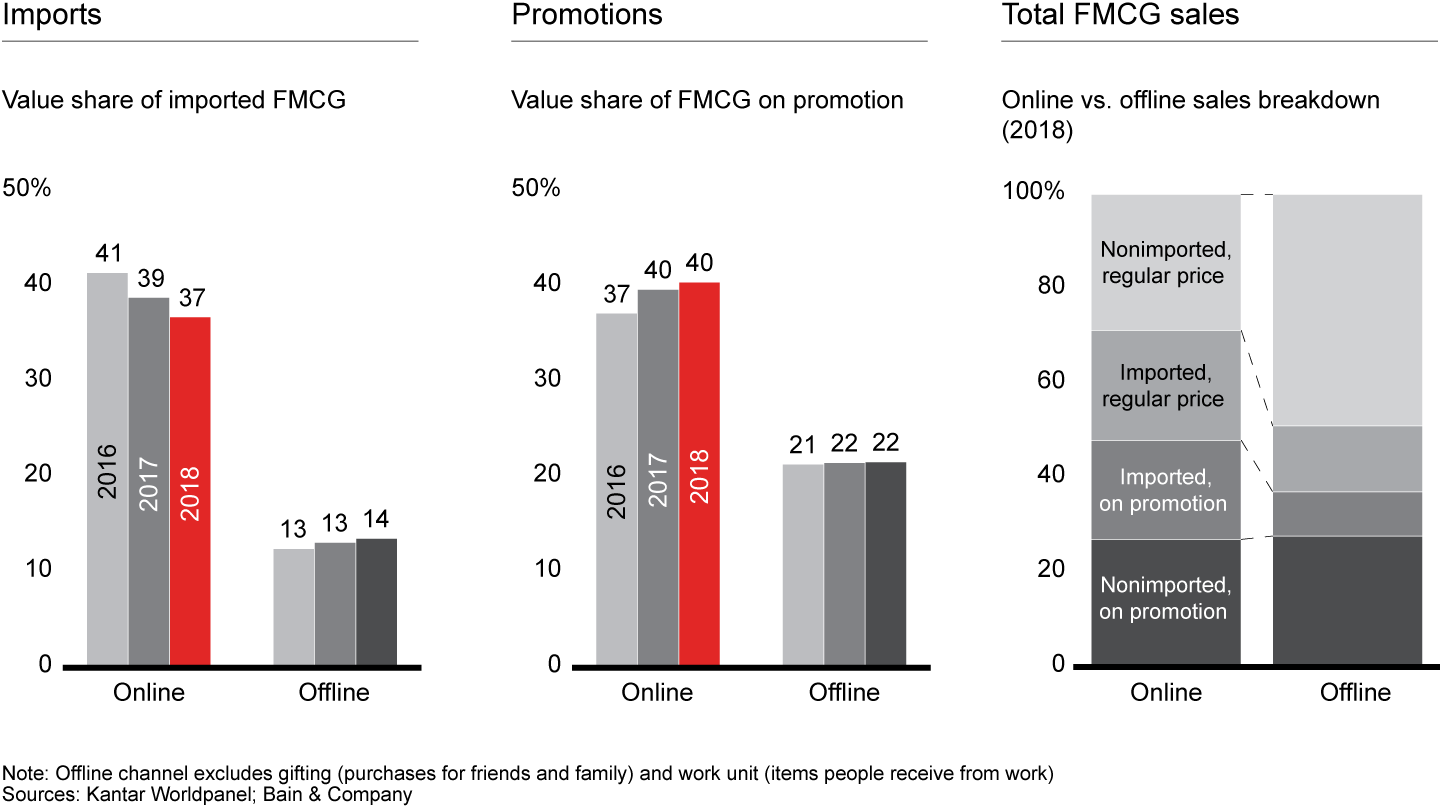
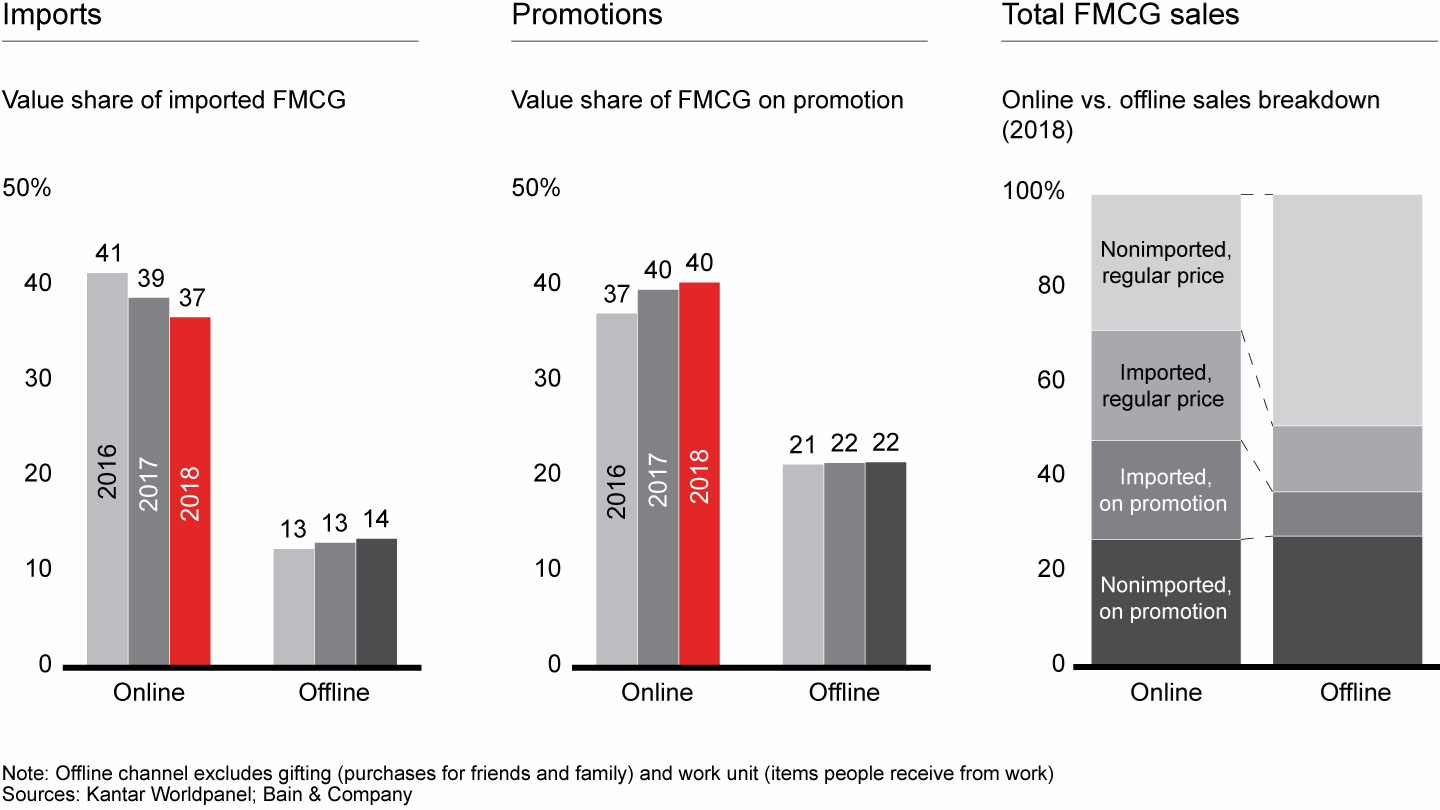
Imports still represent a high proportion of online sales value, but that share is dropping, from 41% in 2016 to 37% in 2018 (see Figure 10). By comparison, imports accounted for 14% of offline sales in 2018, only a slight increase from the previous year. Products sold online typically carry higher average selling prices than those sold offline, the result of a more premium mix of SKUs. However, companies increasingly are using promotions to encourage shoppers to buy online, sometimes offsetting ASP gains. About 40% of all online FMCG sales involve promotions, compared with 22% of offline sales.
Imports and promotions stabilized online but still represent the majority of sales; they remain much more important in online channels than offline
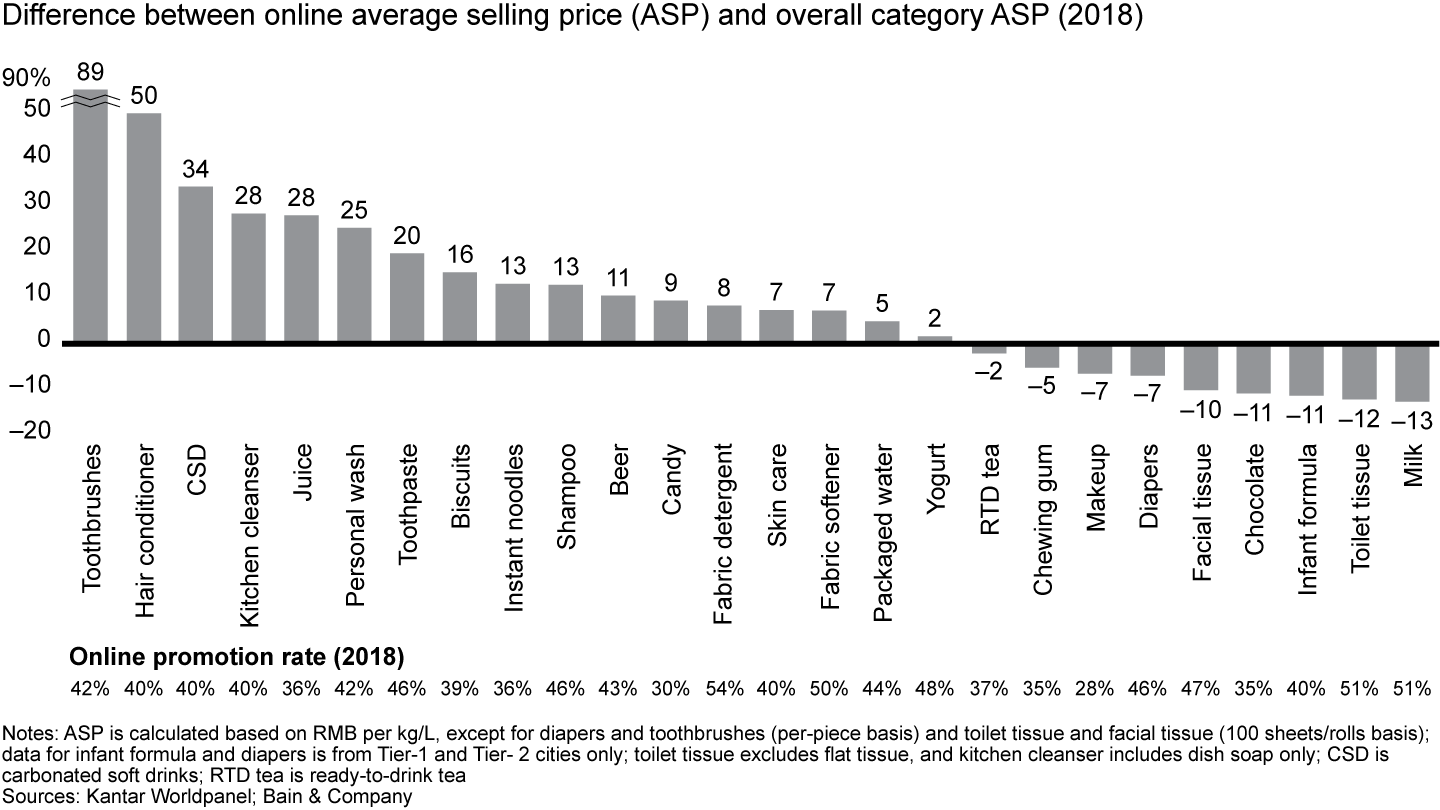
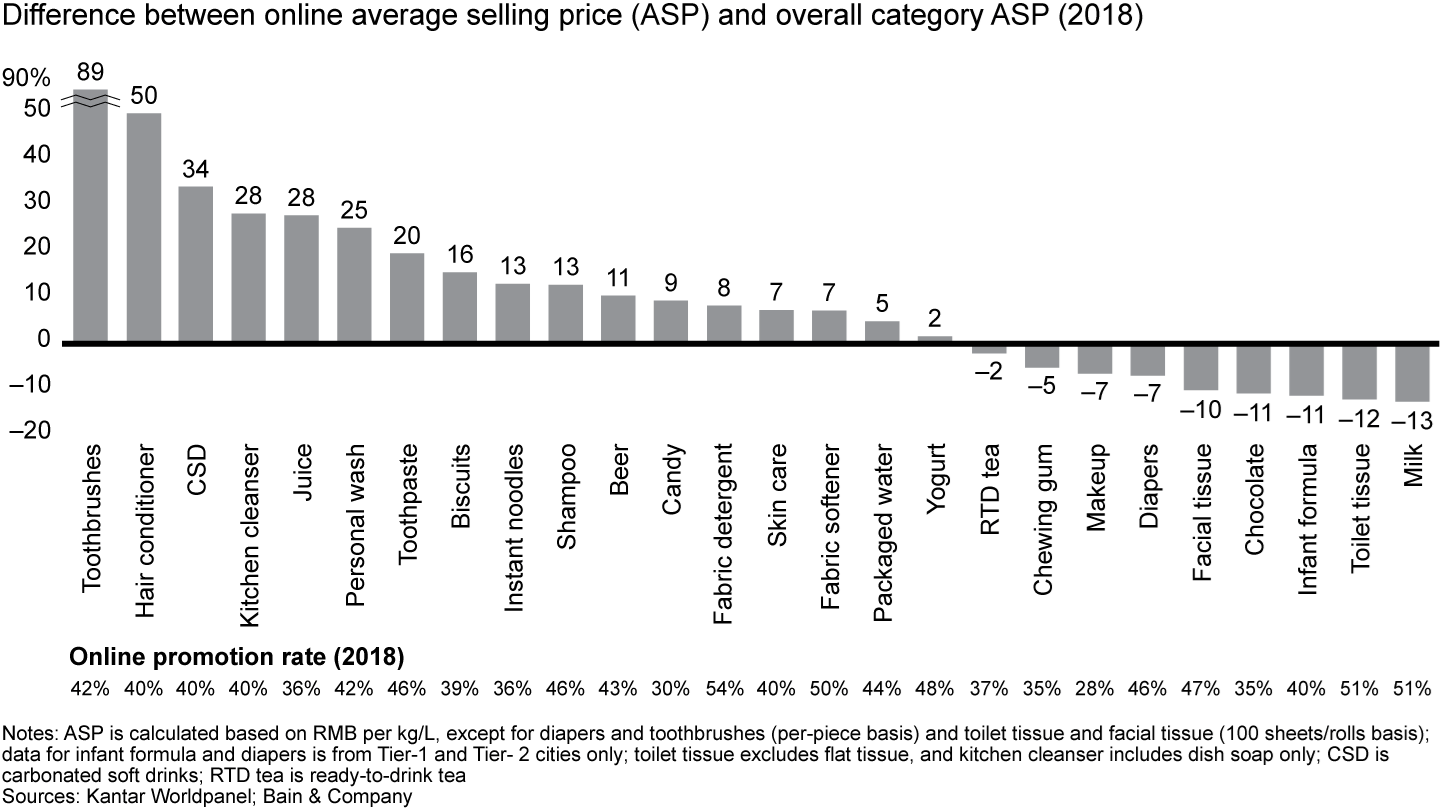
Different categories find different value in online channels (see Figure 11). Some use online channels as a way to boost sales of premium products. The most extreme example is toothbrushes, in which average selling prices online are 89% higher than the category average, a result of the growing popularity of electric toothbrushes. Those prices more than outweigh the fact that 42% of sales are tied to promotions. At the other end of the spectrum, some categories rely on online channels for bulk-pack and combo offer promotions. This is the case for both toilet tissue and milk, which have online average selling prices that are about 12% lower than offline, resulting from a high 50% promotion rate online. In both categories, bulk purchases and overcapacity are contributing factors. In milk, there’s an added reason for the price difference between channels: Brands focus their online efforts on lower-priced basic milk products (as opposed to more premium products such as fortified milk).
Different categories find different value in online channels
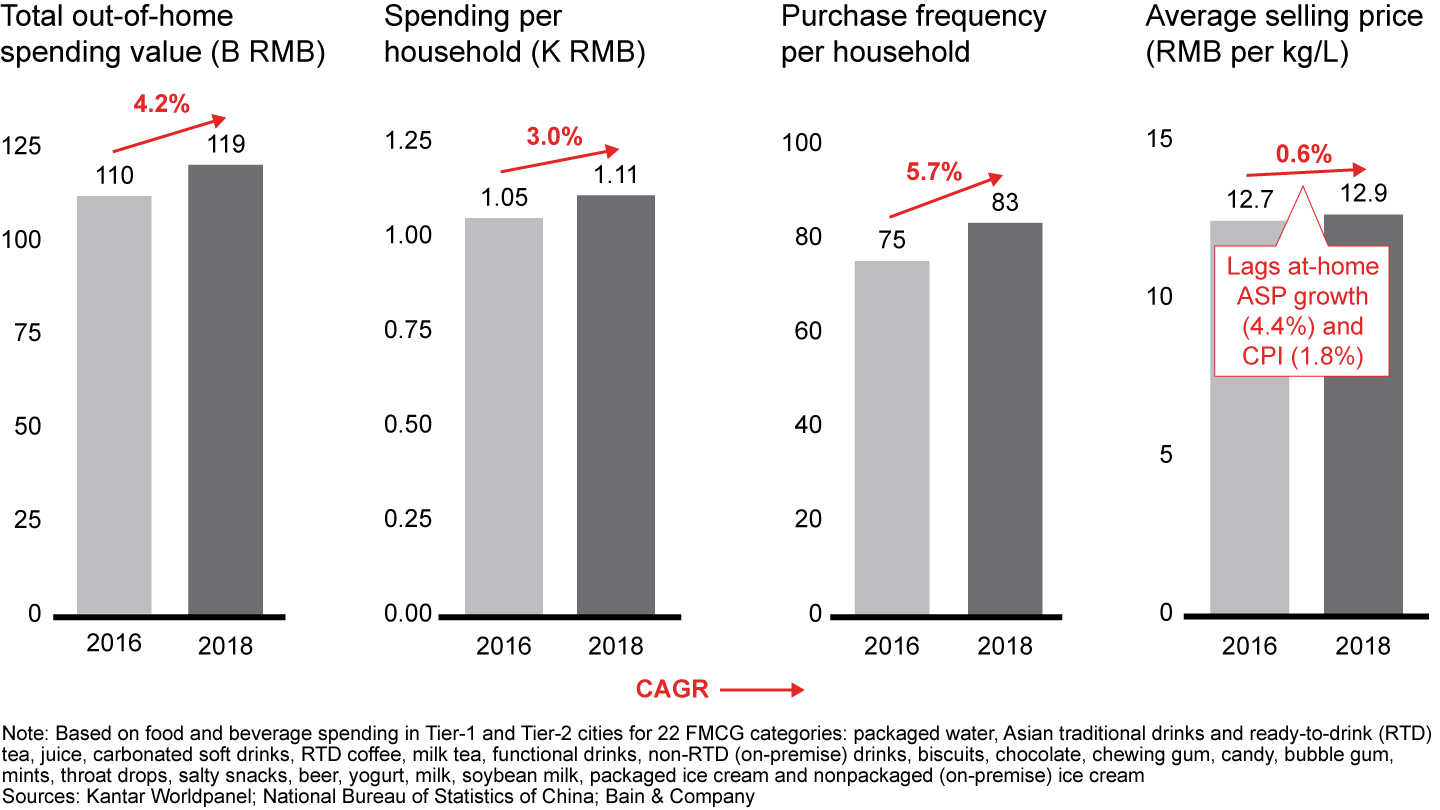
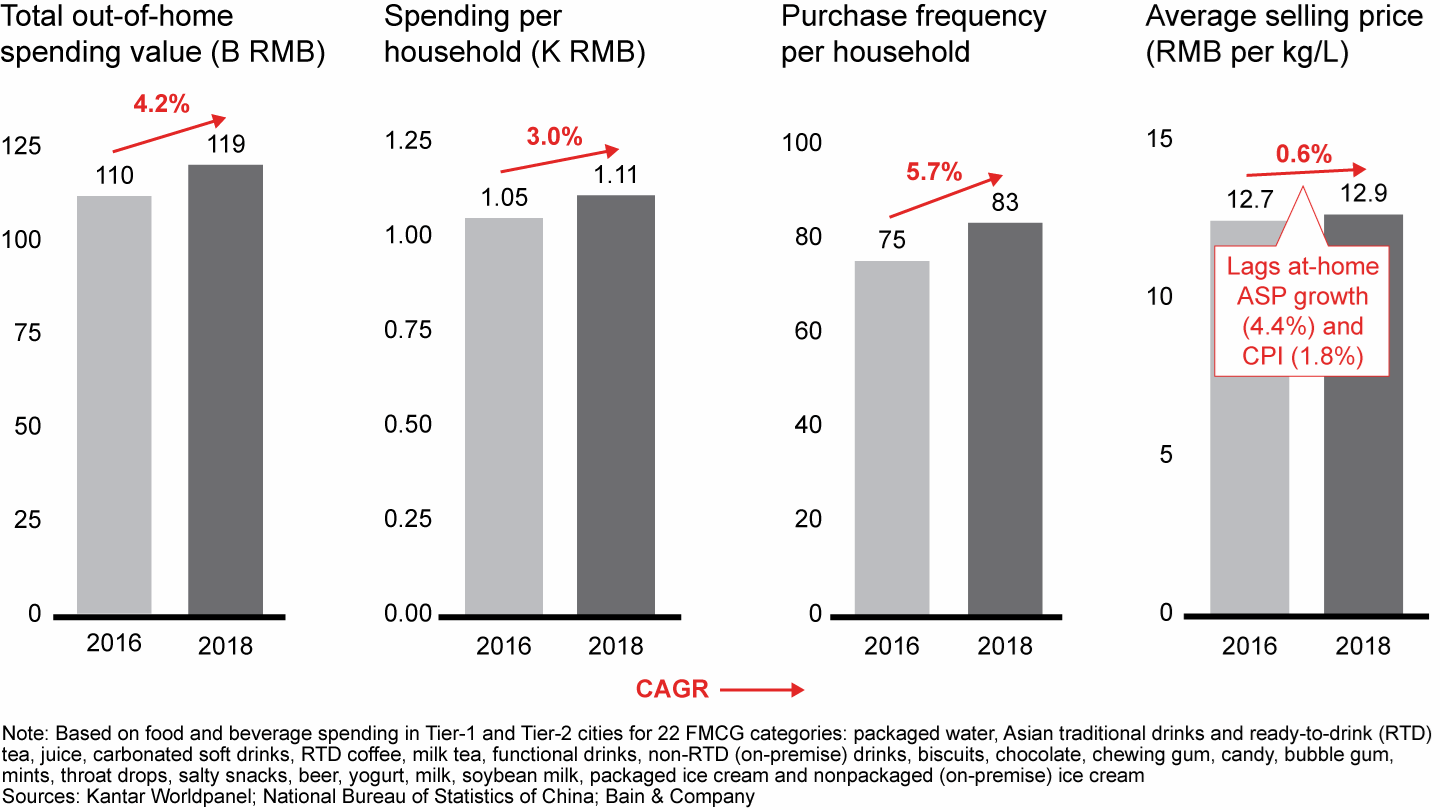
Out-of-home sales rise, but pressure on prices. For the third consecutive year, we analyzed Kantar Worldpanel data on FMCG purchases for out-of-home consumption, including 22 categories such as packaged water, Asian traditional drinks, chewing gum, biscuits, beer and nonpackaged ice cream. Kantar tracked sales at convenience stores, hypermarkets, supermarkets, groceries and a range of other outlets—from newsstands and restaurants to tea shops, bars, cinemas, gas stations and vending machines, all in Tier-1 and Tier-2 cities. While total out-of-home spending, per-household spending and purchase frequency all continue to grow, average selling price growth lags both the consumer price index and at-home price growth. The result is slower overall out-of-home spending growth (see Figure 12).
While out-of-home purchase frequency continues to grow, price growth lags both the consumer price index and at-home price growth, resulting in slower overall out-of-home spending growth
What is behind the stagnant ASP growth for out-of-home sales? The main cause is a more competitive environment for food and beverage categories. There is now heavy competition from New Retail players, for example, and from popular online-to-offline (O2O) food delivery platforms like Meituan and Ele.me, which have heavily promoted their services by offering coupons and discounts. In addition, leading coffee and tea chains have upped their game in delivery of food and beverage products.
However, our research determined that convenience and grocery stores still have great potential to grow out-of-home sales in 10 food and beverage categories: beer, packaged water, RTD tea, juice, CSD, biscuits, chewing gum, chocolate, candy and yogurt. Out-of-home sales represent 88% of those categories’ total sales in convenience stores and nearly 80% in grocery stores. Further evidence of their promise: In Tier-1 and Tier-2 cities, convenience store sales of goods for out-of-home consumption jumped by an annual 17%, purchase volume increased 12% and average selling prices rose 5%—outperforming sales of goods for at-home consumption in all three measures. Consider that out-of-home sales of chewing gum, candy and chocolate grew by an average 20% annually in convenience stores and 19% in groceries from 2016 to 2018, in contrast with negative growth in those categories for at-home consumption.
New hope for offline stores. There is good news for offline stores. While offline channels continued to lose share to online in 2018, the pace of the loss is decelerating. Let’s look at each channel one by one.
Hypermarkets. As we have seen in previous years, China’s shoppers are making fewer trips to hypermarkets thanks to the growing popularity of online channels and O2O delivery. Hypermarkets’ share of the urban FMCG retail market dropped from 23.6% in 2014 to 20.2% in 2018, with lower frequency, flat average volume per household and slightly declining penetration.
Super- and minimarkets. While super- and minimarketsmay have lost share in 2018, they still achieved growth of 1.9%. They maintain their position in part because of their proximity to local neighborhoods.
Traditional trade (groceries). Here, too, we see signs of a turnaround. At-home consumption represents about 20% of spending in grocery stores for Tier-1 and Tier-2 cities, and while that portion of sales is dropping, the rate of decline has slowed from –5.7% for the period 2014–18 to –1.2% in 2018. However, the brighter prospects are in the share of sales for out-of-home consumption. Within traditional trade, food and beverage sales intended for out-of-home consumption have risen by 14% annually since 2016, accounting for nearly 80% of grocery spending in 2018, for the 10 food and beverage categories we focused on.
Convenience stores. As we noted in last year’s China Shopper Reports, convenience stores remain the healthiest of offline formats. They maintain steady growth as people shop more frequently and spend more, especially for out-of-home consumption in Tier-1 and Tier-2 cities (see Figure 13).
Convenience stores maintain healthy growth in Tier-1 and Tier-2 cities, as people shop more frequently and spend more
Enter New Retail. For the past eight years, we have tracked Chinese shoppers’ behavior as they shift between offline and online channels. But the truth is the lines are quickly blurring. Online no longer means pure e-commerce, as it has since the days when it was commonly referred to as “Internet shopping.” O2O platforms have emerged. Traditional online platforms like Alibaba are buying offline channels. Traditional brick-and-mortar retailers like Walmart and RT-Mart are embracing online channels. We have been reporting on this trend in its many forms, including:
- Offline retailers using e-commerce and O2O platforms to provide delivery service within three kilometers of offline outlets. Think Walmart’s investment in Dada-JD Daojia and RT-Mart’s partnership with Alibaba.
- The upgrading of offline retailing, including Alibaba’s Lingshoutong (LST) inventory management platform and JD.com’s Xintonglu (XTL).
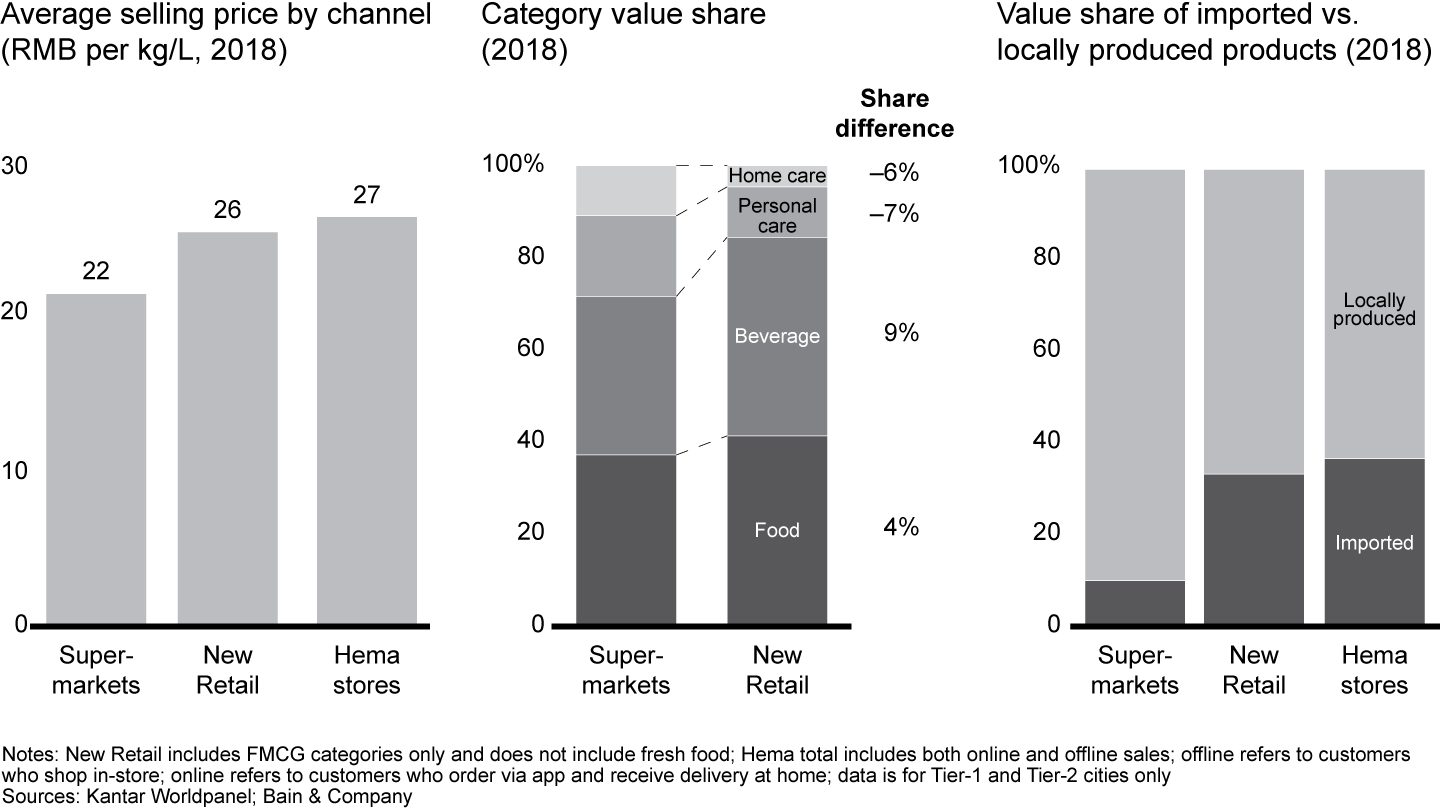
- The New Retail format, which enables seamless integration of online and offline shopping experiences by building a retail ecosystem. Major players such as Hema, Carrefour Le Marche and Yonghui’s Super Species are supermarkets where consumers can order online, shop in the store and enjoy multiple dining menus, on-site or delivered. New Retail stores devote much of their space to in-store dining and also serve as delivery hubs. Now limited to Tier-1 and Tier-2 cities, New Retail is still in the early stages of development, with 5% penetration and lower purchase frequency than traditional physical channels. However, these New Retail outlets, which cater to younger and higher-income shoppers, are benefiting from higher average selling prices and have a bigger mix of food and beverages, as well as imported products (see Figure 14).
New Retail is benefiting from food and beverage sales, higher average selling prices and more imported products
As pure online channels see the limits of growth, we believe the tide is turning for offline channels. Physical stores will take on new roles, including the many dimensions of New Retail. The offline formats that come out on top will be those that do the best job of serving the new and constantly changing needs of Chinese consumers—offering quick delivery or investing to differentiate with fresh food and exciting ready-to-eat menus, for example.
Winning brands: Small vs. large, local vs. foreign
Small brands, big challenge. In addition to the emergence of New Retail, we analyzed another big trend with major implications. In China Shopper Report 2018, Vol. 2, Local Insurgents Shake Up China’s “Two-Speed” Market, we showed how China’s insurgent brands are taking a disproportionate share of FMCG growth. These are brands like Bliss Cake, ChaoNeng and Yunnan Baiyao—names that were not easily recognized until a few years ago.
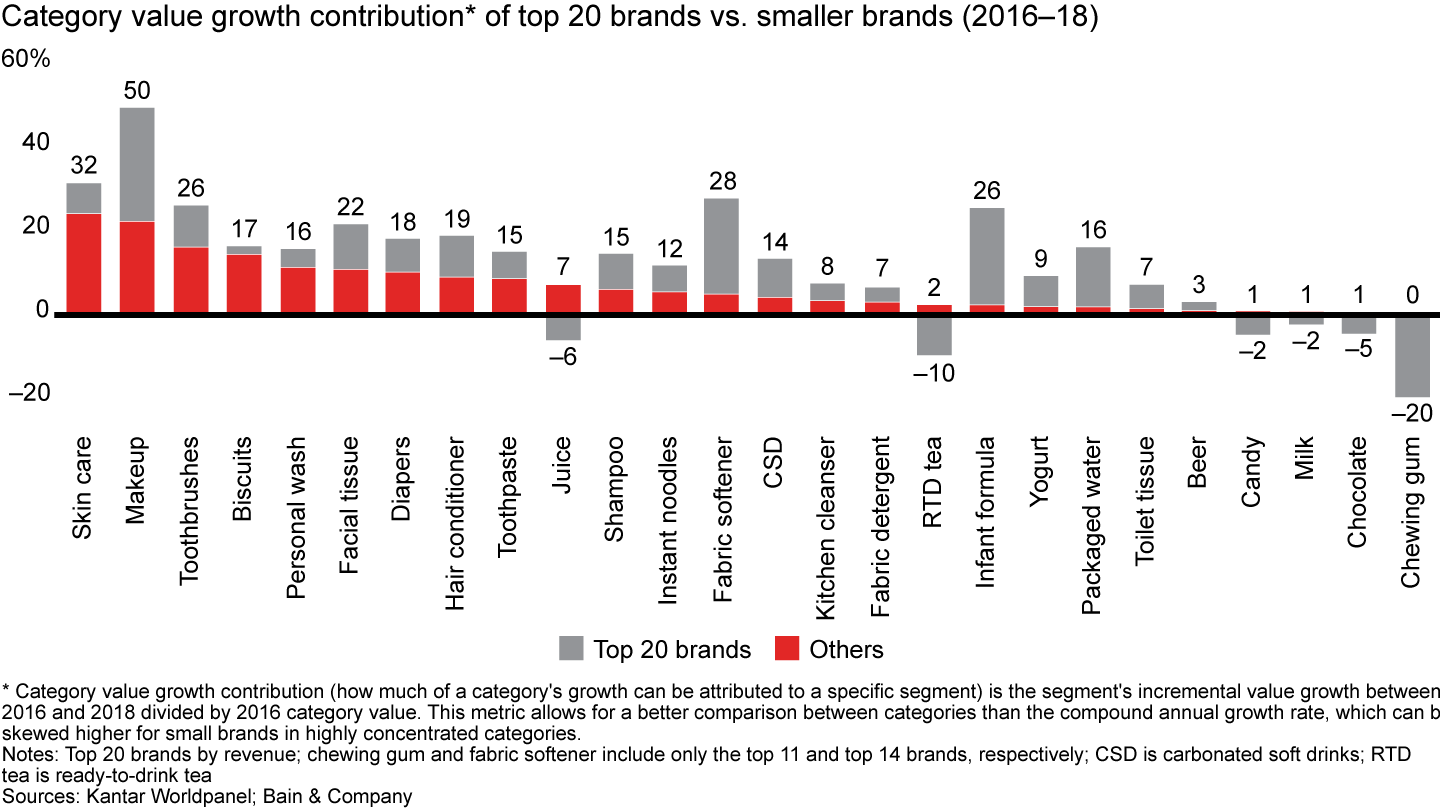
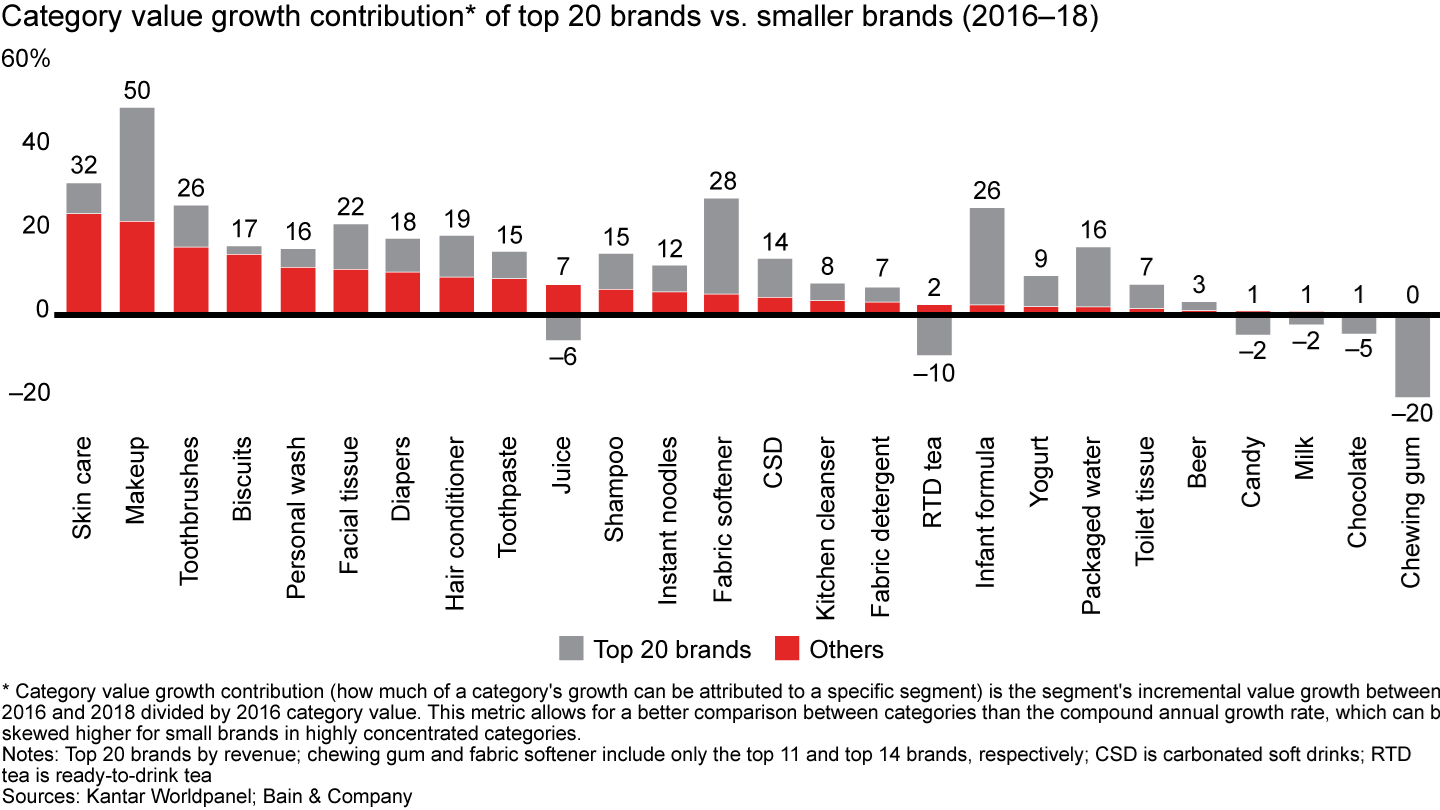
The trend has continued this year with a vengeance. We first looked at the growth of the top 20 brands compared with smaller brands, and the picture is very telling: Across many categories, small brands account for more category value growth than their top 20 counterparts (see Figure 15). In skin care, for instance, the top 20 brands delivered only 9% of the category growth, vs. nearly 23% for the small brands. The situation was even more dramatic in personal wash and biscuits, where the top 20 brands generated 5% and 2% of the category growth, respectively, vs. 11% and 15% for the small brands.
Across many categories, small brands account for more value growth than their top 20 counterparts
We then looked more deeply into the top 20 brands, comparing the performance of the top 5 brands with the remaining 15. Over the last three years, those big, established brands have lost share in most categories—16% in diapers, 7% in RTD tea and 5% in juice, for example (see Figure 16). In fact, the top five brands have managed to gain meaningful share in only four categories: toothbrushes, milk, packaged water and makeup.
Over the last three years, top 5 brands lost share in most categories
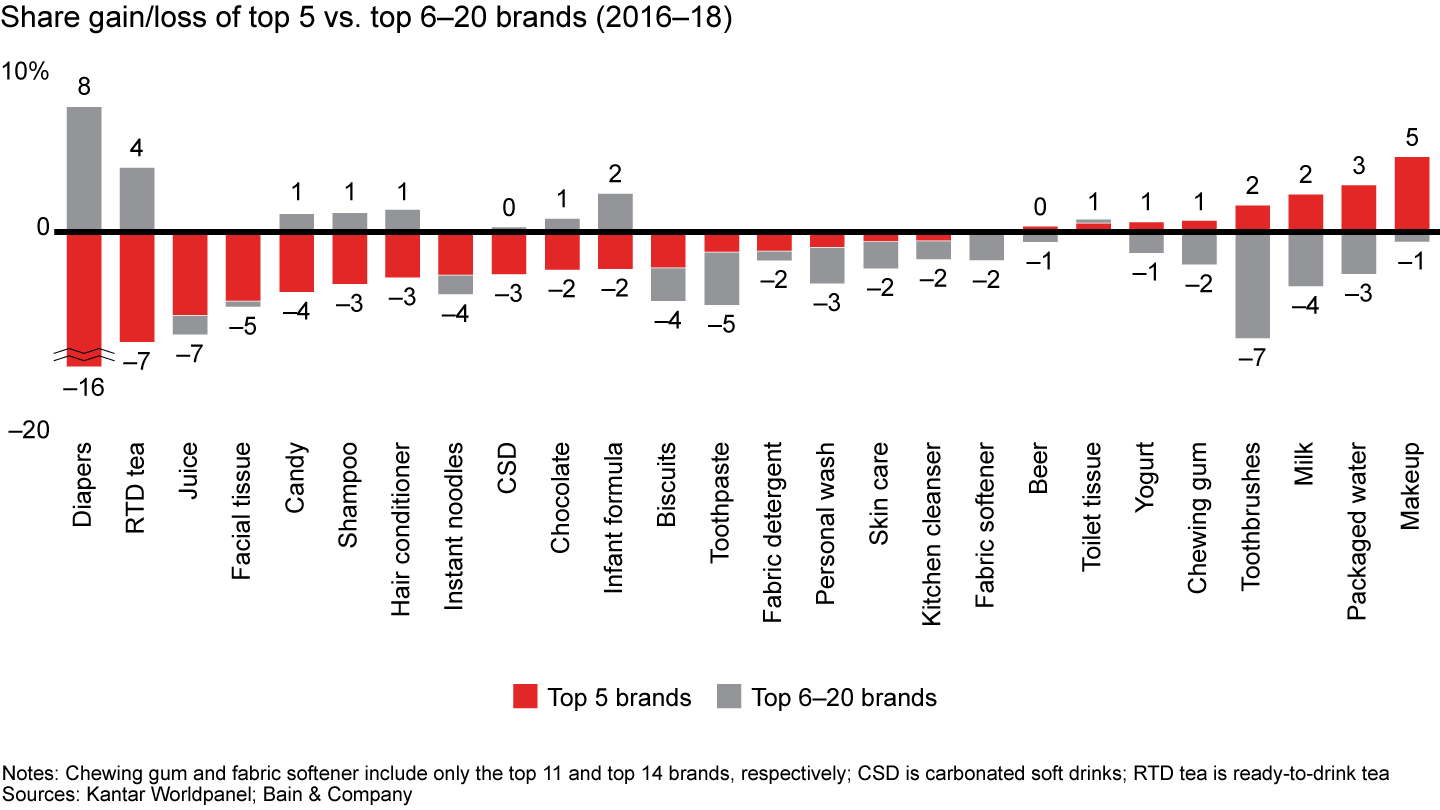
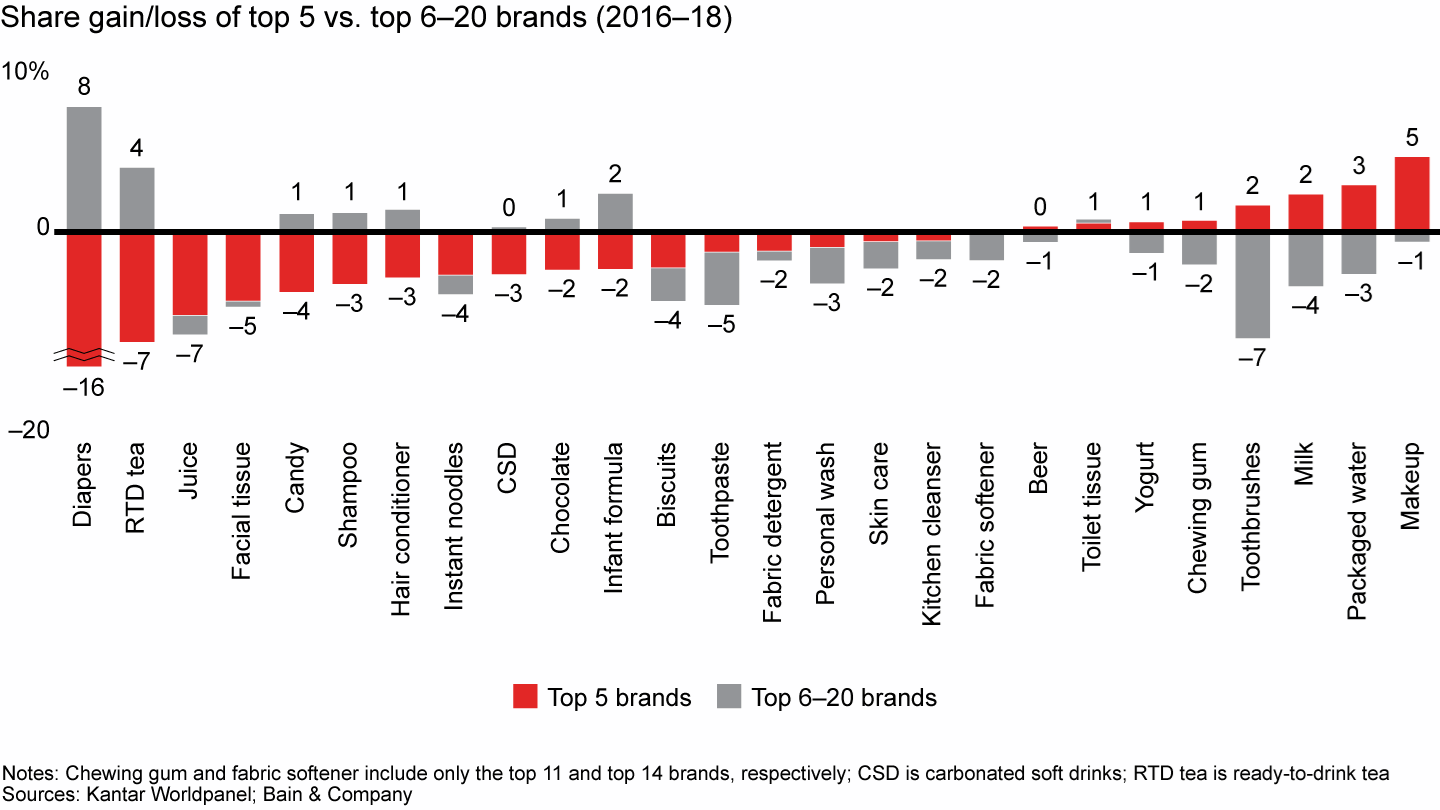
Smaller brands are the growth leaders—they grew faster than the top five brands in all categories except makeup and packaged water. Small brands have many things in their favor: They are adept at serving an unmet consumer need, they are often better skilled than their larger counterparts at digital marketing and social media, and many have asset-light business models that give them an edge over well-established consumer goods companies.
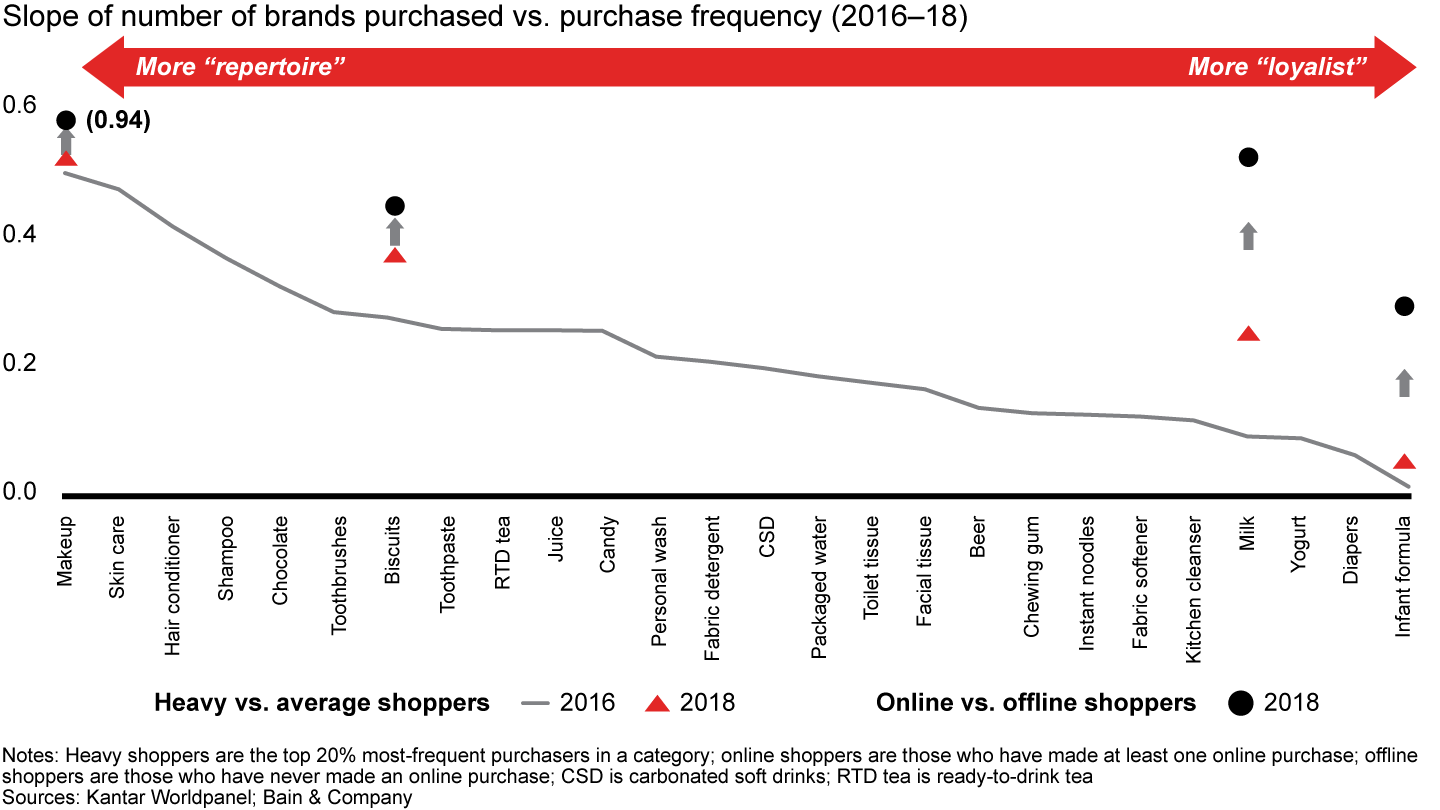
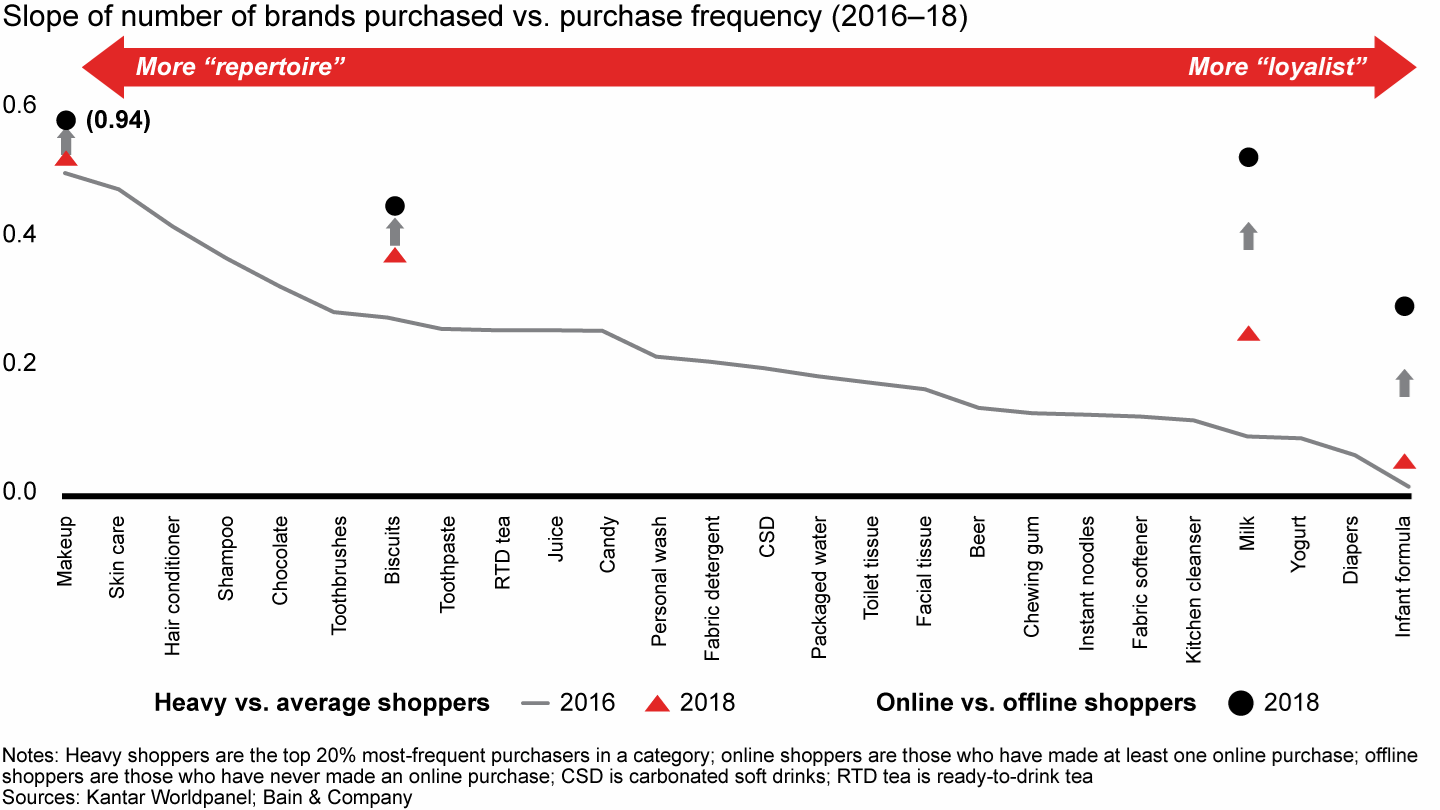
The fragmentation observed in most categories, with smaller insurgent brands gaining share against the top five brands, can be partially explained by increasing “repertoire” behavior among Chinese consumers (see Figure 17). We looked at four categories in detail: makeup, biscuits, milk and infant formula, which are representative of the repertoire-loyalist spectrum8 and the low-high e-commerce penetration dimension. The first observation is that all four categories are more repertoire today than they were two years ago. Second, online consumers demonstrate much more pronounced repertoire behavior than offline consumers. As consumers move more and more online, their repertoire behavior will increase.
When they shop more, online shoppers tend to choose different brands
Against this backdrop, whether to focus on growing big brands or on building a portfolio of different brands to serve different segments is a question that nags at every FMCG executive. It’s a decision that sometimes calls for a major strategic transformation; billion-dollar brands are vastly different animals than $25 million brands, requiring significantly different management approaches and operating models.
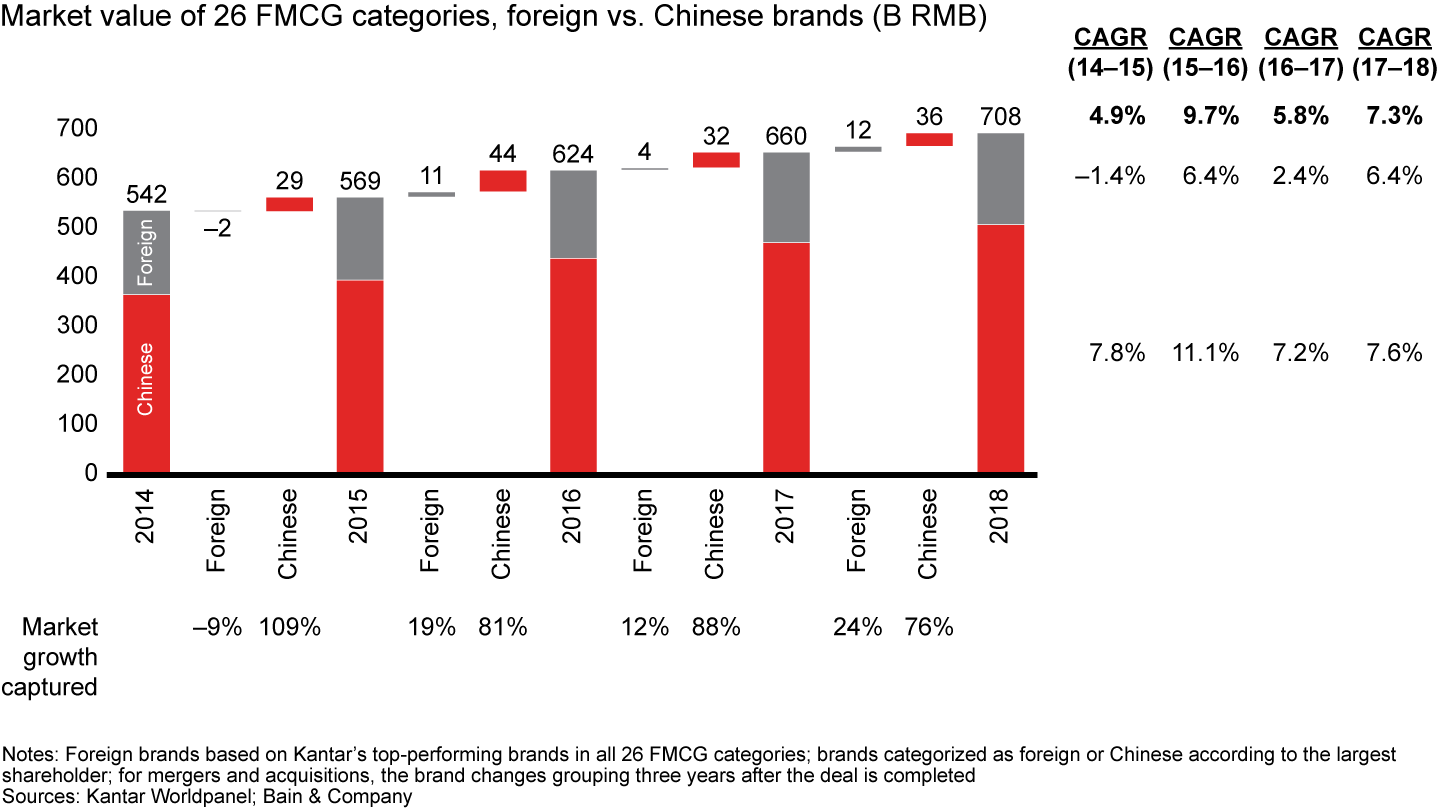
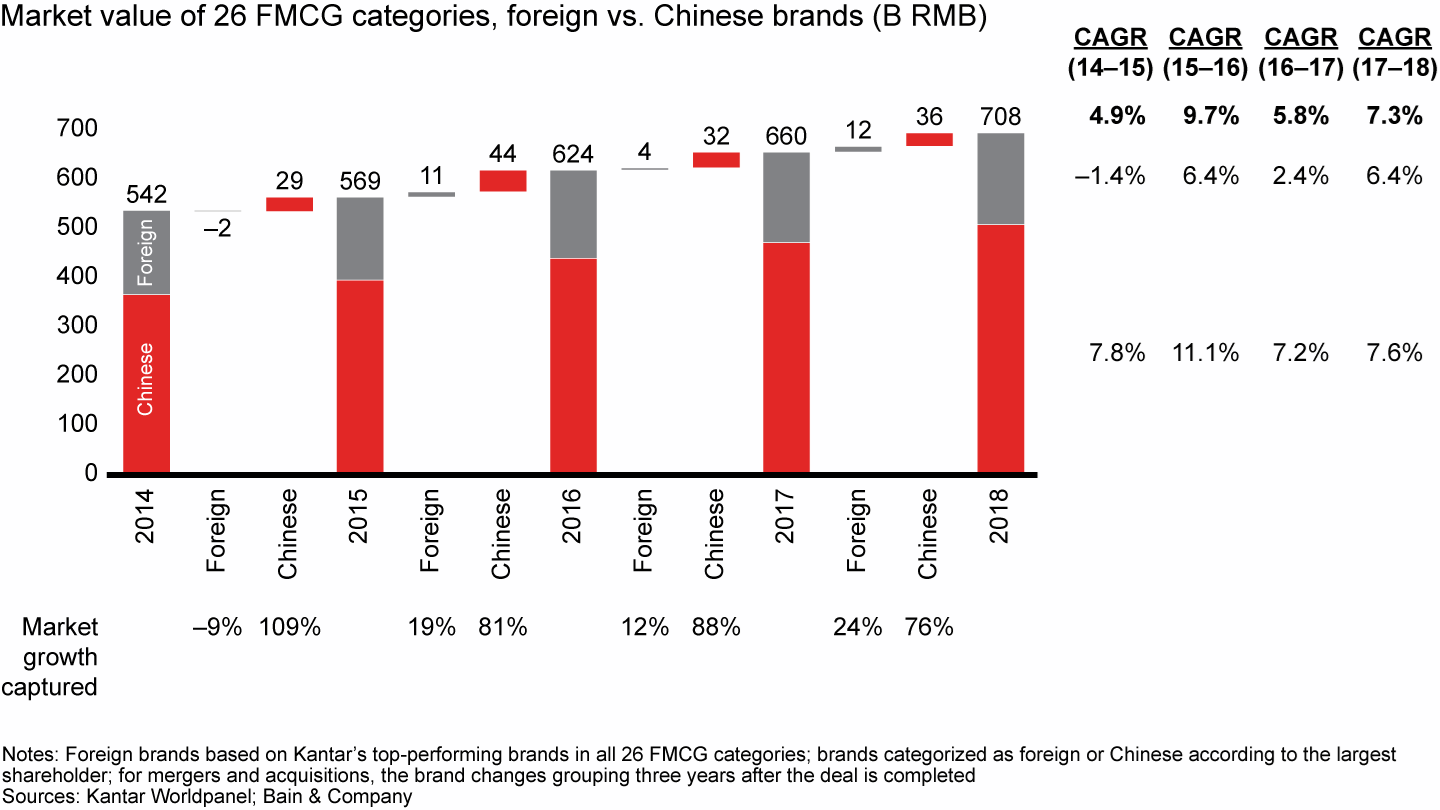
The foreign vs. local battle continues. As we have seen every year, local players continued to gain share over foreign competitors on an aggregate basis. Chinese brands have grown by 15% since 2016, contributing 76% of market growth in 2018 (see Figure 18). By comparison, foreign brands grew more slowly—by 9% since 2016—and contributed 24% of last year’s market growth. The encouraging news for foreign brands: Despite being outpaced by domestic companies, that 24% share of market growth is actually double the rate of 2017. Foreign brands are learning what it takes to win in China. It requires keeping pace with the market’s rapid changes and a “4D” approach: design for China, decide in China, deliver at China speed and digitalize the China business (see the Bain Brief “Consumer Products: Now’s the Time to Double Down on China”).
Chinese players have more than 70% market share and contributed 76% of market growth; foreign brands also performed well in 2018
Truth is, local and foreign brands alike can discover ways to win. In the toothbrush category, for example, Philips and Oral-B grew more than three times their category average by investing to innovate electric toothbrushes and with a focus on online channels, which account for 60% of those brands’ sales. Among local companies, toothpaste brands like Yunnan Baiyao and Pien Tze Huang have grown twice as fast as the category average by featuring new products that contain traditional Chinese medicine ingredients.
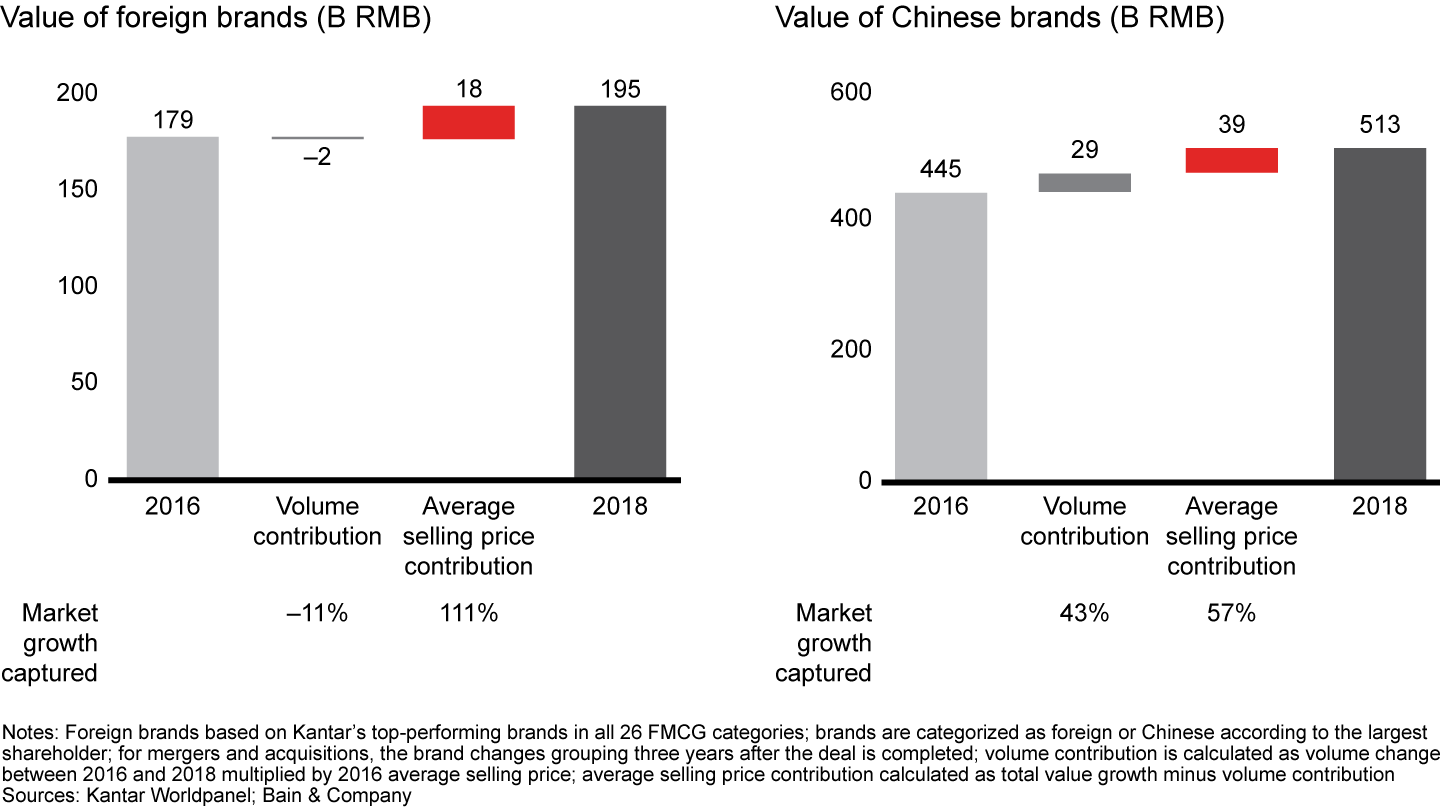
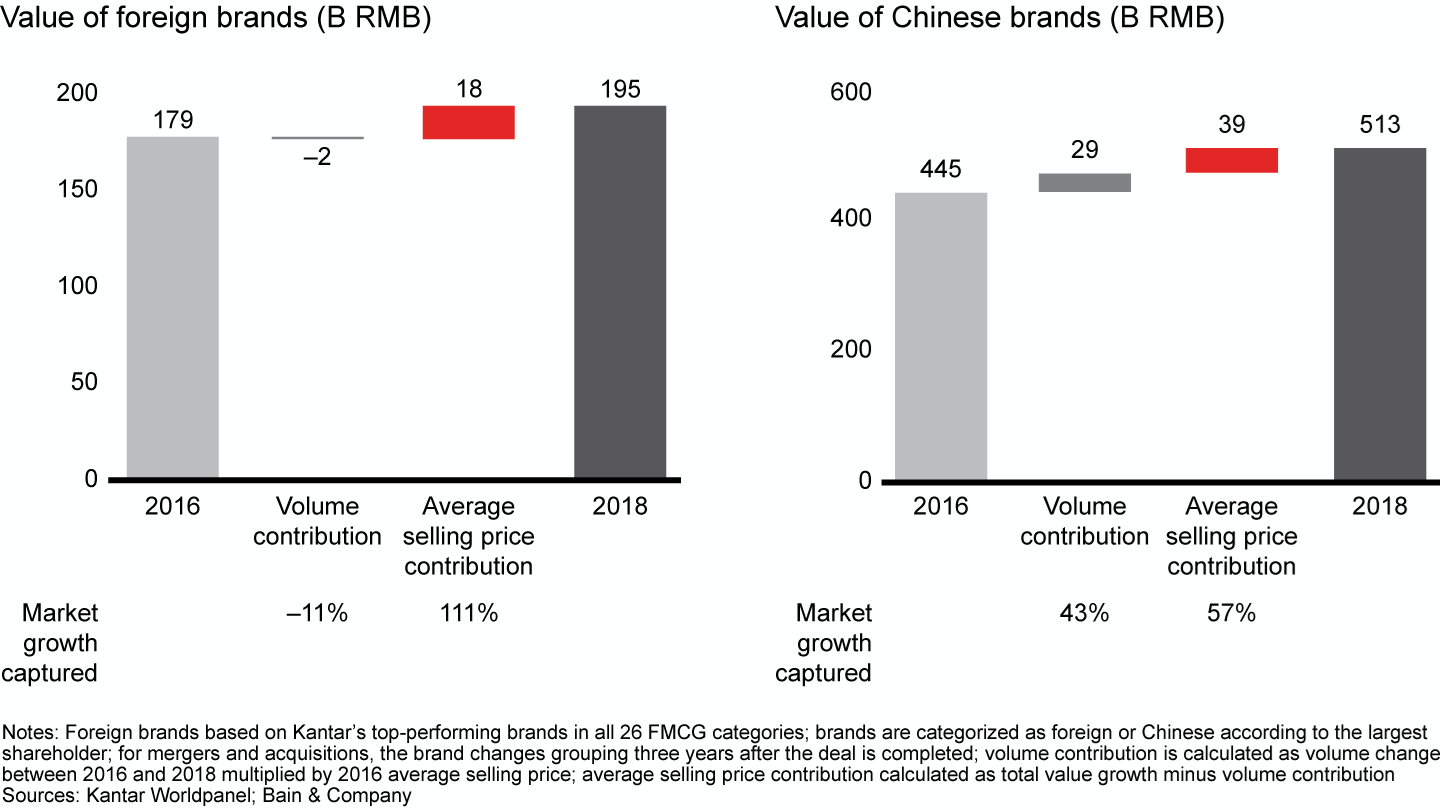
All of these companies—foreign and local—have received a message that could serve as a mantra for success with China’s shoppers: Premiumization can be a key to growth (see Figure 19). However, Chinese brands demonstrate the importance of having a growth model that is more evenly balanced between volume and premiumization.
Premiumization is a more important growth driver for foreign brands than it is for Chinese brands
Implications for brands and retailers
How brands can win. The three key implications for brands that we mentioned last year still hold true:
- Take advantage of channel dynamics, grow with the winning channels and anticipate retailers’ consolidation;
- Develop high-value and personalized products to make the most of the premiumization trend; and
- Become a data-driven, consumer-centric organization by collaborating with platforms but also by developing your own set of consumer data.
This year we add a fourth important implication based on the success of insurgent brands: Develop a portfolio of brands to grow overall share in a category, taking advantage of the fragmentation of consumer needs and shoppers’ thirst for innovations.
How retailers can win. The acceleration of New Retail presents opportunities for retailers to transition from today’s mass-oriented, offline approach to tomorrow’s seamless, multichannel world of shopping. Physical stores have a future, but offline retailers need to refine their moves to play in this new environment. Specifically, they’ll need to:
- Redesign store portfolios in the New Retail format;
- Make the store experience more attractive by leveraging new technologies like augmented reality; and
- Digitalize operations to deliver a seamless experience to consumers, whether they buy online or offline, and start to monetize consumer data for better cooperation with brands.
1 These 26 categories are a) packaged food: biscuits, chocolate, instant noodles, candy, chewing gum and infant formula; b) beverages: milk, yogurt, juice, beer, ready-to-drink (RTD) tea, carbonated soft drinks (CSD) and packaged water; c) personal care: skin care, shampoo, personal wash, toothpaste, makeup, hair conditioner, diapers and toothbrushes; and d) home care: toilet tissue, fabric detergent, facial tissue, kitchen cleanser and fabric softener.
2 These 19 categories are soybean milk, mouthwash, oyster sauce, pet food, kitchen rolls, RTD coffee, hair colorant, quick soup, functional drinks, sesame sauce, hamburger, monosodium glutamate, soft cake, foreign spirits, leather care products, napkins, Chinese spirits, cooking oil and nutrient supplements.
3 These 22 categories are packaged water, Asian traditional drinks and RTD tea, juice, CSD, RTD coffee, milk tea, functional drinks, non-RTD (on-premise) drinks, biscuits, chocolate, chewing gum, candy, bubble gum, mints, throat drops, salty snacks, beer, yogurt, milk, soybean milk, packaged ice cream and nonpackaged (on-premise) ice cream.
4 Penetration is defined as the percentage of households in a market buying a particular FMCG category in a given year.
5 Online penetration is defined as the number of people who bought online at least once per year divided by the number of people who bought the category at least once.
6 Relative online penetration is defined as the total number of online purchasers divided by the number of purchasers of the category.
7 These 10 categories are beer, packaged water, RTD tea, juice, CSD, biscuits, chewing gum, chocolate, candy and yogurt.
8 Bain research shows that consumer behavior ranges between two extreme types: loyalist and repertoire. Consumers demonstrate loyalist behavior when they repeatedly buy one brand for a specific need or occasion. In contrast, consumers exhibit repertoire behavior when they tend to choose different brands for the same occasion or need. Most people display both loyalist and repertoire behaviors, depending on the category they are buying.
About the authors and acknowledgments
Bruno Lannes is a partner with Bain & Company’s Consumer Products and Retail practices, and is based in Shanghai. You may contact him by email at bruno.lannes@bain.com.
Derek Deng is a partner with Bain & Company’s Consumer Products and Retail practices, and is based in Shanghai. You may contact him by email at derek.deng@bain.com.
Marcy Kou is CEO of Kantar Asia's Worldpanel division. You may contact her by email at marcy.kou@kantarworldpanel.com.
Jason Yu is managing director at Kantar Worldpanel Greater China. You may contact him by email at jason.yu@ctrchina.cn.
This report is a joint effort between Bain & Company and Kantar Worldpanel. The authors extend gratitude to all who contributed to it, especially Yang Lin, Ada Tang and Claire Zhao from Bain, and Rachel Lee, Tina Qin, Robin Qiao and Lorna Peng from Kantar Worldpanel.
This work is based on secondary market research, analysis of financial information available or provided to Bain & Company and a range of interviews with industry participants. Bain & Company has not independently verified any such information provided or available to Bain and makes no representation or warranty, express or implied, that such information is accurate or complete. Projected market and financial information, analyses and conclusions contained herein are based on the information described above and on Bain & Company's judgment, and should not be construed as definitive forecasts or guarantees of future performance or results. The information and analysis herein does not constitute advice of any kind and is not intended to be used for investment purposes. Neither Bain & Company nor any of its subsidiaries or their respective officers, directors, shareholders, employees or agents accept any responsibility or liability with respect to the use of or reliance on any information or analysis contained in this document. This work is copyright Bain & Company and Kantar Worldpanel and may not be published, transmitted, broadcast, copied, reproduced or reprinted in whole or in part without the explicit written permission of Bain & Company and Kantar Worldpanel.
Kantar Worldpanel—Inspiring Successful Decisions, a CTR service in China
Kantar Worldpanel is the global expert in shoppers’ behavior.
Through continuous monitoring, advanced analytics and tailored solutions, Kantar Worldpanel inspires successful decisions by brand owners, retailers, market analysts and government organizations globally.
With more than 60 years’ experience, a team of 3,500 and services covering 60 countries directly or through partners, Kantar Worldpanel turns purchase behavior into competitive advantage in markets as diverse as FMCG, impulse products, fashion, baby, telecommunications and entertainment, among many others.