Report
Note to readers
Welcome to the third annual report on the global diamond industry prepared by Bain & Company in association with the Antwerp World Diamond Centre (AWDC). Last year’s report, Portrait of Growth, primarily focused on consumer preferences, as revealed by surveys of more than 5,000 diamond consumers around the world. We are pleased that its insights were well received by industry players and the investment community.
Building on that solid foundation, Bain & Company and the AWDC have renewed their collaboration and prepared a new report for 2013. In this year’s edition, we look closely at the diamond value chain and trace diamonds’ route to market, offering for the first time a detailed view of channels and approaches for rough- and polished-diamond sales.
The report also identifies key trends along the value chain for rough and polished diamonds, as well as diamond jewelry. We compare 2012's results with those of previous years, highlighting the impact of continuing economic uncertainty on the diamond market. The report also reviews a significant new trend in diamond production: a stream of M&A activity among the top producers of rough diamonds.
Other new features in this year’s report are in-depth analyses of diamond sales models and approaches. We offer detailed descriptions of diamond sales channels and analyze the specifics of rough- and polished-diamond sales. We then summarize key challenges for players across the value chain and provide our view on key trends in the industry for the next three to five years.
We also provide an update on the outlook for the diamond industry through 2023. The 2023 demand outlook is based on our extensive market analysis and consumer research. The updated supply forecast is based on the latest developments of key diamond miners and the largest diamond mines worldwide.
Readers seeking a quick overview of the report’s conclusions will find a summary of key takeaways at the end of the chapters. Some of the most significant findings and conclusions include the following:
- A balanced market over the next four years, with a growing gap between supply and demand longer-term. The rough-diamond market is expected to remain balanced from 2013 through 2017. From 2018 onward, as existing mines get depleted and no major new deposits come online, supply is expected to decline, falling behind expected demand growth that will be driven by China, India and the US. Over the next 10-year period, supply and demand are expected to grow at a compound annual rate of 2.0% and 5.1%, respectively. The supply-demand outlook carries different implications for industry players at different points along the value chain, and it will impact the way they manage their business activities over the next four years and in the longer run.
- Upstream: a focus on operational excellence, strengthening the asset portfolio and adjusting the development pipeline. With stable market conditions in the next four years, mining companies are likely to focus on maintaining healthy balance sheets, attaining operational excellence and investing in technology to improve productivity. Given the supply-demand balance outlook, mining companies are also expected to carefully review their development pipelines to identify the projects that promise the highest returns.
- Middle market: continuing consolidation. The middle market has traditionally garnered the lowest margins along the diamond value chain, with some companies earning as little as 1–2%. Further consolidation and integration is expected in the middle of the value chain in order to maximize margins through scale and scope.
- Downstream: ensuring security of supply. Diamond jewelry retailers will be looking to capitalize on the growing demand for diamonds. Their key challenge will be to secure an adequate and consistent supply of polished diamonds in the range of sizes, shapes and colors suited to their product lines. A number of premium retailers have already integrated backwards along the value chain by investing in mining assets and cutting and polishing operations and securing access to primary rough supply. This trend is expected to continue.
We hope you will find the insights in the report useful and compelling, and we look forward to discussing them with you.
1. Overview of key trends along the value chain
Diamonds, which for centuries have symbolized love and eternity, are found in some of the world’s oldest pieces of jewelry. De Beers drew on that ancient symbolic legacy to make diamond engagement rings a token of romance and lifelong commitment—captured in the memorable catchphrase “a diamond is forever”—and in the process created the modern diamond industry.
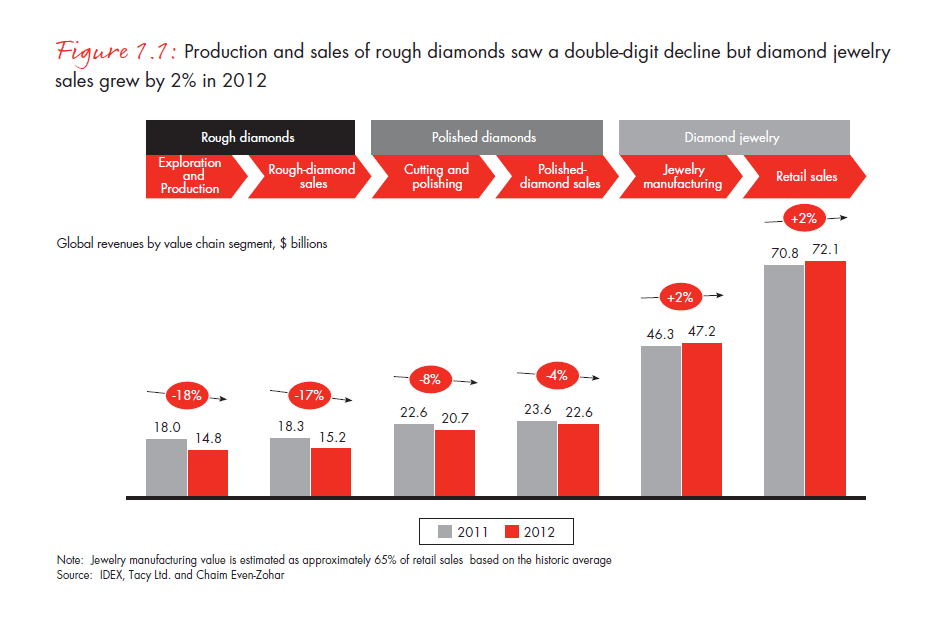
That industry has been on a rollercoaster ride since the global financial crisis of 2008. Prices plummeted in 2008 and 2009, only to rebound with astonishing speed to reach historically high levels in 2010 and 2011. Retail sales of diamond jewelry grew 1.8% from 2011 through 2012 to $72.1 billion, but the upstream and middle-market segments of the value chain came under pressure as overall prices for rough and polished diamonds declined by 14% and 13%, respectively (see Figure 1.1).
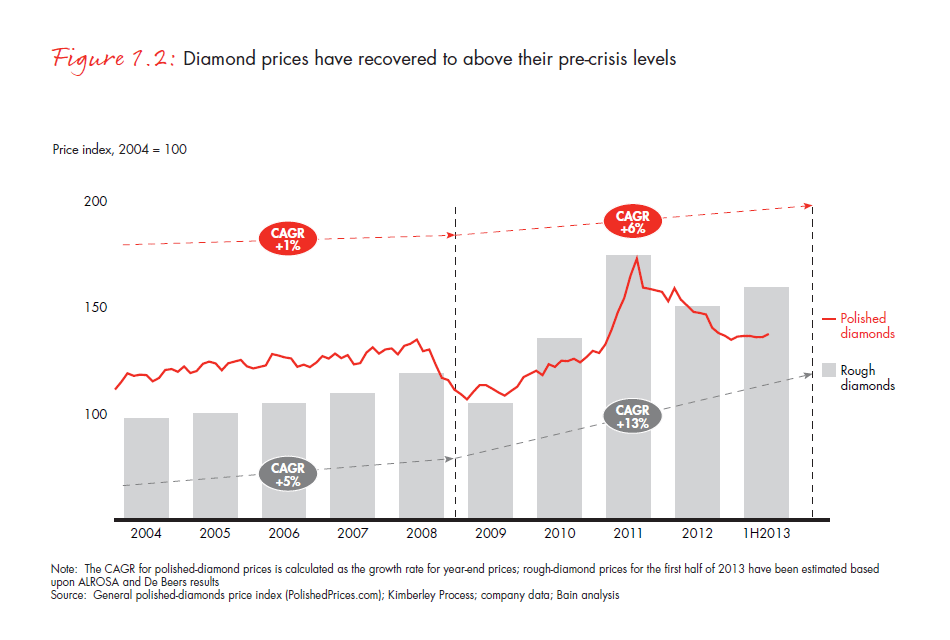
The market has shown signs of improvement in the first half of 2013. Market participants have observed encouraging trends in the US, Japan, China and India, and overall growth is moving back into line with longterm trends. Rough-diamond prices have increased at a compound annual rate of 13% since 2008 and are now higher than they were before the crisis (see Figure 1.2).
Global sales trends
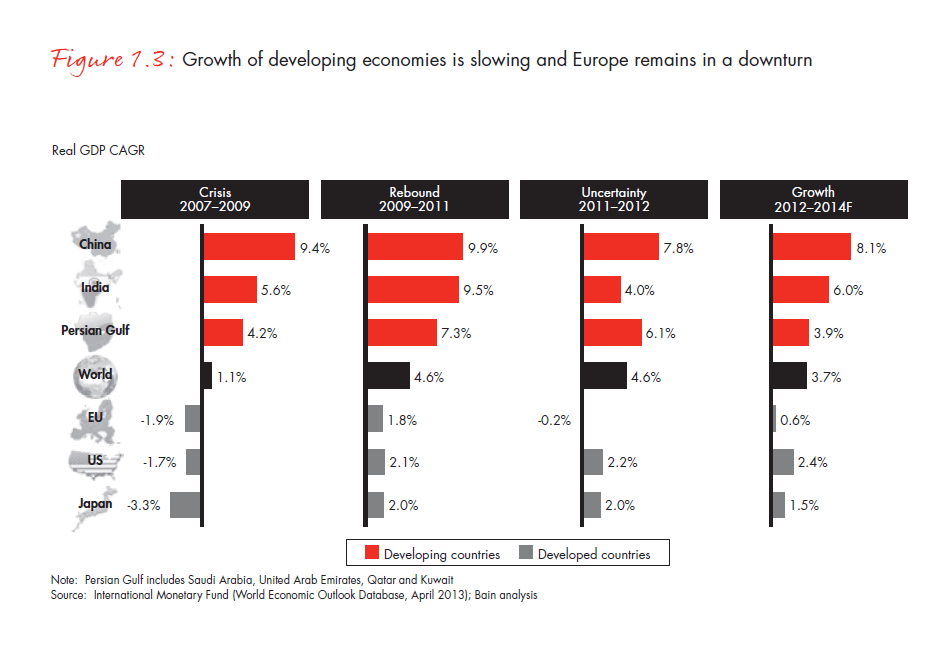
The diamond market’s skyrocketing growth in the key developing markets of China and India moderated in 2013 amid a wider economic slowdown. Although Europe’s sales suffered because of continuing economic uncertainty, diamond sales in the US and Japan, the largest and third-largest diamond markets in the world, respectively, rose on the strength of accelerating GDP growth and seem poised for continued growth in 2013 (see Figure 1.3). Market players in both countries report strong demand for diamonds in the first half of the year.
The 2013 outlook for market participants along the value chain is fairly positive, and many diamantaires seemed to emerge from the Las Vegas jewelry show in the beginning of June 2013 with renewed optimism.
The diamond value chain: Significant increases at every step
The value of diamonds increases significantly as they travel through the pipeline from the mine to the final market, nearly quintupling over the course of the journey. The greatest value—$25 billion or more in both cases—is added at the jewelry manufacturing and retail stages (see Figure 1.4).
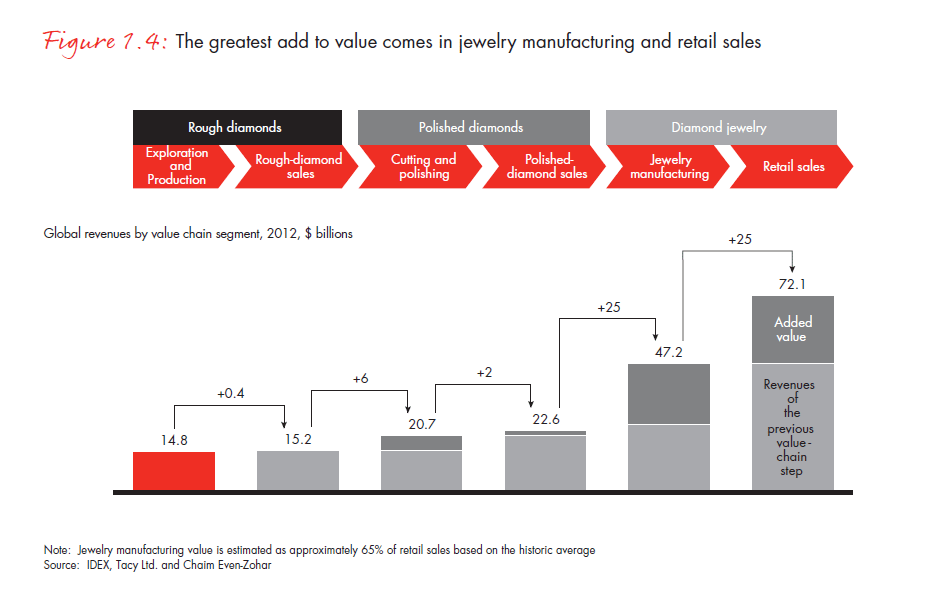
Rough-diamond production generates revenues of $14.8 billion. The revenues grow to $47.2 billion when the diamonds are manufactured into jewelry and grow again to $72.1 billion when the jewelry is sold at retail.
Rough-diamond production remains the most attractive point on the value chain, boasting profit margins of 16–20% (see Figure 1.5).
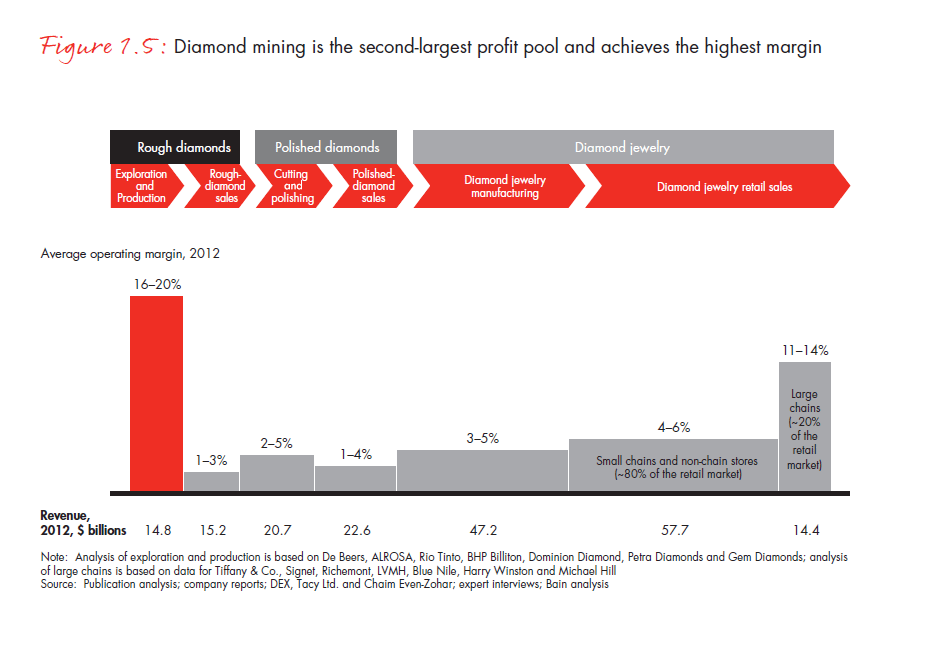
The only other segment of the market that generates comparable margins is retail, where large chains such as Tiffany & Co. and Cartier can achieve margins of 11–14%. Other points along the value chain are far less profitable, with players at the cutting and polishing stage generating profit margins of 1–8% (players at the cutting and polishing stage are also frequently involved in other activities along the value chain and able to gain additional margin from those activities).
Synthetics causing a stir
Synthetic diamonds were in the news again in 2012, with several reports that synthetic stones had been marketed as natural and had been discovered only when they were tested in specialized laboratories. (Legitimately certified synthetics are laser-inscribed with a unique identifying number and name.) The incident that attracted the most publicity occurred in May, when the International Gemological Institute received 1,000 stones for testing. It turned out that 600 of the stones were synthetic, and some, according to one industry source, had induced impurities that made them appear natural upon first inspection. De Beers’ Diamond Trading Company Research Center also reported several cases of undisclosed submissions of synthetic diamonds to grading labs in China and India.
In response to these and other attempts to pollute the pool of natural diamonds, producers such as De Beers and independent laboratories such as AG&J, HRD and IGI are developing and actively marketing new testing equipment. De Beers recently announced that it had developed a synthetic melee detector that can automatically check large volumes of small diamonds for authenticity. After using the device to screen thousands of parcels of diamonds, De Beers is confident that the equipment is effective in detecting small synthetics in parcels and its deployment will strengthen the industry’s ability to detect synthetics in the pipeline. No synthetics were detected during the trial of the equipment.
Continued interest in the diamond investment market
The diamond investment market retains its allure. Investors continue searching for the best way to capitalize on the growth in diamond prices, expecting that diamonds, just like gold and platinum, are destined to become the next big alternative investment.
Despite the persistent difficulties with valuation, the absence of a spot market and the lack of a proven track record of success in the space, new funds are emerging that offer ever new ways to invest in diamonds with the goal of capturing the expected robust returns in the diamond market.
To name just a few new funds attempting forays into the diamond investment space: Pink Iguana (a fund to invest in diamonds, with the contribution ranging from £10,000 to £1 million) and a diamond fund from Swiss Asset Advisors (a recently announced fund that will offer flexibility to have the investments returned at any time). They join such existing funds as Singapore Diamond Exchange (a private diamond exchange that offers mid- to long-term investment opportunities) and Diamond Asset Advisors (which was in partnership with Harry Winston; it is yet to be seen if that partnership will be transferred to Swatch group, which has purchased the retail business of Harry Winston Diamond).
The diamond industry should address the transparency of pricing and establish an independent source of diamond prices to support a potential diamond-investment market.
Key takeaways
- The diamond industry had mixed results in 2012. Rough-diamond revenues declined 18% from 2011, to $14.8 billion, while retail sales of diamond jewelry grew 1.8% over 2011, to $72.1 billion.
- Although it is too early to say how 2013 performance will turn out, industry participants are cautiously optimistic given that demand in the US and Japan is increasing.
- Both rough- and polished-diamond prices have recovered to their pre-crisis levels. Rough-diamond prices increased at a compound annual rate of 13% since 2008, while polished-diamond prices grew at a compound annual rate of 6% in the same period.
- The greatest value added along the diamond value chain is at the jewelry manufacturing and retail stages, which both added about $25 billion in value in 2012.
- The most attractive segment of the value chain remains exploration and production, which generates profit margins of 16–20%.
- New players continue attempts to boost the investment demand for diamonds.
2. Overview of rough-diamond production
Rough-diamond producers reacted to falling prices by cutting planned output, and technical problems at some mines also curtailed production. As a result, total rough-diamond output in 2012, as measured by carats, increased by a modest 4%, to 128 million carats (see Figure 2.1).
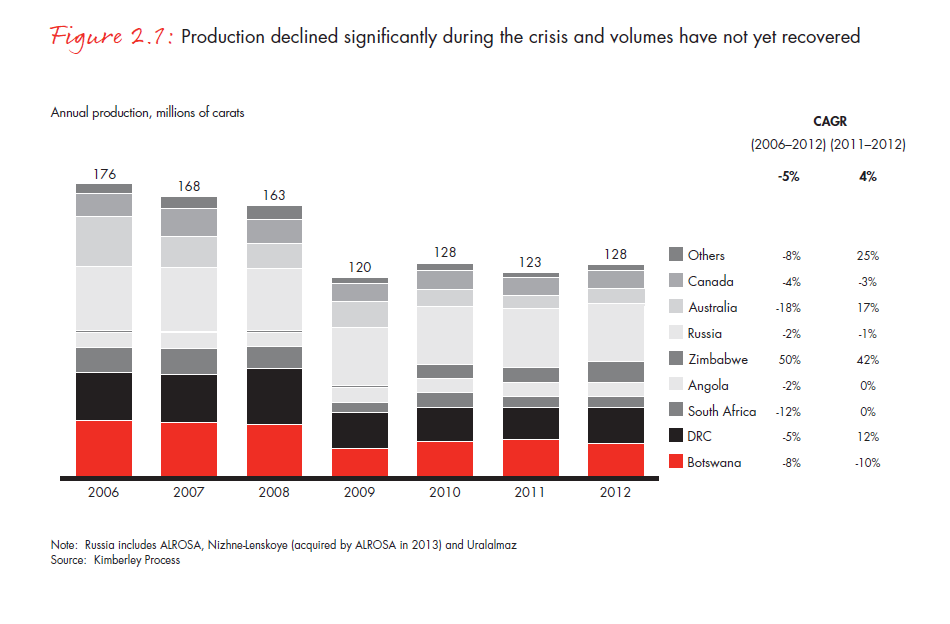
That’s still well below the precrisis peak output of 176 million carats in 2006. Revenues were affected by the price drop, decreasing 18%. Results for the first half of 2013 indicate that producers are on track with announced production plans.
The top five now the top four
The top producers defended their leadership positions. ALROSA, the leader in production volume since 2009, turned out 34.4 million carats in 2012, accounting for 27% of worldwide production (see Figure 2.2). De Beers remained the leader in value terms, posting $5.5 billion in sales, but ALROSA and Harry Winston Diamond (renamed Dominion Diamond in 2013) both increased their shares of rough-diamond sales and are gradually gaining on De Beers (see Figure 2.3).
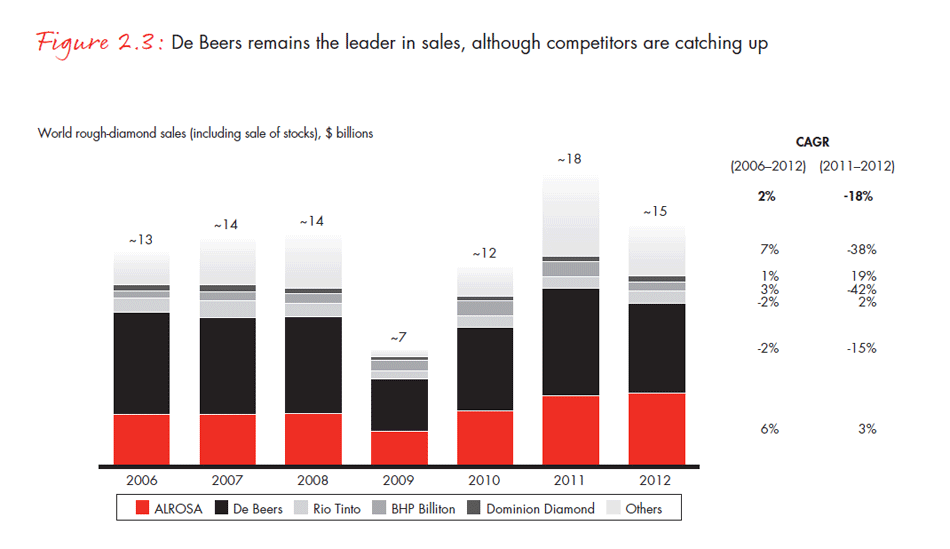
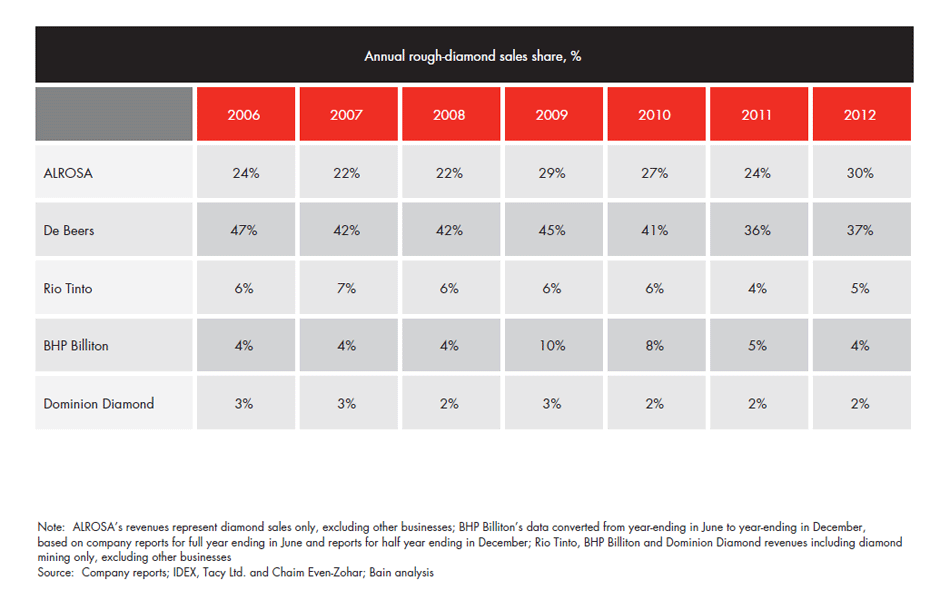
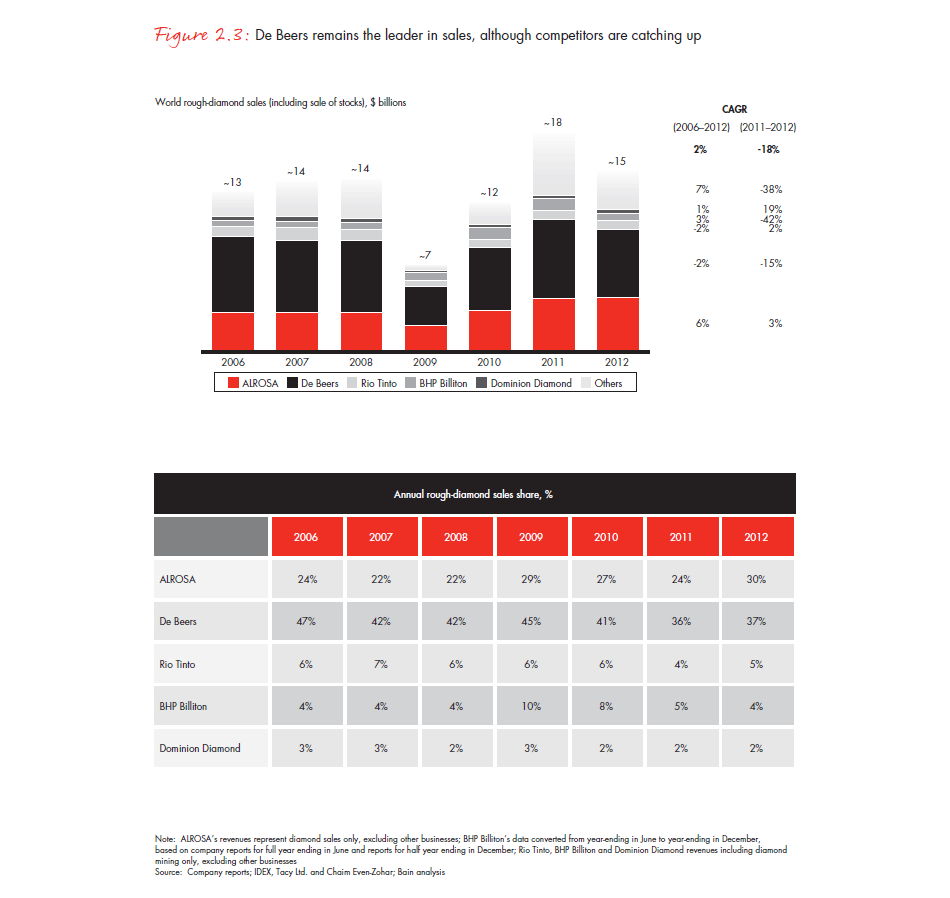
In 2012, the market remained highly concentrated, with five large players—ALROSA, BHP Billiton, De Beers, Harry Winston Diamond and Rio Tinto—generating 78% of the production sector’s revenues.
However, also in 2012, Harry Winston Diamond completed its return to pure-play mining by selling its Harry Winston retail unit to Swatch, as the mining segment generated 41% of the company’s total revenues and 76% of its profits. Consequently, Harry Winston Diamond was renamed Dominion Diamond. The reshuffling left De Beers as the sole top producer still involved in retail.
The top five became the top four when BHP Billiton exited the diamond business in 2012, selling its operations, including the Ekati mine and its diamond-marketing operation in Antwerp, to Dominion. This deal was part of a wave of mergers and acquisitions (M&A) that further concentrated mining activity among a handful of players. Anglo American consolidated its ownership of De Beers, raising its stake to 85% from 45%. Petra Diamonds announced its intention to sell its Fissures mine, and Gem Diamonds sold its Ellendale mine to Goodrich Resources, as both Petra and Gem focused on improving the quality of their diamond assets. Rio Tinto, for its part, opted to retain its diamond assets, after initially announcing plans to spin them off. All of the activity was solid evidence of a shift of focus among industry heavyweights back to pure-play mining.
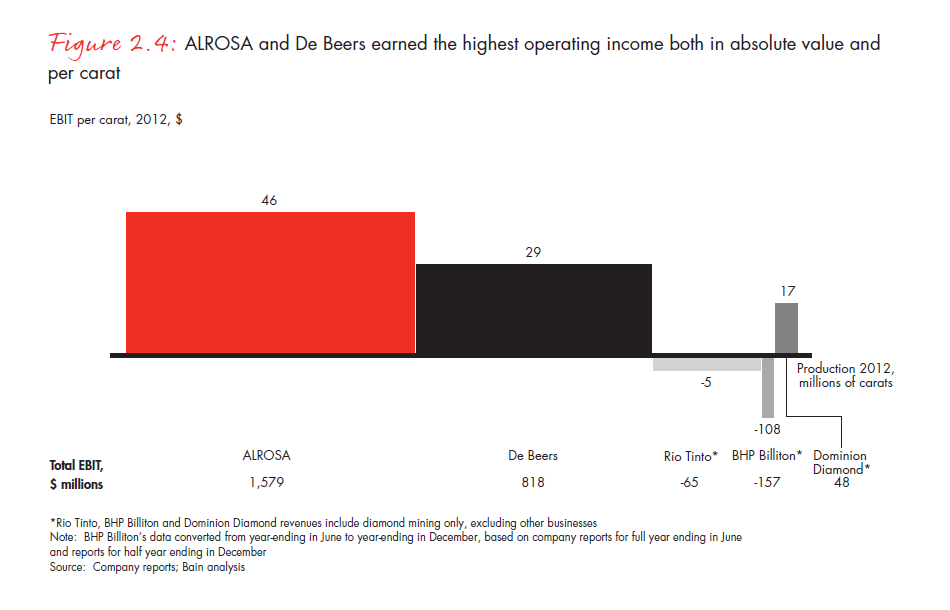
Production economics vary widely among the top producers. ALROSA remains the most profitable producer, with the largest operating-income margins per carat and in absolute value. Its 2012 operating margin of 33% represented only a slight decline from 2011’s margin and resulted in operating income of $1.6 billion, or $46 per carat. De Beers, meanwhile, remains highly profitable, with a 2012 operating margin of 13%, up from 11% in 2011, good for $800 million in operating income, or $29 per carat (see Figure 2.4).
Producers’ focus on efficiencies
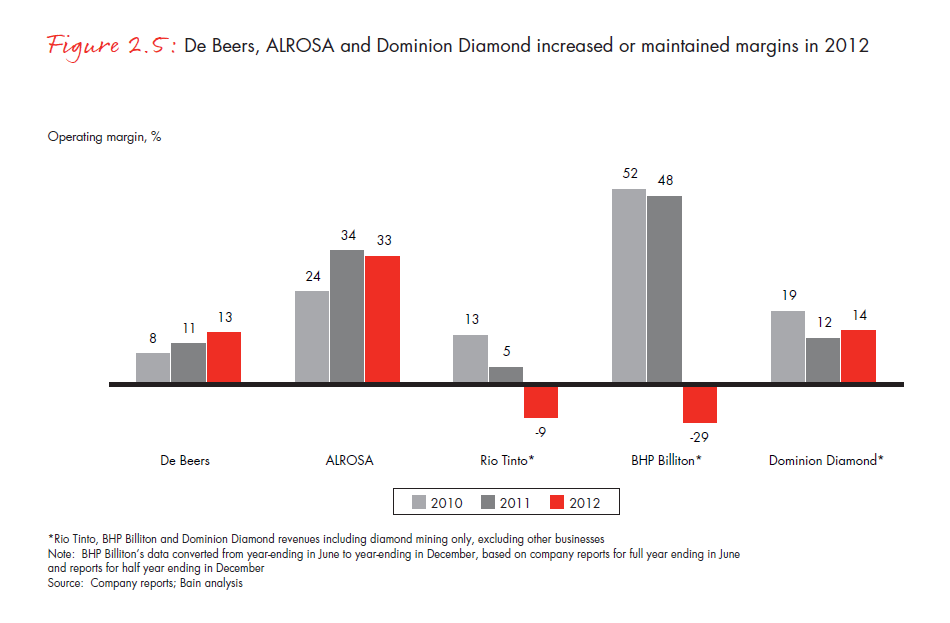
The top producers took steps to maintain or improve their profitability in 2012. ALROSA increased its number of long-term supply contracts to achieve better stability in sales. De Beers benefited from the 2011 sale of its underperforming Finsch mine. Despite a 20% drop in achieved rough-diamond prices, Dominion raised its margins to 14% from 12% in 2011 by increasing sales of rough diamonds by 49% (as measured in carats), including a large share of lower-priced diamonds from its inventories. Rio Tinto and BHP Billiton, on the other hand, saw their margins compressed in 2012. BHP Billiton, prior to exiting the industry, experienced a significant decline in the Ekati mine’s production, and Rio Tinto faced lower achieved prices for diamonds and higher depreciation of its Diavik mine (see Figure 2.5).
The importance of resources and reserves to the future of the industry
Before reviewing the global diamond industry’s resources and reserves, it may be helpful to review the industry’s classification system:
- Mineral resources are estimates based on geological evidence of a deposit and preliminary technical and economic assessments that diamonds can reasonably be extracted using economically feasible processes. Each diamond-producing country has government regulations that define how resources and reserves can be counted. Our calculations of reserves take these regulations into account.
- Mineral reserves are that portion of mineral resources whose extraction can be reasonably justified economically, at least based on the evidence provided by a preliminary feasibility study. Reserves are classified as either probable or proven, depending on the degree of geological and commercial confidence in their potential. “Proven” indicates the highest level of confidence in a deposit’s potential value.
Current levels of reserves and resources are important indicators of the industry’s long-term ability to produce diamonds. Reserves divided by current production levels indicate the number of years that the current levels of production can be sustained. At present, the industry has sufficient reserves to sustain production for 18 years.
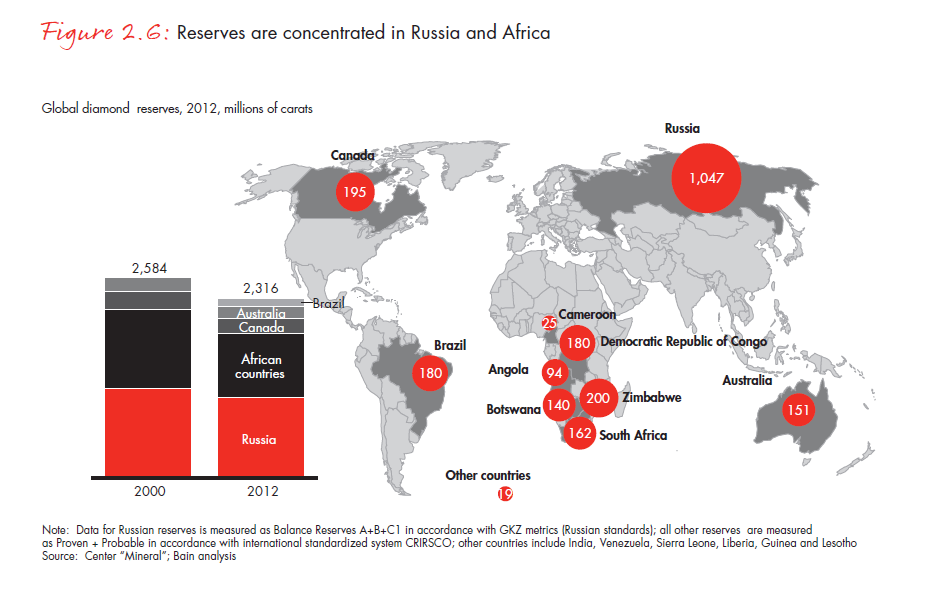
Global diamond reserves are concentrated in a handful of regions, with 70% of reserves in Africa and Russia (see Figure 2.6).
African countries account for most of the world’s diamond resources (see Figure 2.7). The true level of Africa’s reserves and resources may be even higher than indicated, because large sections of the continent that potentially hold diamonds remain unexplored.
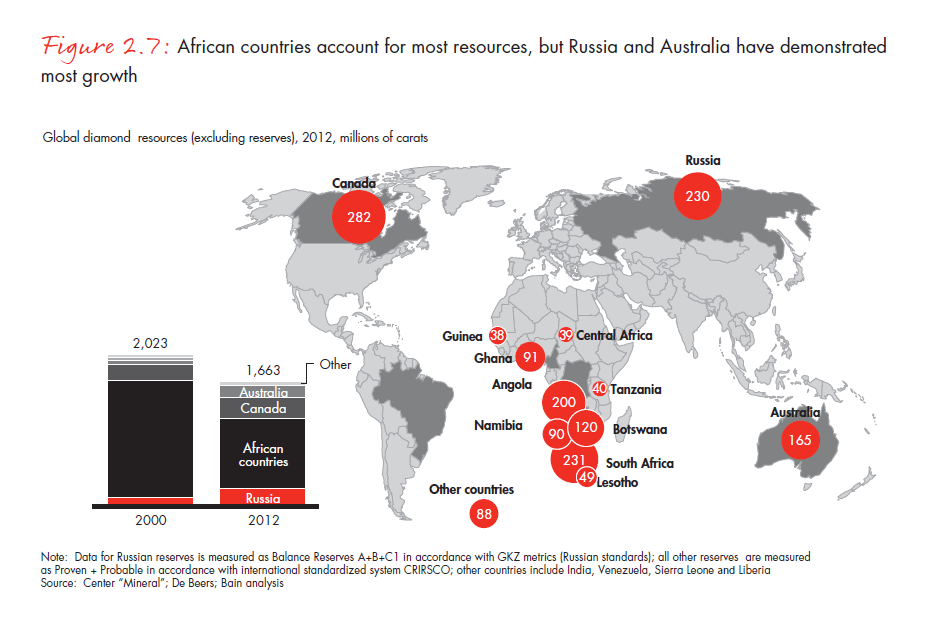
The total level of diamond reserves has remained fairly stable in recent years, at 2.3 billion carats, with total global production roughly offsetting additional reserves. The approximate balance between additional reserves and annual production implies strongly that the overall production landscape will not markedly change in the near term. However, most new reserves are incremental and of relatively lower quality than diamonds currently being extracted. The last major mine was discovered in Zimbabwe in 1997. Canada African
Key takeaways
- Rough-diamond production in 2012 increased 4% from 2011. Rough-diamond revenues fell 18% because of lower prices.
- As it has since 2009, ALROSA leads the industry in volume, producing 34.4 million carats in 2012.
- De Beers remains the leader in value terms, with $5.5 billion in 2012, although competitors such as ALROSA and Dominion Diamond are gradually catching up.
- Results for the first half of 2013 indicate that producers are on track with announced production plans.
- The diamond mining industry remains highly consolidated. The top five players generated 78% of production segment revenues in 2012.
- The top five became the top four in 2012, after BHP Billiton sold its diamond operations to Dominion Diamond and exited the business. Smaller mines also engaged in acquisitions and divestitures.
- Harry Winston Diamond sold its retail unit to Swatch, leaving De Beers as the only top player involved in retail. The remaining Harry Winston Diamond business was subsequently renamed Dominion Diamond.
- Production economics vary across players. ALROSA and De Beers remain the most profitable producers, both in absolute value and per carat.
- Russia and Africa hold 70% of diamond reserves. African countries account for most of the resources, a less definitive measure of potential deposits.
- Overall diamond reserves have held stable at approximately 2.3 billion carats during the past three years. Additions to reserves roughly equal increases in annual output.
3. Overview of the cutting and polishing market
The market for polished diamonds has yet to stabilize in the wake of the financial crisis, and although the longterm outlook remains positive, 2012 was a challenging year for the cutting and polishing industry. After growing steadily since 2006 and surpassing precrisis levels in 2011, industry revenues fell an estimated 8% in 2012, to $20.7 billion (see Figure 3.1).
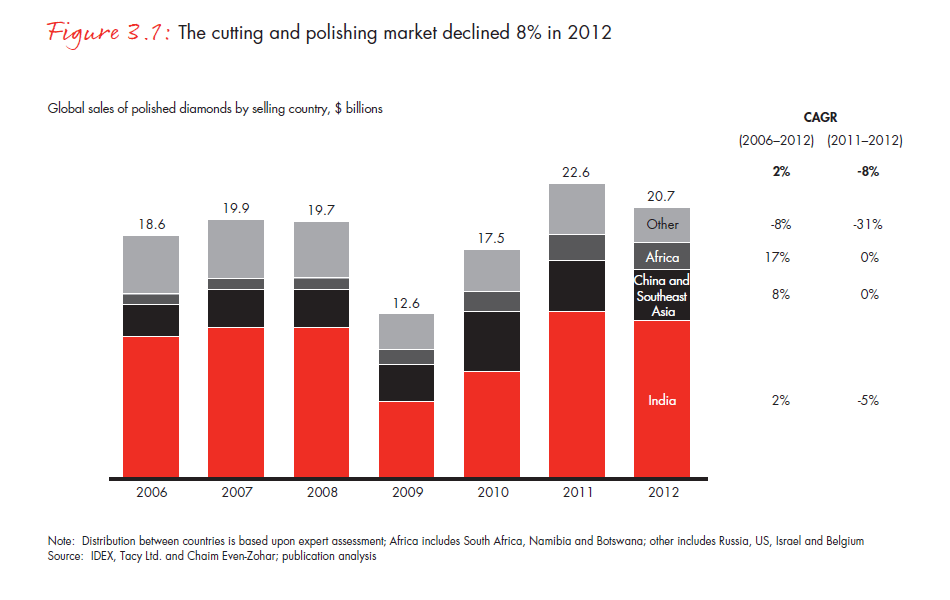
Because no public data are available, all revenue figures in this chapter are estimates.
Traditional cutting centers: Refocusing
Traditional cutting centers in Belgium, the US and Russia have reoriented their businesses to focus on highvalue stones and specialized services. Belgium, for example, has intensified its focus on the highest-value stones, supported by home-grown research and technology development. Moreover, under a new strategic plan unveiled in 2012 (Antwerp Diamond Masterplan: Diamonds Love Antwerp 2020), the Belgian diamond industry is reinforcing Antwerp’s position as a global diamond trading center and knowledge hub.
In the US, for its part, New York continues to press its advantage as the gateway to the world’s largest retail market. Russia is focusing on modernizing its cutting and polishing sector.
Growth slowdown in China and India
The Indian cutting-and-polishing market contracted by 5% in 2012, squeezed by a slowdown in domestic demand and devaluation of the rupee. Indian cutters and polishers were hit hard when the value of the rupee fell 20% in 2011 and hit all-time lows in 2012, constraining their liquidity in the rough-diamond market, which is priced in US dollars. In addition, India’s parliament imposed a new 2% duty on polished-diamond imports and higher taxes on imported gold, and India’s banks tightened their lending policies. In this environment, many smaller cutters and polishers declared bankruptcy. Larger players took the opportunity to consolidate their market positions by acquiring weaker competitors.
Following a growth spurt in recent years, 2012 cutting and polishing revenues in China were essentially unchanged from 2011, as domestic demand slowed and price competition from India reduced revenues. Local cutters got a boost, though, when Hong Kong’s Chow Tai Fook, the world’s largest vertically integrated jeweler, signed a long-term supply agreement with ALROSA to supplement earlier agreements with De Beers and Rio Tinto.
China-based cutters and polishers cater mainly to the domestic market, although a handful of Israeli, Belgian and Indian producers have set up outsourcing operations there. Most polished diamonds in China are sent to local jewelry factories and then exported to the US, the EU and the Asia-Pacific region as diamond jewelry. The Chinese cutters’ high quality-control standards have enabled them to capture a share of the lucrative market in high-grade stones from their Indian competitors, but overall, India’s lower cost basis has prevented China from more aggressively increasing its share of diamond exports.
Africa’s cutters boosting their share
In contrast to the situation in India, government policies in African countries have boosted the continent’s cutting and polishing segment. The biggest government promoter of beneficiation policies is Botswana, which has a longstanding tradition of supporting its local cutting and polishing business. For the past several years, Diamond Trading Company Botswana, a joint venture between the government of Botswana and De Beers, has been supplying rough diamonds to the local cutting and polishing industry; as a result the number of people employed in the industry has grown from 300 to 3,000. In addition, the government-owned Okavango Diamond Company will increase its share in sales of Debswana’s production from 12% in 2013 to 15% in 2016 (Debswana is a 50/50 joint venture between the Government of Botswana and De Beers). Botswana’s cutters and polishers should also gain from De Beers’s decision to move its Diamond Trading Company’s aggregation, quality-assurance and sight-preparation operations from London to Gaborone.
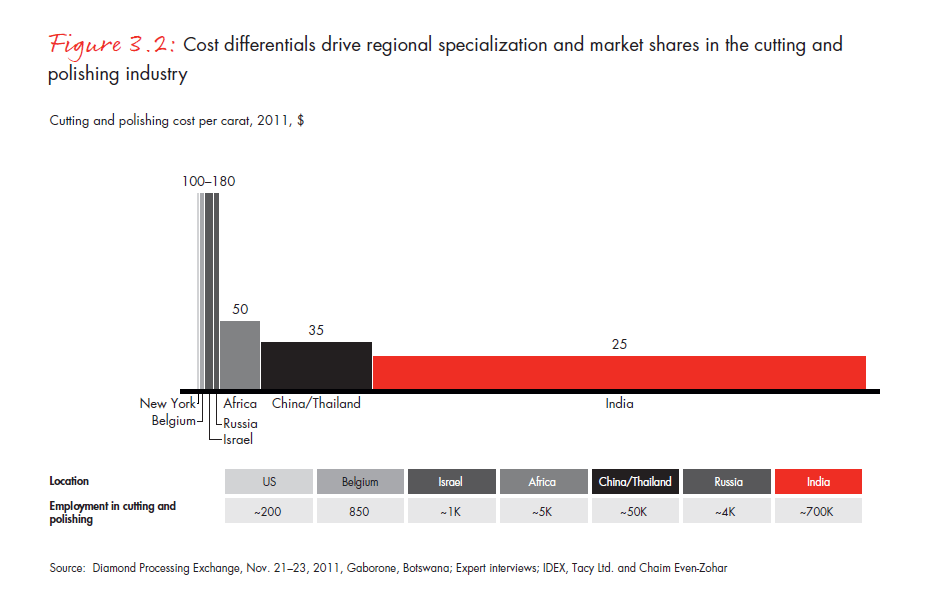
Still, Botswana’s potential to grow into a major cutting and polishing center is limited. The country’s labor costs are high compared with those of China and India, and its cutters lack expertise comparable to that of craftsmen in Europe, Israel and the US. The growth of Botswana’s cutting industry may well be limited until it is better able to compete on cost with the industry in India and China.
Regional manufacturing centers in transition
China and India continue to power growth in diamond jewelry production, with China surpassing India in production in 2011. Total jewelry production hit $127 billion in 2012, of which some $47 billion was diamond jewelry.
As China and India extended their dominance of mass-market manufacturing, the traditional centers of diamond jewelry manufacturing—Belgium, Israel and the US—continued their strategic pivot toward the highest-quality end of the market. The US and Belgian revenues from cutting and polishing decreased in 2012, with Israel claiming some of those countries’ share of the premium segment. At the same time, Belgium has remained the leader in the exceptional-stones segment (high-quality stones of more than 20 carats).
Overall, the trend in cutting and polishing is toward increasing regionalization and specialization, in response to the significant cost differences among cutting and polishing sectors. Cutting and polishing costs on average range from approximately $100 per carat in Antwerp, New York and Tel Aviv to $20 to $50 per carat in China and Thailand to $10 to $30 per carat in India. Within each category of diamonds, the various centers compete with one another on technological innovation and wages (see Figure 3.2).
Key takeaways
- After growing steadily since 2006 and surpassing pre-crisis peaks in 2011, the cutting and polishing segment of the value chain declined 8% in 2012, generating estimated revenues of $20.7 billion.
- India’s cutting and polishing sector fell 5% in 2012, as new customs duties, the falling rupee, tighter financing and overall economic uncertainty took their toll.
- China’s cutting and polishing sector posted flat growth in 2012, as domestic demand slowed and cost competition from Indian cutters squeezed revenues.
- The US and Belgium posted declines in cutting and polishing revenues, with Israel claiming some of the US and Belgian share of the premium segment. At the same time, Belgium is on track to remain the leader in the exceptional-stones segment.
- Wide differences in costs have spurred increasing specialization and regionalization in the cutting and polishing industry, while technological innovation could potentially redistribute part of the production between polishing centers in the future.
4. Diamond jewelry retailing
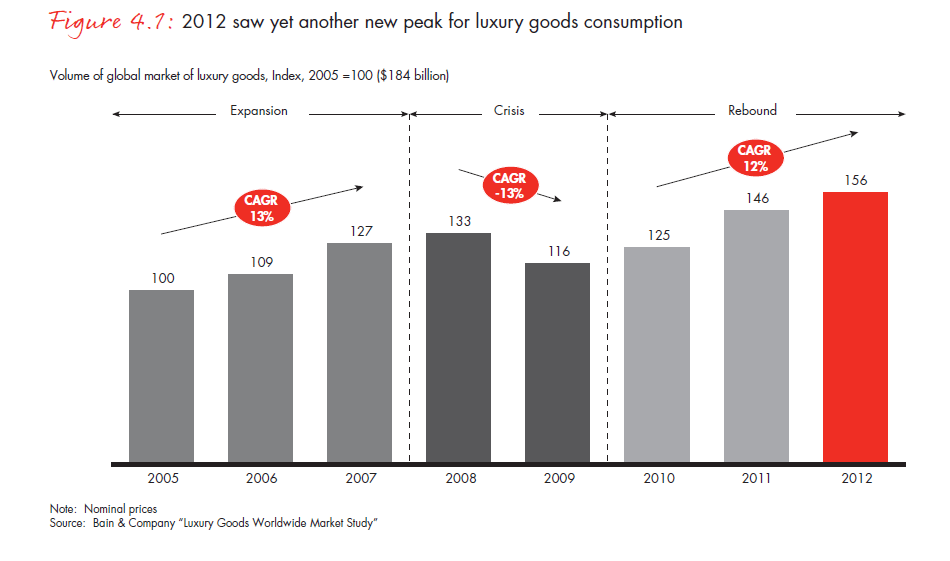
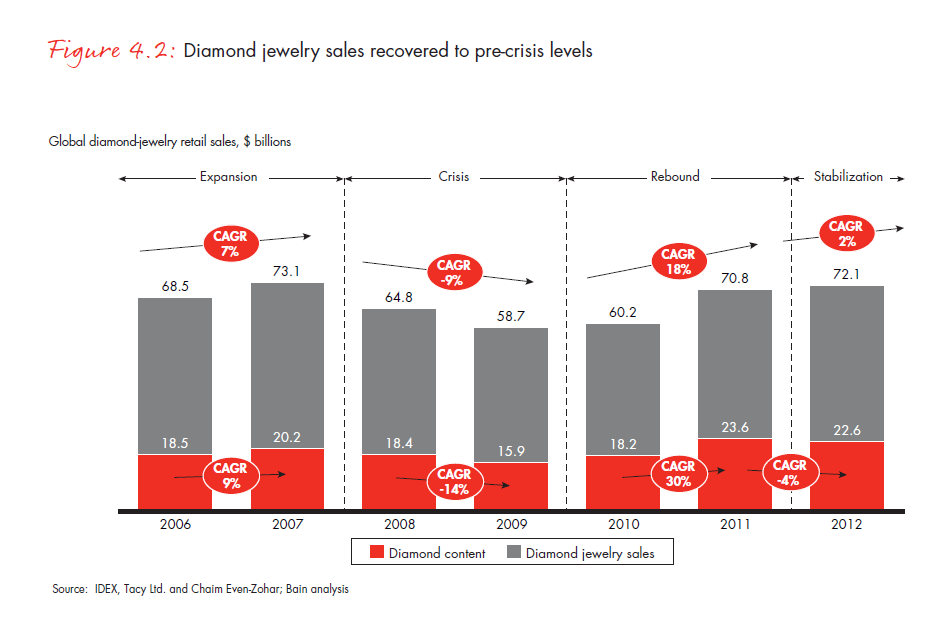
As a general rule, the diamond jewelry market closely tracks the overall luxury-goods market, and 2012 was no exception. Just as the luxury goods market has grown at a 12% compound annual rate from 2010 to 2012 and attained new peaks in 2012, diamond jewelry retailing has continued to grow despite economic uncertainty, generating $72.1 billion in revenues in 2012 and climbing back to pre-crisis levels (see Figures 4.1 and 4.2).
Continued growth of the retail sector
Although retail sales of diamond jewelry slowed in the key consumption regions of China and India, the overall retail market continued its growth in 2012, extending its recovery from the financial crisis (see Figure 4.3).
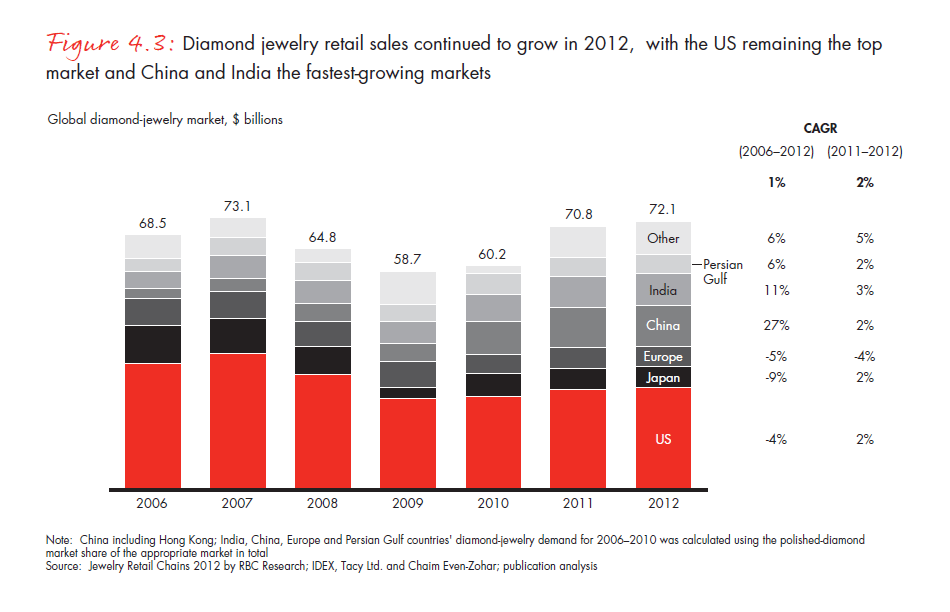
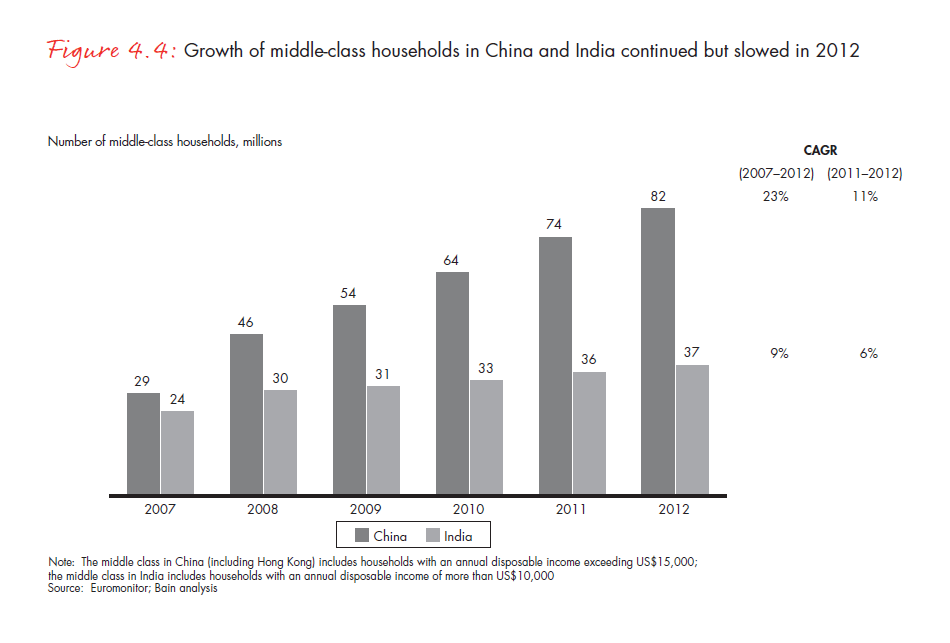
The slowdown in China and India, where revenues grew by 2% and 3%, respectively, was inevitable at some point after a long stretch of double-digit expansion. Like the retail market, middle-class growth has slowed from its earlier breakneck pace in both China and India. The middle class grew by 11% in China in 2012, after growing by 23% a year from 2007 through 2013 (compound growth rate), and by 6% in India, down from a 9% compound annual growth rate from 2007 through 2012 (see Figure 4.4).
Growth also reverted toward the mean in other regions in 2012. Sales in the Persian Gulf grew by 2% in 2012, down from a 6% compound annual growth rate from 2006 through 2012. Japan’s growth fell to 2% in 2012 after growing at a 26% compound annual rate from 2009 to 2012, and growth in the European Union fell 4% from 2011. Europe’s decline was cushioned by diamond jewelry purchases by affluent tourists from Asia and the Middle East. In the US, retail sales continued to grow in line with the overall economy, which is showing signs of increasing strength. The US remains the world’s largest diamond-jewelry market by a comfortable margin.
Key takeaways
- The diamond jewelry market typically follows overall trends in luxury goods, and the global luxury-goods market has been growing steadily at approximately 12% annually during the past three years.
- Diamond jewelry retail sales continued to grow in 2012 despite economic uncertainties.
- China and India, the dynamos of the diamond market’s growth in recent years, continue to grow, but the pace of their growth has slowed. Year-over-year growth rates dropped to 2% in China in 2012 and 3% in India in 2012.
- Sales growth in the Persian Gulf slowed to 2% in 2012, compared with 6% annually from 2006 through 2012.
- Japan’s diamond-jewelry sales grew 2% in 2012 compared with 26% annual growth from 2009 through 2012.
- The European Union continued its decline, with 2012 diamond-jewelry retail revenues falling 4% from 2011. The fall was cushioned by sales to affluent Asian and Middle Eastern tourists shopping in Europe.
- The U.S. retail market’s growth remained in line with the economy’s overall expansion.
5. The route to market: From mine to jewelry counter
Winding path from mine to jewelry counter
The history of the diamond trade goes back 1,000 years or more, and many of the market’s traditional practices have changed surprisingly little since the days when merchants transported diamonds out of India and across Arabia on their way to Europe’s capital cities. Of course, the extraction technology has improved considerably, and today more and more sorting and grading are done by machine. And trade routes have changed, as have the means of transportation.
But the diamond market, from the mine to the jewelry store display case, still relies on the human touch. It takes skilled hands and eyes to assess the quality and value of individual diamonds, and much of the work of cutting and polishing still goes on in small, family-owned workshops where craftspeople apply a lifetime’s experience to transform dull and dirty stones into glittering gems.
Today, most mining companies are publicly owned and closely scrutinized by investors and certifying bodies, and their practices and finances are largely a matter of public record. The same holds true for retailers, whose ways of doing business are apparent to anyone who visits their showrooms. But diamonds pass through many hands on their way from the mine to the shop.
Until now, the activities of the players in the middle of the value chain have received little attention, and the practices and economics of their businesses are opaque even to other members of the diamond trade. That is why we have chosen to include a focus on the diamond value chain in the 2013 edition of our report on the global diamond market.
The value chain’s three stages
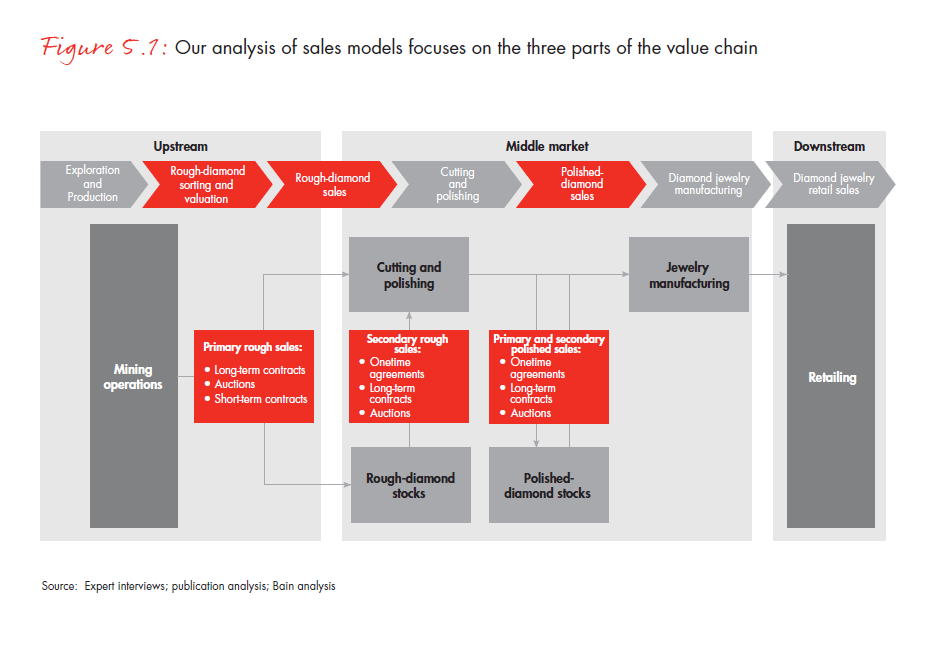
Before a diamond reaches the young couple buying a ring to mark their engagement or the husband presenting his wife with a necklace on their tenth anniversary, it passes through four to eight sets of hands and three distinct stages. At the upstream stage, the diamond is mined from the ground, sorted and sold by the producer. At that point, the diamond reaches the middle-market stage, where it’s cut, polished and assembled into jewelry. The diamond then moves to the downstream stage, where it’s sold to the end customer (see Figure 5.1).
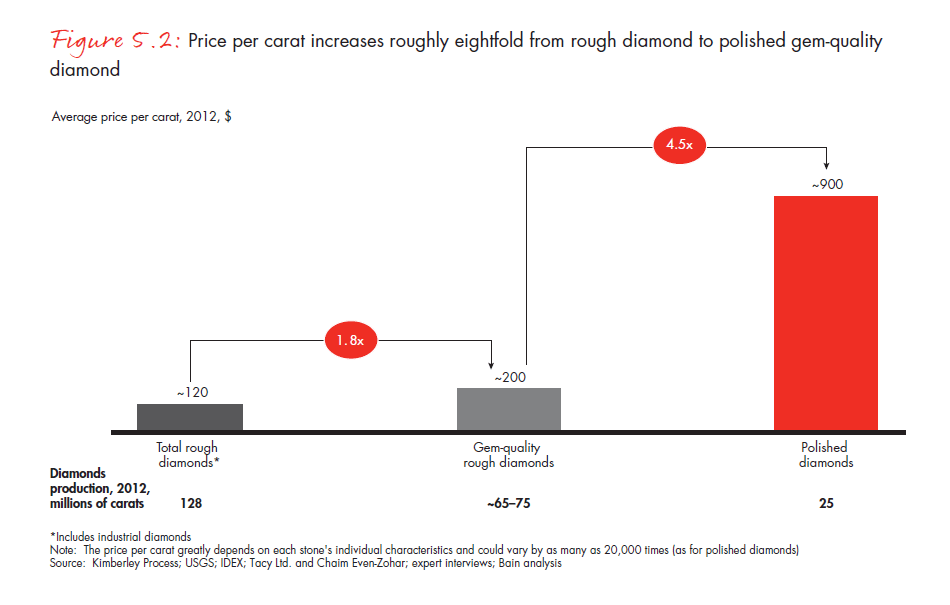
As the diamonds pass through the three stages, the price per carat is constantly increasing, multiplying eightfold or more by the time a diamond is sold at retail (see Figure 5.2).
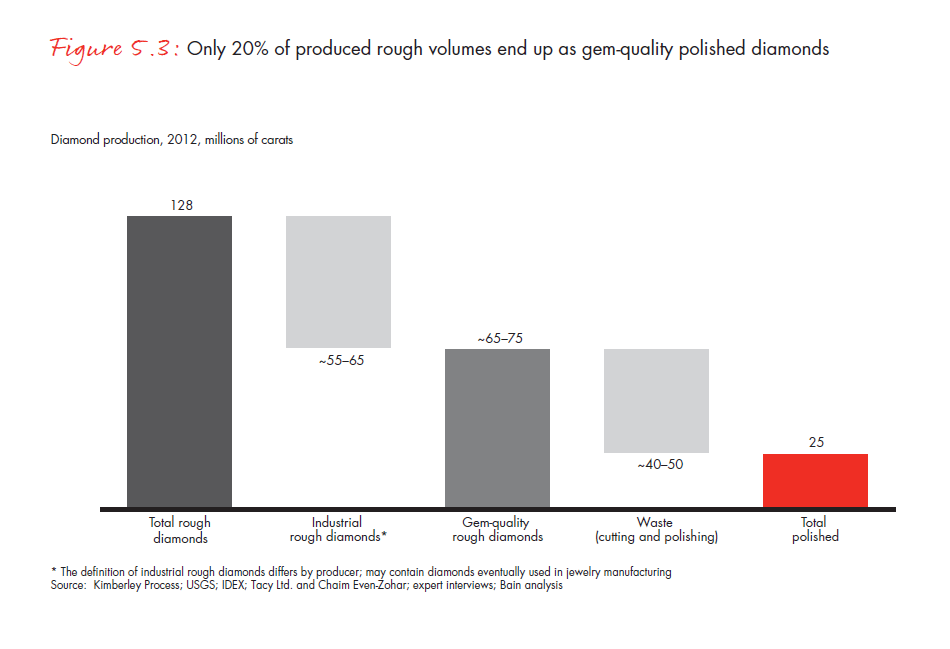
Production waste accounts for much of the rise in value. Fully 5 carats in rough diamonds must be mined to produce 1 carat of diamond content in a piece of jewelry. Nearly half of the original five carats—2.3 carats—are separated out as industrial diamonds (i.e., diamonds that are not of gem quality), and 1.7 carats are lost in cutting and polishing (see Figure 5.3). In the following chapters, we will look more closely at the diamond’s passage through the value chain.
6. The upstream: An overview
Sorting fundamentals
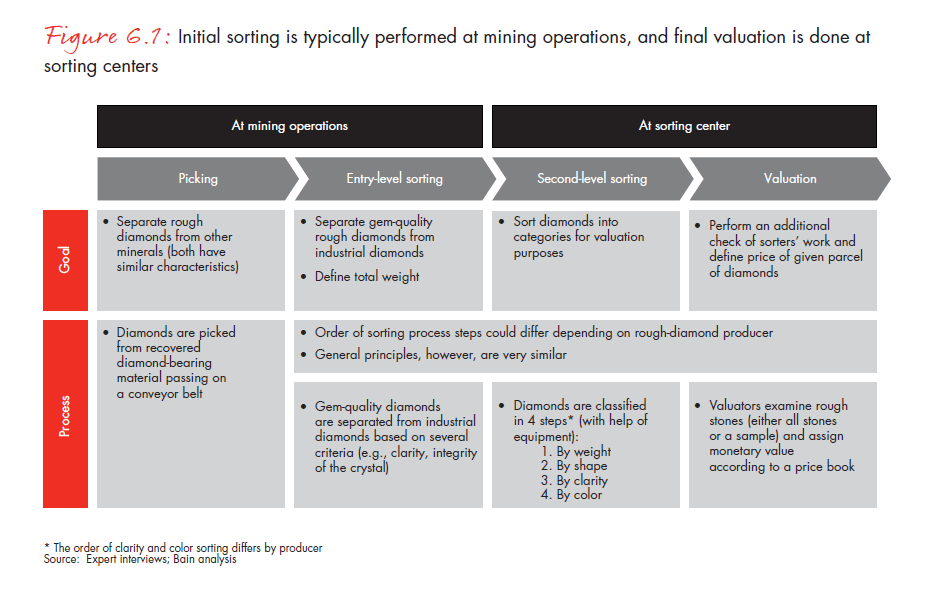
The value-add process begins when a diamond is first sorted after being mined. The overall objective of sorting is to identify, as precisely as possible, the value of mined diamonds and package them for sale. Because rough diamonds vary widely in quality and therefore price, it’s important to gauge a stone’s appropriate value at the sorting stage. The sorting is conducted in four discrete steps in two different locations. Picking and entry-level sorting take place at the site of the mining operation, and then, at a separate location, the second-level sorting and valuation are performed (see Figure 6.1).
Historically, experienced sorters have performed these operations manually, with little help from advanced technology. Today, though, technology has improved to the point where much of the sorting process can be automated. But whether the sorting is done by hand or machine, it’s a crucial step with a significant impact on the implied value of mined diamonds.
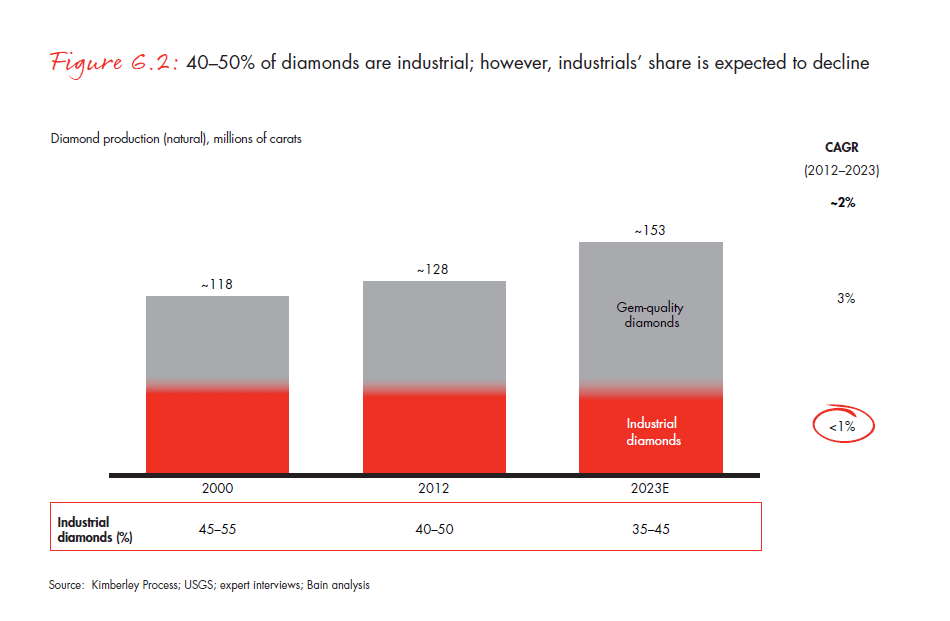
At entry-level sorting, gem-quality diamonds—that is, rough diamonds of sufficient quality to be used in jewelry— are separated from industrial stones (including those known as bort), which typically aren’t suitable for use in jewelry. Industrials’ share of rough-diamond production has declined in the past ten years and is expected to decline further, from 45–55% of production in 2000 to 35–45% in 2023. Technological advances are behind the drop in industrial-diamond production. New equipment enables industry players to cut and polish very small stones once classified as industrial and render them suitable for use in jewelry. The supply of natural industrial diamonds is expected to grow very little in absolute terms, increasing at a less than 1% compound annual rate through 2023 (see Figure 6.2).
Diamond-mining companies have a strong motivation to increase their yields of gem-quality stones, because the price of gem-quality stones has increased faster than that of industrial diamonds, motivating producers to cut and polish stones that were once graded as industrial because they were considered too small for use in jewelry. New sorting and polishing technologies have enabled producers to boost revenues.
After the gem-quality stones have been sorted from the industrials, both types of diamond are transported to sorting centers. In recent years, however, a number of sorting operations have been moved to diamond-producing countries, in compliance with beneficiation requirements. De Beers, for example, is currently in the process of relocating its sorting center to Gaborone, Botswana (see Figure 6.3).
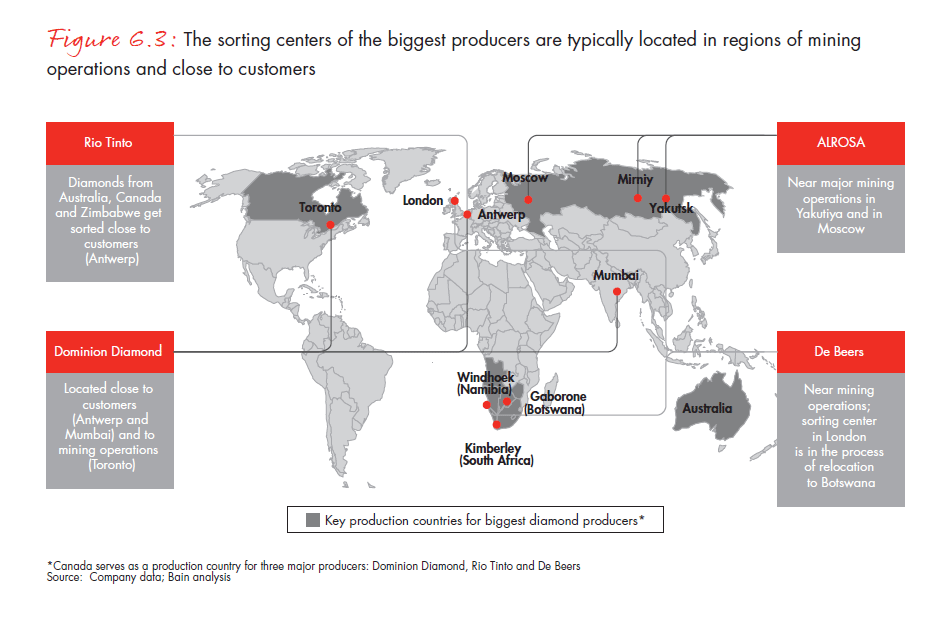
At the same time, other diamond hubs are moving into major consuming regions or capitalizing on their proximity to them. For example, New York, the gateway to the world’s largest retail market, has diminished its presence in the rough-diamond market in recent years, focusing instead on serving the local retail industry and recutting and repolishing recycled diamonds. Mumbai, on the other hand, has grown rapidly as a diamond hub on the strength of its proximity to the world’s largest cutting and polishing market.
At the sorting centers, gem-quality diamonds go through a second round of grading and are sorted according to four grading criteria: weight, shape, clarity and color (see Figure 6.4).
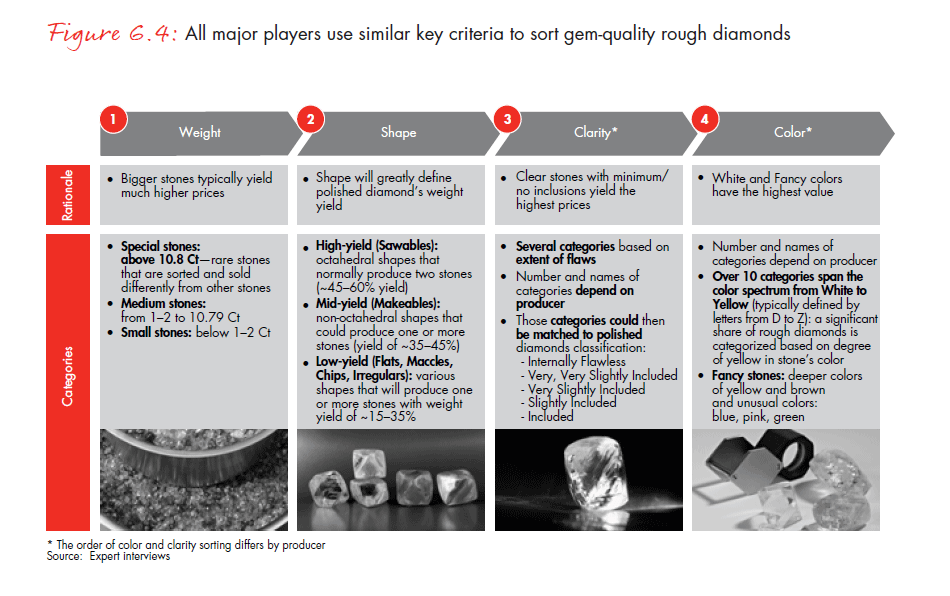
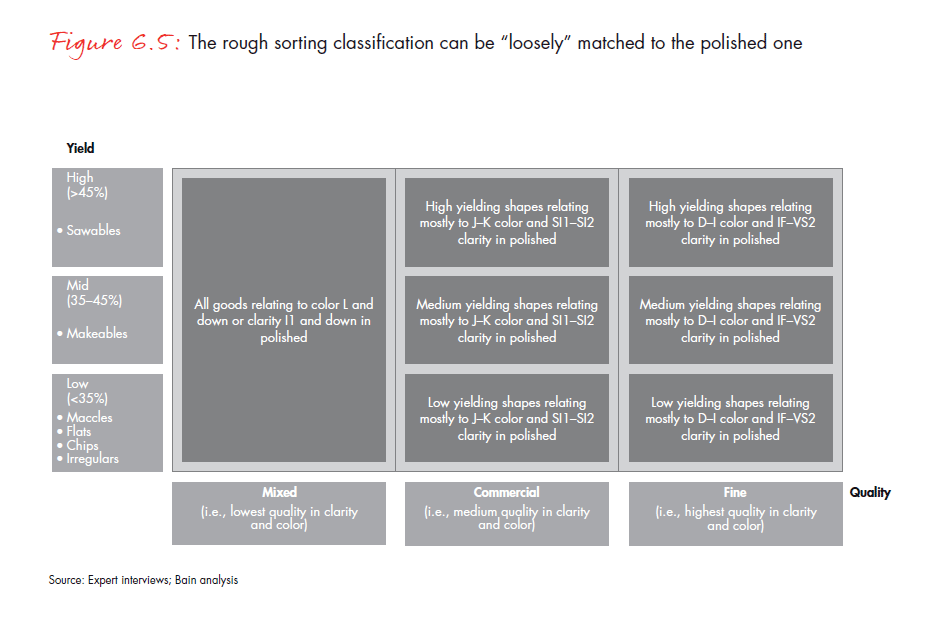
Many of the sorting judgments at this stage were once made manually—and therefore subjectively—but recent technological advances have made it possible to sort more accurately and effectively than humans alone can achieve. Automatic industrial sieves, for example, have improved the weighing process, while newly developed automatic sorters can separate stones by shape. Clarity and color remain the most challenging grading criteria to automate, but new equipment is under development, though it has not been widely adopted by the diamond industry. After second-level sorting and valuation, rough stones can be grouped into categories based on yield, color and clarity that loosely match their grade as polished diamonds The diamonds are now ready to enter the sales channel (see Figure 6.5). (For polished-diamonds classification, please refer to Figure 7.7.)
Overview of sales channels
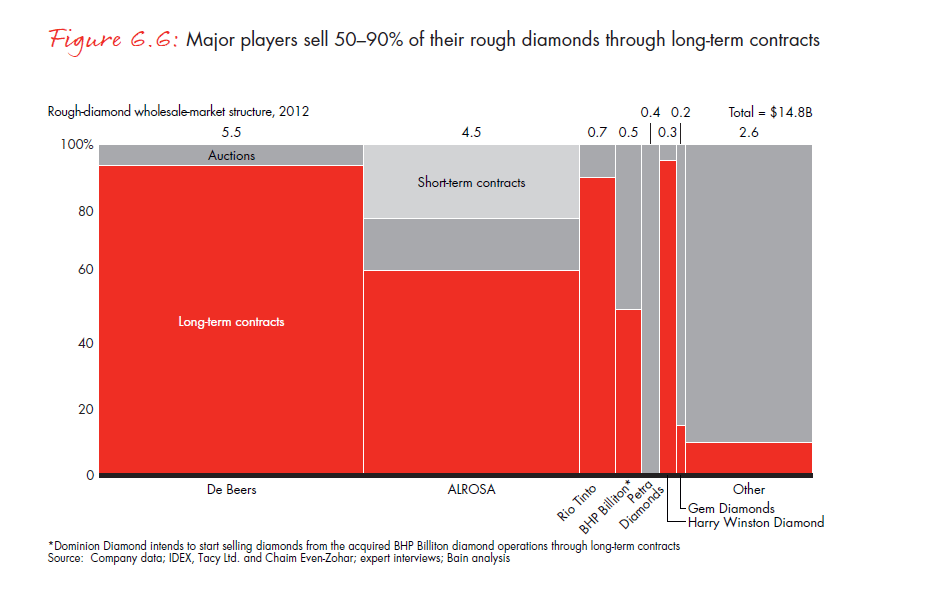
For decades, the majority of the world’s diamonds were sold through the De Beers–controlled Central Selling Organization (which no longer exists). They were sold under long-term contracts to a select group of customers. As the market has been liberalized and more producers have sold their output outside the Central Selling Organization, new sales channels have emerged. Long-term contracts remain an important channel for major producers, accounting for about 65% of rough-diamond sales, but auctions have significantly increased their share, to about 30% of rough-diamond sales. The remaining 5% or so is sold under short-term contracts— onetime agreements to sell stones that fall outside the typical range or have not been purchased under long-term contracts or through auction (see Figure 6.6).
Sales channels: Long-term contracts
Long-term contracts, the rough-diamond market’s primary sales channel, have an enduring appeal, especially for major rough-diamond producers, whose business models require large sales volumes, predictable output levels and price stability. Indeed, predictability is a key attribute of the contracts. They enable producers to judge precisely how much volume each customer intends to purchase over the term of a contract. They also help control price volatility, because prices under long-term contracts fluctuate less widely than auction prices. In addition, long-term contracts enable producers to sell large volumes of rough diamonds in a relatively short amount of time, compared with the more protracted auction process.
Long-term customers also benefit from long-term contracts. Merely becoming a long-term customer is a distinction in itself, reserved for buyers that meet a producer’s rigorous due-diligence requirements. Admission into the select company of long-term buyers is not only prestigious, though—it can also help buyers qualify for working-capital financing from diamond banks.
Each contract sale goes through five steps (see Figure 6.7).
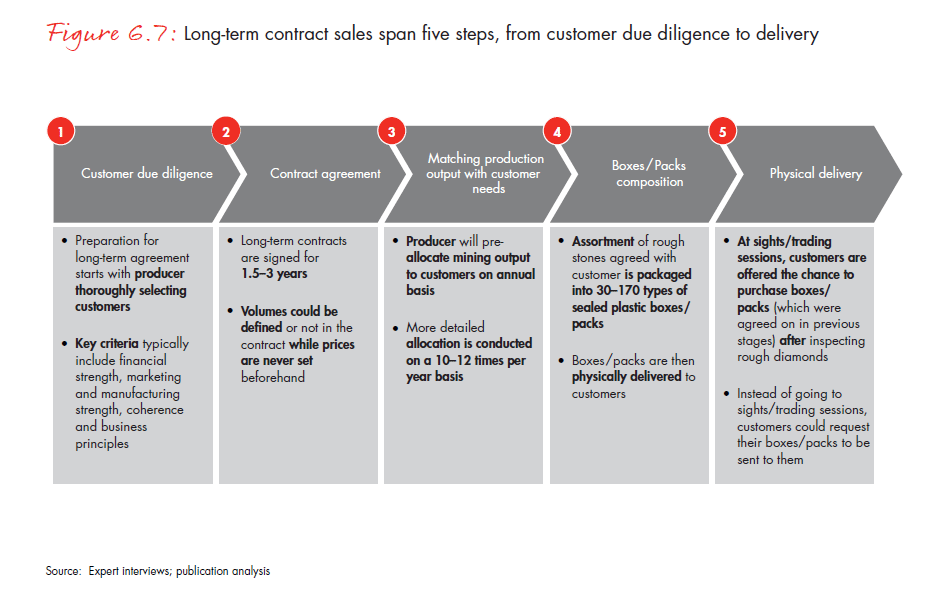
The first step is the producer’s due-diligence examination of the customer. Only buyers with demonstrated financial stability, market presence, manufacturing and operational strength and legal compliance can qualify for long-term agreements. Once a prospective buyer is admitted as a long-term customer, it negotiates a contract with the producer. Contracts come in two different forms:
- Fixed-volume contracts commit the producer to sell volumes specified by the contract for a pre-agreed term (normally two to three years).
- Contracts with no fixed volume specify only the duration of the agreement.
Once a contract agreement is reached, the producer then matches a share of its output to the customer’s requirements and prepares boxes or packs of diamonds to fulfill the contract. This is a complex process, because while most customers are willing to buy as many rough diamonds as possible, producers have only a limited amount of output and must allocate it among several customers. Therefore, the rough-diamond producer must first estimate its output, identify customer requirements, match the output to the customer’s requirements and then communicate the outcome to the customer.
In the fourth step, the producer prepares boxes or packs of rough diamonds of similar size for each customer. Producers prepare anywhere from 30 to 170 varieties of boxes.
The final step is the physical delivery of the diamonds, which can take two different forms. Most boxes or packs are delivered to customers at events called sights, usually held at sorting centers, where customers can inspect the stones and choose to accept or reject the entire box (see Figure 6.8). Producers often allow some degree of negotiating over the larger stones in a box (usually diamonds of 2 carats or more).
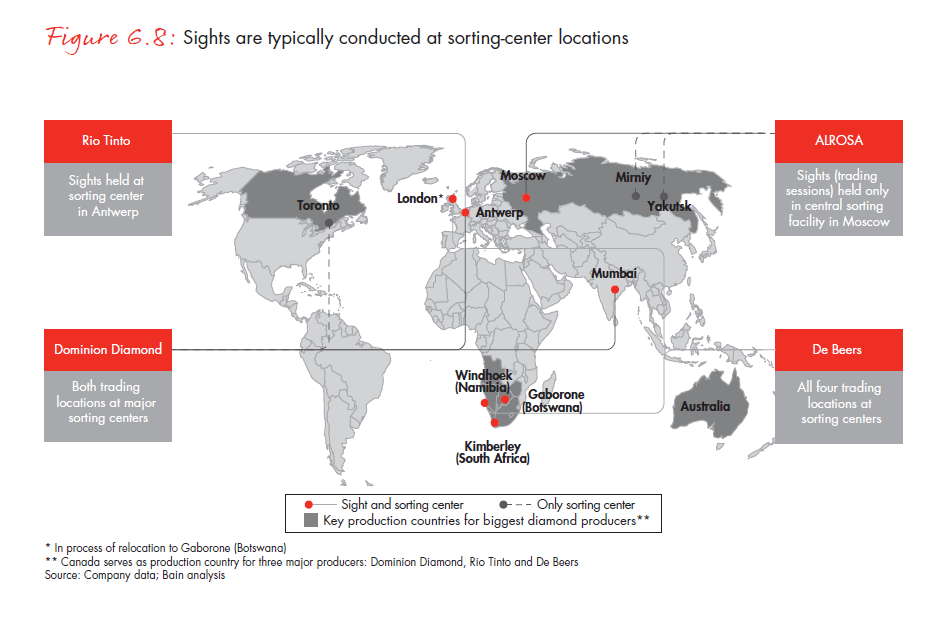
Some customers, unable or unwilling to travel, sometimes ask producers to deliver boxes to their offices. Of course, the customer must have faith in the producer’s sorting abilities, because in such cases, customers are obliged to purchase the box without further negotiation.
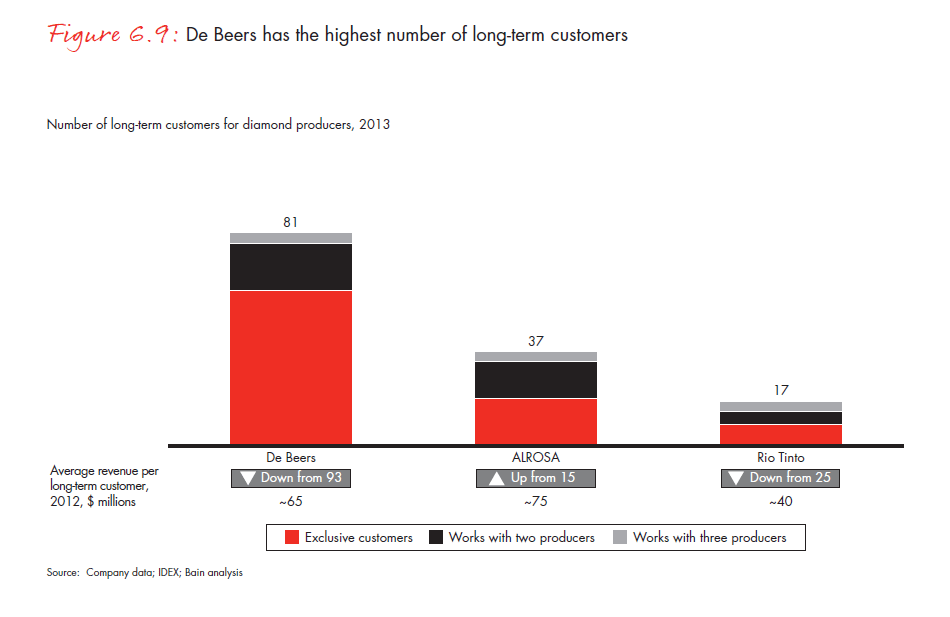
There is wide variation in the amount of rough output sold through long-term contracts. De Beers has historically had the largest number of long-term buyers (over 300 in the 1970s), but that number has been decreasing over the years and is now down from 93 as of 2006 to 81. ALROSA has historically relied less on long-term contracts but in recent years has worked to build up that channel. The company had 37 long-term contract holders as of the end of 2012, a number that has been increasing over the last few years (see Figure 6.9).
Sales channels: Auctions (closed bid and live)
The majority of rough diamonds sold through auctions are offered by smaller producers. They prefer the channel because they’re able to maximize their selling prices when the market for rough diamonds is strong. When the market turns negative, however, auction sellers risk significant losses. The unpredictability of auction results is the major drawback of the auction sales channel.
Despite the volatility risk, many producers find auctions useful for other reasons. They’re a good source of market intelligence, providing real-time and reliable pricing information that can be used to adjust the pricing of longterm contracts. And some producers use auctions to “audition” potential long-term customers. Auctions also enable producers to establish a market price for stones of exceptional size or quality. And because auctions require fewer key account managers and other sales personnel, they enable producers to control their selling costs.
Many customers also benefit from auctions. For one thing, buyers gain access to rough diamonds without having to undergo the strict due-diligence review associated with long-term contracts. Auctions also enable buyers to assemble portfolios of diamonds that precisely meet their customers’ requirements.
But these advantages come with significant drawbacks for buyers and sellers. Auctions, with their drawn-out viewing schedules and bidding process, represent a sizable time investment for producers, given that it can take 10 days or more to sell their lots. For producers with volumes of $100 million or more to sell, the protracted process can be extremely costly. At the same time, customers risk overpaying for stones when several buyers are vying for the same lot, and with no volume guarantee, buyers are at risk of failing to fulfill customer orders.
Auctions take two different forms:
- In closed auctions, customers are physically present at the auction venue and submit single, closed bids for selected boxes.
- During live online auctions, participants submit bids online and go through multiple rounds of bidding.
Each producer follows a different auction strategy. BHP Billiton’s sales model called for it to sell even its longterm supply of rough diamonds through auctions—a winning strategy during the mid-2000s, when rough prices were on a sustained upward path. Since purchasing BHP Billiton’s diamond assets in 2012, however, Dominion Diamond has announced that it plans to sell the output of those assets through long-term contracts, the company’s predominant sales channel.
De Beers, on the other hand, has historically sold most of its production through long-term contracts. But in recent years, De Beers has sold up to 10% of its output at online auctions held by its auction unit, Diamdel.
Sales channels: Short-term contracts
Every producer’s output includes some share of diamonds that can be termed “odd lots”—stones that aren’t suitable for boxes made up for long-term customers, those that fall outside the typical size range or those that for one reason or other aren’t sold through either long-term contracts or auctions. Those stones are sold instead through short-term agreements. The diamonds are grouped into parcels that a select group of customers, usually holders of long-term contracts or customers regularly purchasing through short-term contracts, are invited to view. After examination, customers enter into price negotiations with sellers, and when a price is agreed, the parcel changes hands.
Few large producers make extensive use of this sales channel, typically selling 1% or less of their rough output through this route. The one exception is ALROSA, which sells about 20% of its output through short-term agreements, though ALROSA is increasing the number of long-term contracts with clients tested through shortterm sales.
Pricing considerations
Whether they sell their output through long-term contract, auction or short-term agreement, rough-diamond producers face a key challenge when pricing their production. Prices directly affect producers’ profitability, so they have a compelling motivation to realize the highest possible price. But as we have already noted, there is a large subjective element to diamond pricing, and market intelligence is always imperfect to some degree. As a result, producers must rely on five key inputs to realize the optimal price for their inventory. They must gauge the supply-demand balance, the availability of financing, the mix of rough diamonds in their stocks, the price information gleaned from auctions and the pricing trend further along the value chain, in the midmarket and at retail. Each producer weights those inputs differently, resulting in large variations in the prices of comparable stones.
Key takeaways
- Rough diamonds’ route to market starts with sorting to separate gem-quality from industrial diamonds and assess the value of both categories. Gem-quality diamonds are then sorted by weight, shape, clarity and color. These criteria, of which there are up to 12,000 possible combinations, allow producers to classify and evaluate the diamonds. The produced diamonds are then packaged for sale.
- Recent technological advances have significantly improved the efficiency and accuracy of sorting. The technology is advancing at such a rate that it could soon be possible to fully automate the evaluation of diamonds along all four key criteria.
- Once they have sorted their rough output, producers sell it through three sales channels: long-term contracts, auctions and short-term contracts.
- The most widely used sales channel is the long-term contract, which accounts for about 65% of rough sales. Most large producers prefer long-term contracts because they provide price stability and enable producers to ascertain in advance the volume requirements and assortment of stones they’re expected to produce.
- Auctions, which account for about 30% of rough-diamond sales, are the preferred channel of smaller producers. The larger producers use auctions to test market pricing and sell unique stones, selling 10–20% of their output through this channel.
- Short-term contracts are mainly used to sell leftovers or stones that fall outside the typical size range. Most large producers sell less than 1% of their rough-diamond output through this channel, with the exception of ALROSA, which sells about 20% of its production through short-term agreements.
- Producers are not expected to significantly shift their methods for selling their rough diamonds. The major companies have stabilized their models and have announced no plans to change them. Smaller producers are unlikely to shift to the long-term contract model because of the large infrastructure investments the model requires.
7. The middle market: An overview
The middle market is the most complex segment of the value chain, encompassing an extensive range of activities that begin with the sale of rough diamonds and continue until the diamonds, in the form of jewelry, reach the retail stage, which is the downstream component of the three-part value chain (see Figure 7.1).
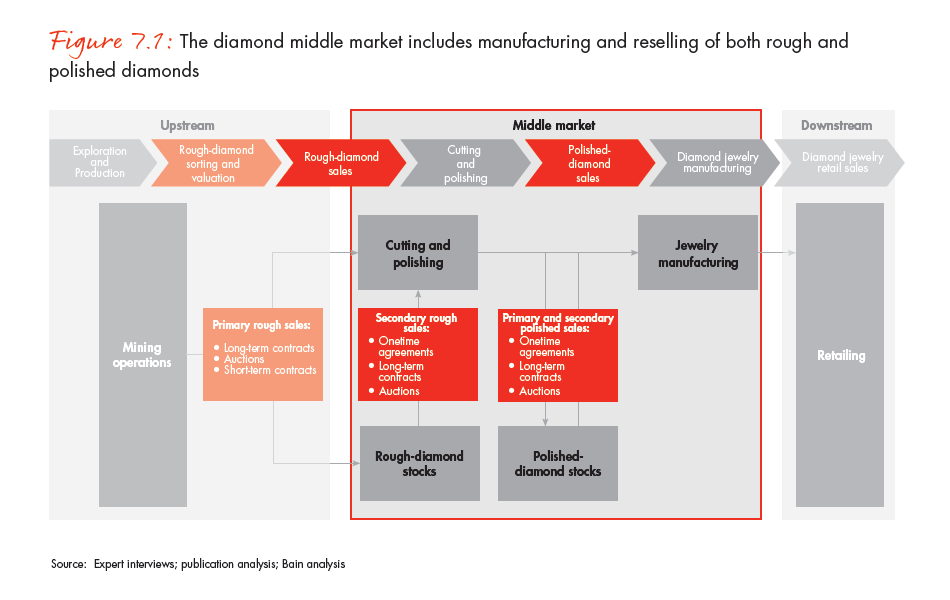
Most of those activities can be roughly grouped into one of four categories: cutting and polishing, dealing in polished diamonds, jewelry manufacturing and diversified operations along the value chain (see Figure 7.2).
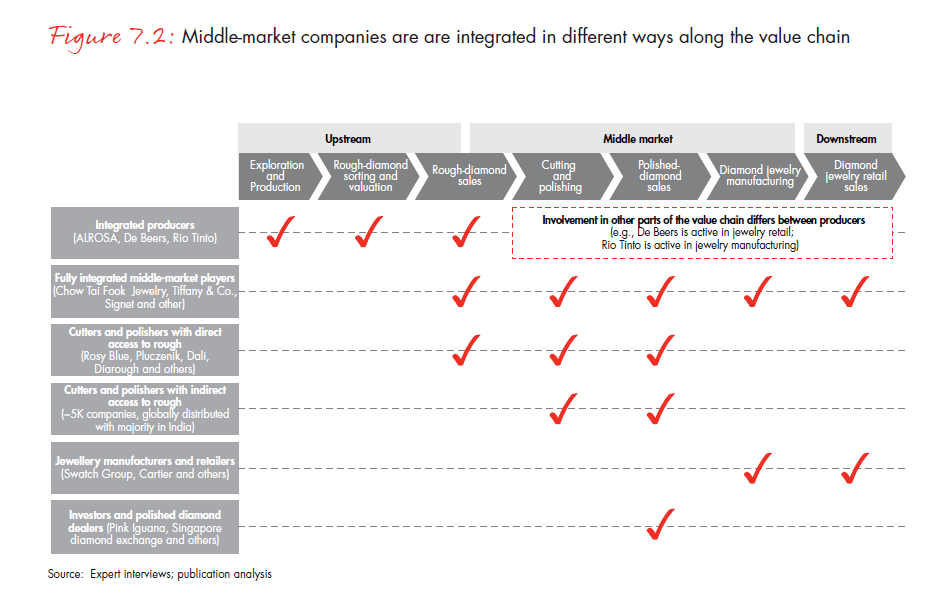
The middle-market stage includes the secondary sales of rough diamonds by large cutters and polishers with direct access to rough diamonds. Large outfits that primarily engage in dealing typically sell 30–70% of their rough holdings to smaller cutters and polishers. Large companies that primarily engage in cutting and polishing might sell 10–20%.
At the heart of the middle market are cutters and polishers. Their challenge is to define the appropriate cut and weight of each stone, balancing their return on investment with their required turnaround time. Despite technological improvements, more than 50% of each stone’s original weight is lost in the cutting and polishing process.
Once a diamond is cut and polished, it may be resold multiple times to dealers or investors. Eventually, most cut and polished diamonds end up downstream, in jewelry for retail sale.
In addition to encompassing a range of diamond-related businesses, the middle-market segment is also highly fragmented, with more than 5,000 players competing at different activities. The top 50 players, with annual revenues ranging from $100 million to $900 million, account for about half of industry sales. With profit margins of approximately 6–8%, they usually handle diamonds of every size, shape and color. The typical large player has been in the diamond business for 30 years or more and is vertically integrated along the value chain and geographically diversified, with offices or factories in 5 to 10 countries.
The remaining players are typically small, family-owned operations, located primarily in India or China and doing less than $10 million in annual turnover (see Figure 7.3).
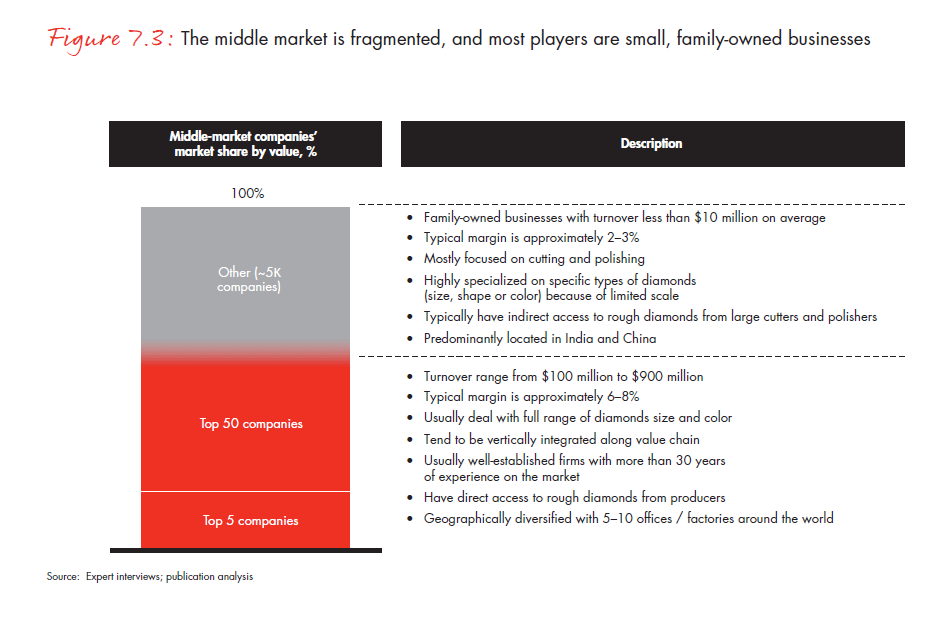
With margins of approximately 2–3%, these smaller players are concentrated in the cutting and polishing segment. With their limited scale, most of the smaller shops specialize in diamonds of a particular shape, size or color. They source much of their rough-diamond supply from larger cutting and polishing companies.
Overview of sales channels
Like the upstream market for rough diamonds, the middle market for both rough and polished diamonds has three primary sales channels: long-term contracts, auctions and short-term (or onetime) contracts. The proportion of output that goes into each channel is very different from what is seen in the primary market, however.
About 90% of secondary sales in the middle market are done through onetime agreements. Few of those agreements are documented in writing—most buyers and sellers have longstanding relationships based on mutual trust. Accordingly, potential buyers of rough or polished diamonds must clear high barriers to entry, joining the circle of players only on the strength of references from one or more companies that are already members of the club.
Buyers usually specify the volume of diamonds they seek to purchase. Their price is a function of the relationship between the buyer and seller and the volume being transacted. The transactions are usually conducted in diamond hubs, where both rough and polished stones change hands, or through online exchanges, which primarily handle polished diamonds. The pricing mechanism differs depending on whether rough or polished diamonds are changing hands. The seller sets the price for rough diamonds and typically seeks a profit margin of 7–15%, higher than the margins for either manufacturing or dealing alone. Polished diamonds are priced according to the dealer’s price list, with discounts or premiums a matter for negotiation.
Unlike in the upstream market for rough diamonds, long-term contracts are relatively rare in the middle market, accounting for only about 5% of sales. Long-term contracts are rarely used because secondary dealers, unlike rough-diamond producers, cannot guarantee a fixed supply of specific diamonds. Many informal arrangements, however, tend to exist with primary dealers.
Auctions likewise account for about 5% of secondary and polished-diamond sales. Unlike rough-diamond sales in the upstream market, where both standard-size stones and outliers change hands, middle-market auctions are mostly limited to large, unique polished stones. Some auctions are devoted exclusively to diamonds; others include other luxury items. Because they attract significant attention from the media, the auctions have a considerable influence on prices and consumer preferences.
Key points of sale
Diamond hubs. As their name implies, diamond hubs aggregate a variety of industry activities in a single venue and typically include diamond-trading centers as well as dealers and the sales offices of cutting and polishing companies. Trading centers usually provide facilities for dealers as well as services such as transportation, insurance and visa assistance and are used mostly for short-term trading. Direct trading of rough and polished diamonds between a buyer and seller takes place in sales offices.
There are six major diamond hubs: the traditional hubs of Antwerp, New York and Tel Aviv and the newly emergent hubs of Dubai, Hong Kong and Mumbai (see Figure 7.4).
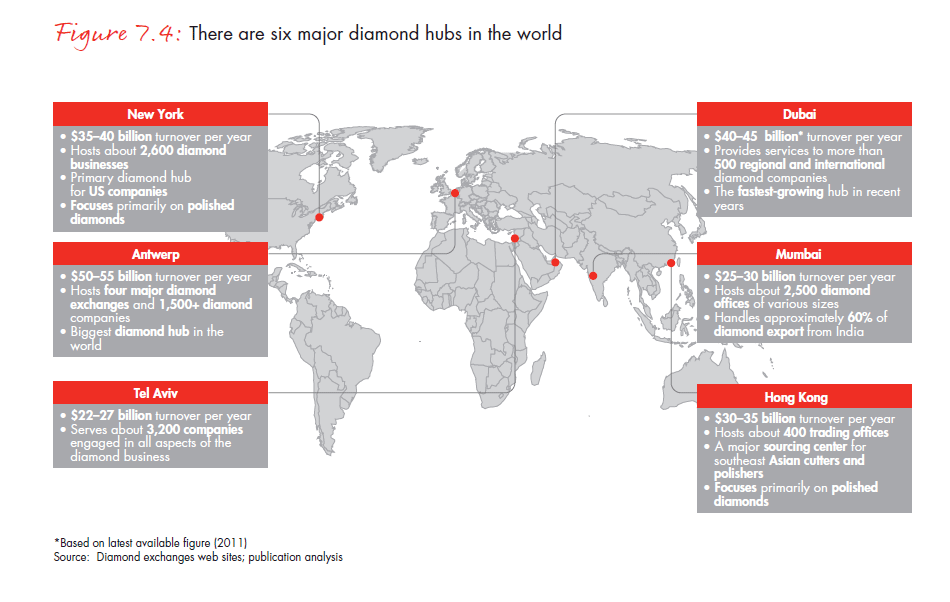
Antwerp is the largest, with annual turnover of $50 billion to $55 billion (see Figure 7.5).
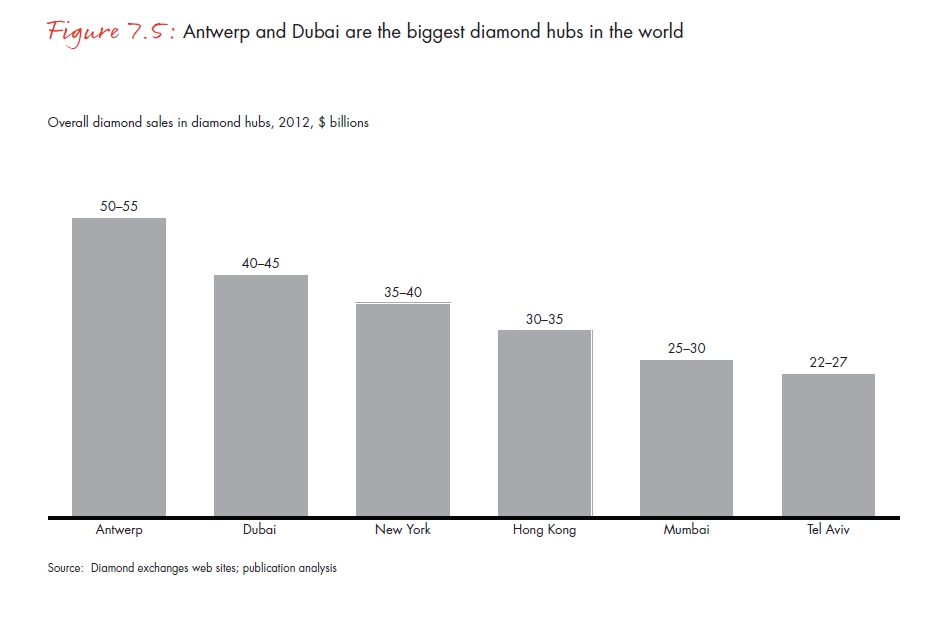
New York, the next largest traditional hub, is the primary trading venue of the major US-based diamond companies. Its annual turnover is $35 billion to $40 billion. Tel Aviv has a long history as a diamond center and is primarily used by highly skilled Israeli cutting and polishing companies, with annual turnover of $22 billion to $27 billion.
The fastest-growing of the newly emergent hubs is Dubai, with annual turnover of $40 billion to $45 billion. Its growth has been fueled by a favorable tax regime and transfer pricing legislation, and Dubai’s proximity to India’s cutting and polishing sector. Hong Kong is a major sourcing center for Southeast Asian cutting and polishing companies, with annual turnover of $30 billion to $35 billion. Mumbai mostly handles the import-export trade of India’s cutting and polishing industry, with annual turnover of $25 billion to $30 billion.
After posting growing revenues from 2009 through 2011, trade at the diamond hubs fell an average of about 10% in 2012 (see Figure 7.6).
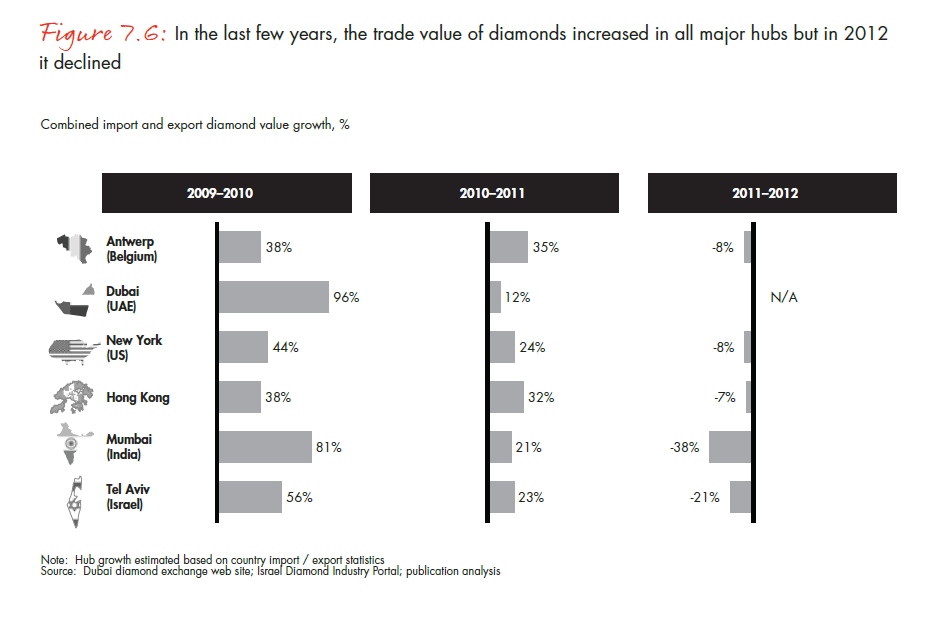
Several factors are behind the decline, including falling marginal demand from the key diamond-consuming countries of China and India, the sluggish U.S. economy, the continued financial crisis in the Eurozone and the devaluation of the Indian rupee. Although many middle-market players have seen their profit margins squeezed and their liquidity diminished in this environment, De Beers and ALROSA, the major rough-diamond producers, have held firm on pricing.
As a result, competition between the diamond hubs has heated up. The new diamond hubs of Dubai and Hong Kong are luring trade with zero taxes on imports and exports and by touting their proximity to the emerging cutting and polishing industry in China and India. The traditional hubs of Antwerp, New York and Tel Aviv have opted to specialize by focusing on high-value stones, well-developed infrastructure and favorable taxation reviews.
Online exchanges. In recent years, online exchanges have emerged as an alternate venue for trade in polished diamonds. The exchanges enable purchasers to buy diamonds online around the clock. Sellers include dealers in polished diamonds as well as small cutting and polishing companies. The sales take a variety of forms—online, timelimited auctions, direct negotiations between buyers and sellers and take-it-or-leave-it offers at a fixed price.
Auction sites. Physical (as opposed to online) auctions take place either at auction houses such as Sotheby’s and Christie’s in cities such as Hong Kong, Geneva, New York and London, or at the sight locations of producers such as De Beers and ALROSA. These auctions—especially those held at auction houses—often generate intense publicity.
Pricing considerations
Pricing diamonds is a complex undertaking with a high subjective component, because each diamond is unique, with its own particular combination of weight, color, shape and cut (see Figure 7.7).
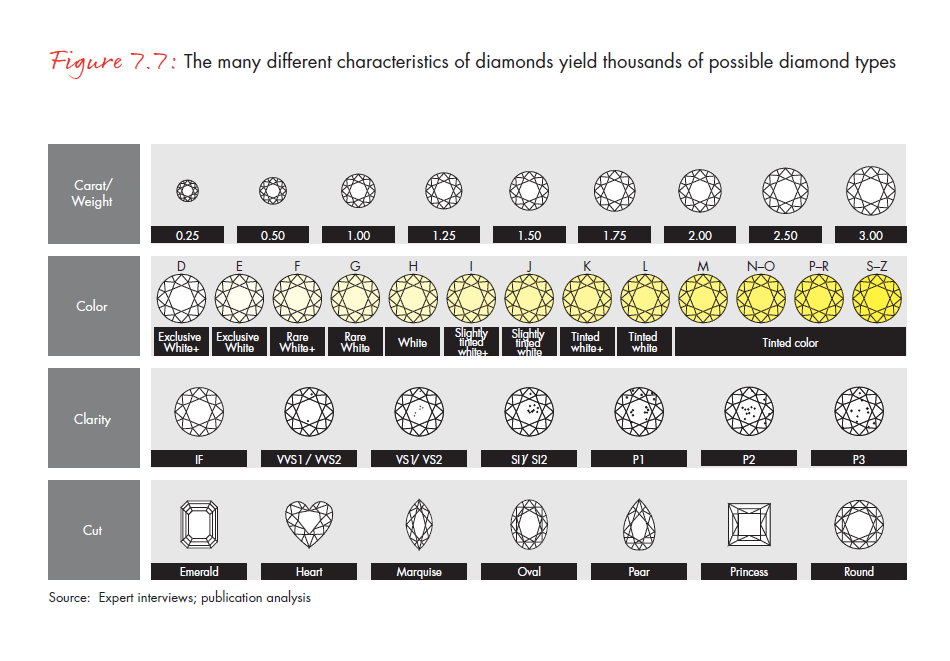
The combinations and permutations of those characteristics run into the thousands. As a result, prices per carat vary widely, depending on the size and quality of an individual stone (see Figure 7.8).
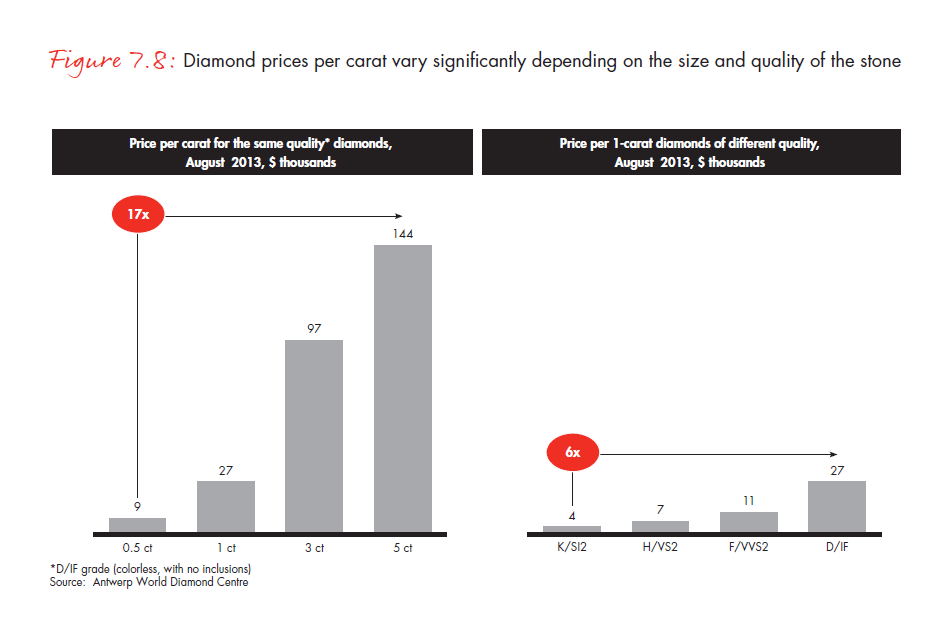
A key consideration in diamond pricing is a stone’s grade. Grading is carried out by independent gemological laboratories, which assign only a grade—and not a monetary value—to each stone they examine. Grading is by no means an exact science, given that of the four key grading criteria, only weight (carat) is a purely objective measurement. Color, clarity and cut are all, to one degree or another, a matter of subjective judgment. Because of subjective considerations, the same diamond can receive markedly different grades from different laboratories, with resulting differences in price.
Several different diamond-industry entities, including the Antwerp World Diamond Centre, IDEX, Polished Prices and Rapaport, publish price lists, but those lists provide only a guide to prices, not a definitive level. Ultimately, the final price of a diamond is subject to negotiation between the buyer and seller, and the stone is almost always sold at something other than list price. Discounts and premiums are influenced by the quality and cut of a particular stone, credit considerations, the location and type of market where the stone is exchanged and the salability of the diamond in question.
Key takeaways
- The middle-market segment of the diamond value chain includes secondary sales of rough diamonds, cutting and polishing, primary and secondary sales of polished diamonds and jewelry manufacturing.
- The middle market is highly fragmented, with more than 5,000 players following a wide range of business models.
- Like the upstream segment, the main sales channels of the middle market are long-term contracts, auctions and short-term or onetime sales. In contrast to the upstream segment, onetime agreements account for the bulk of middle-market sales—about 90%—and long-term contracts and auctions (mostly of unique stones) each account for about 5% of sales.
- Trust and relationships play an important role in middle-market sales process. Any newcomer wishing to buy rough or polished diamonds at wholesale prices needs references from existing players.
- Most diamonds are exchanged at one of six major diamond hubs, where customers can examine and trade stones. The newly emerging diamond trade hubs of Dubai, Hong Kong and Mumbai attract trade through favorable legislation (transfer pricing) and taxation and their proximity to production sites or consumer markets. The traditional hubs of Antwerp, New York and Tel Aviv are increasingly focusing on high-value stones, investing in infrastructure and pushing for favorable tax reforms.
- Polished diamonds are evaluated and priced according to the “four Cs” of carat, color, clarity and cut. Because all but carat are matters of subjective judgment, the price of a single diamond can vary to some extent.
- The price for diamonds with specific grades on the “four Cs” can be approximately estimated based on price lists published by various diamond-market participants. But the list is not definitive, and stones nearly always change hands at something other than list price.
8. Key challenges and trends for players along the value chain
As a still-evolving industry endures a period of slowing growth, players along the value chain face a range of challenges. The entire industry is currently lacking a generic marketing effort that would spur overall demand for diamonds. Another significant challenge is that banks that specialize in diamond financing are pulling back from the market. If that retreat continues, the industry will need to locate alternative sources of financing, which would almost certainly demand greater transparency as a condition of lending.
Challenges for players along the value chain
Other challenges are different at each segment of the chain—upstream, middle market and downstream—as players with widely varying profit margins confront issues including sourcing, government relations and customer access (see Figure 8.1).
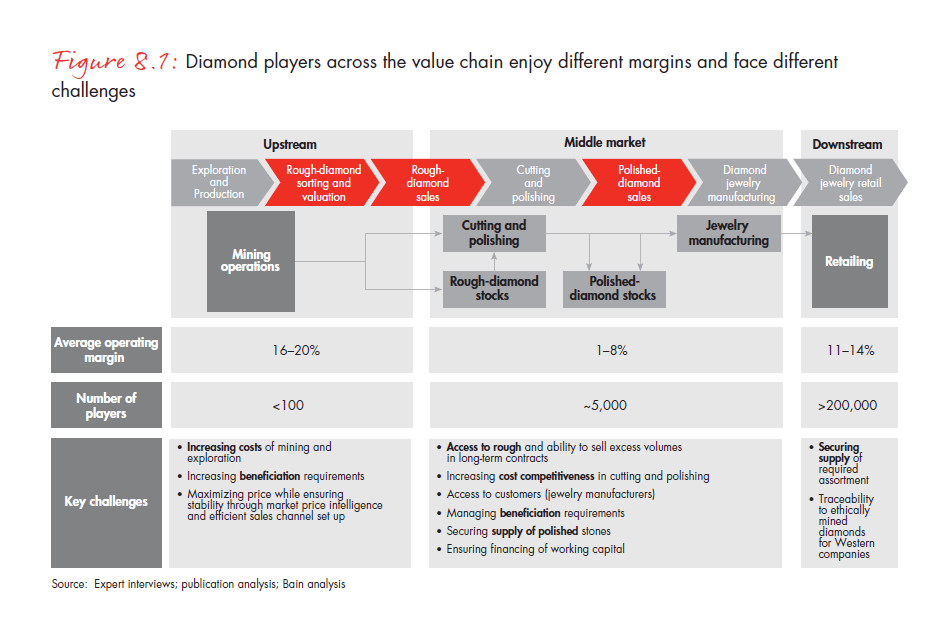
Upstream players, which enjoy profit margins of 16–20%—the highest in the industry—face four overriding challenges. Their mining and exploration costs are rising, while the governments of the countries where many of their mines are located are stepping up beneficiation requirements. Market conditions remain volatile and uncertain, making it more important than ever to collect high-quality market intelligence to maximize achieved prices and set output levels. Upstream players also need to optimize their mix of sales channels and find the most efficient route to market.
Middle-market players, with the lowest profit margins across the value chain (margins range from 1% to 8%) face a very different set of challenges. Above all, they need to secure access to supplies of rough diamonds while retaining the ability to resell surplus rough diamonds obtained through long-term contracts. Cost competition among cutters and polishers is intensifying, making new investments in efficiency necessary at a time when financing for working capital is growing harder and harder to obtain. Competition for access to jewelry manufacturers—the middle market’s key customers—is also heating up. At the same time, middle-market players must relocate some operations to meet beneficiation requirements. Finally, there is the never-ending challenge of securing access to polished stones at prices that make economic sense.
Beneficiation policies, which aim to create or relocate value-adding services within mining countries, place their heaviest burdens on players in the upstream and middle-market segments of the value chain. Not only must upstream players move some of their sorting facilities and sales venues, they also face increasingly strong requests to reallocate an increasing share of their mining activities to state-owned companies. Middle-market players, for their part, need to relocate at least a share of their cutting and polishing operations.
At the downstream end of the value chain, where profit margins range from 11% to 14%, the key challenges for retailers are to secure a supply of diamond jewelry appropriate to their customer base and to ensure that the diamonds in the jewelry are ethically sourced. Ethics considerations have grown more salient in recent years, because of increased awareness among retail consumers of the issues surrounding conflict diamonds. Simply put, consumers want diamonds, but not if those diamonds help finance warlords and terrorists. Aware of their customers’ changing preferences, retailers in the West are placing increasing emphasis on ethical sourcing in their marketing materials.
To meet the challenge of gathering adequate supplies of the right mix of diamond jewelry, some large retailers have extended their operations upstream, investing in mines and in cutting and polishing companies. Tiffany & Co. is one retailer that has made such investments, with mixed results. Chow Tai Fook, meanwhile, has responded to the supply challenge by securing long-term contracts with three major rough-diamond producers and acquiring two cutting and polishing operations. In 2012, about half of the polished diamonds used in Chow Tai Fook jewelry were produced in-house.
Key success factors for players along the value chain
To meet the challenges at each segment of the value chain, diamond industry players must focus on key success factors, which, like the challenges, vary from one segment to the next.
Upstream players are focusing on pricing their output effectively and finding the mix of sales channels that will allow them to maximize achieved prices and enable them to accurately project their production requirements. They are also working to form partnerships with the governments of diamond-producing countries. And with pricing uncertain and technology growing more complex, producers are making operational excellence a priority.
Success in the middle market depends above all on gaining reliable access to rough-diamond supplies—no easy feat in an industry where 100 companies (out of more than 5,000) have locked up 70% of rough-diamond production. Cutters and polishers also need access to the customers (jewelry manufacturers) best suited to the type of polished diamonds they produce. Manufacturers need to achieve the scale necessary to drive down production costs, and players at all points in the middle market need to cultivate a deep understanding of both rough and polished diamond classifications to do business up and down the chain.
Meeting the challenges at the downstream end of the value chain requires retailers, especially those at the high end of the market selling jewelry with high-value diamonds, to secure adequate supplies of large, high-quality stones. And retailers at all price points need deep market intelligence to anticipate shifts in customer taste and respond in a timely manner.
Trends along the value chain
Upstream market. Certain trends at every segment of the value chain are becoming apparent. At the upstream segment, sorting and valuation are in flux as producers relocate sorting centers to mining countries to meet beneficiation requirements. Producers are also stepping up investments in sorting technology to increase the degree of automation in their operations.
The upstream-segment sales channels are also undergoing changes, although the current mix of sales channels is likely to remain stable in the near term. The output from the former BHP Billiton mines is likely to be sold through long-term contracts (as opposed to auctions) under their new owner, Dominion Diamond. Over the longer term, however, auctions are likely to account for an increasing share of rough-diamond sales, as smaller producers claim a growing proportion of rough-diamond production. The industry may also see the reemergence of hybrid sales channels, such as the sale of long-term rough supplies at auction.
Middle market. Secondary rough diamond sales in the middle market are likely to decline, the victim of consolidation in the cutting and polishing segment. The larger consolidated companies will likely have improved access to rough-diamond supplies, reducing the need to source additional supply in the secondary market. That market won’t disappear entirely, however, because smaller players without direct access to major producers will still need to obtain supplies.
Both upstream and downstream segments continue to exert pressure on the middle market, resulting in further consolidation and integration in the middle of the value chain as players seek to maximize margins through scale and scope. Continuing consolidation and integration will in turn drive long-term contract holders toward the integrated players, whose diversification and scale give them a competitive advantage.
The financing squeeze on middle-market players, which source rough diamonds from the upstream segment and supply polished diamonds to the downstream segment, will require a response from the entire industry. Alternative financing sources will require more transparency, and there is already pressure for greater openness. The big mining companies are key players in this effort, and they will be expected to find ways to shine more light on the obscure corners of the market.
Downstream market. Because producers are unlikely to boost their mines’ yield of high-value rough diamonds, retailers will face a continuing challenge to secure adequate supplies of high-quality polished stones. To meet the challenge, large high-end retailers will likely invest in mining operations or integrate backward by acquiring mines and, eventually, middle-market operations. For example, Tiffany & Co. and Chow Tai Fook have already set off down that path, and other big retailers are likely to follow. That will put additional pressure on the middle market, as retailers compete for goods alongside their current suppliers.
Consumers—and therefore retailers—in the West will likely place increasing stress on the ethical aspects of diamond jewelry—not only the source of the diamonds but also the industry’s commitment to the economic development of mining countries. Ethical considerations appear to be of less concern to consumers in the rest of the world and will have little impact on retailers outside the West.
9. Supply-demand balance through 2023: A bright outlook for producers despite setbacks
Over last few years, demand and supply reached a condition of rough balance that should persist through 2017. From 2018 through 2023, as existing mines are depleted and new mines add only limited production, supplies will decrease in both volume and value terms. At the same time, demand will sustain its upward growth trajectory, fueled by rising economic prosperity in emerging markets. The growth of demand over supply makes for a positive long-term outlook for participants in the diamond value chain.
Global rough-diamond demand forecast: Methodology
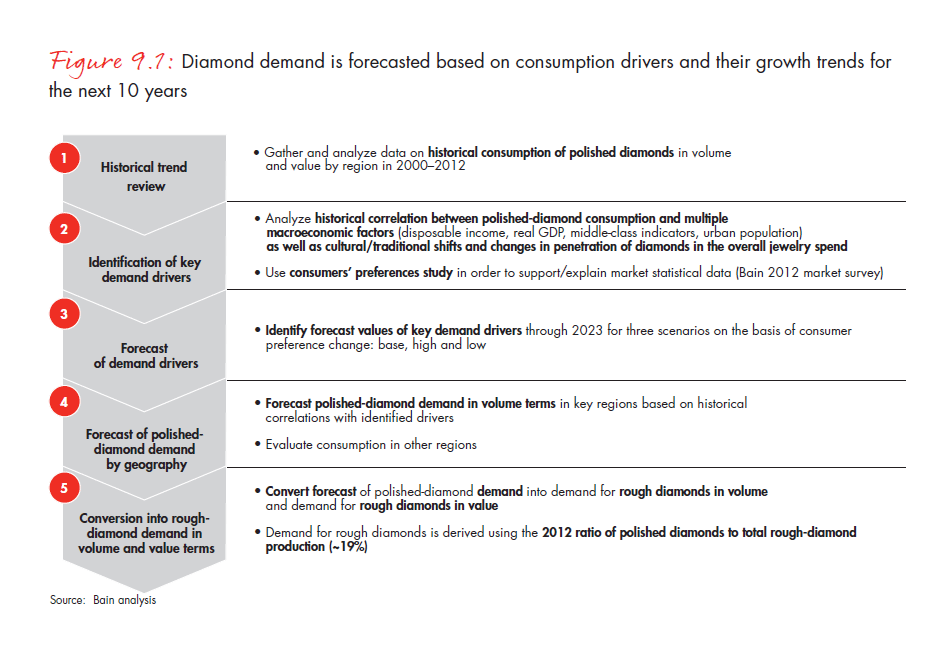
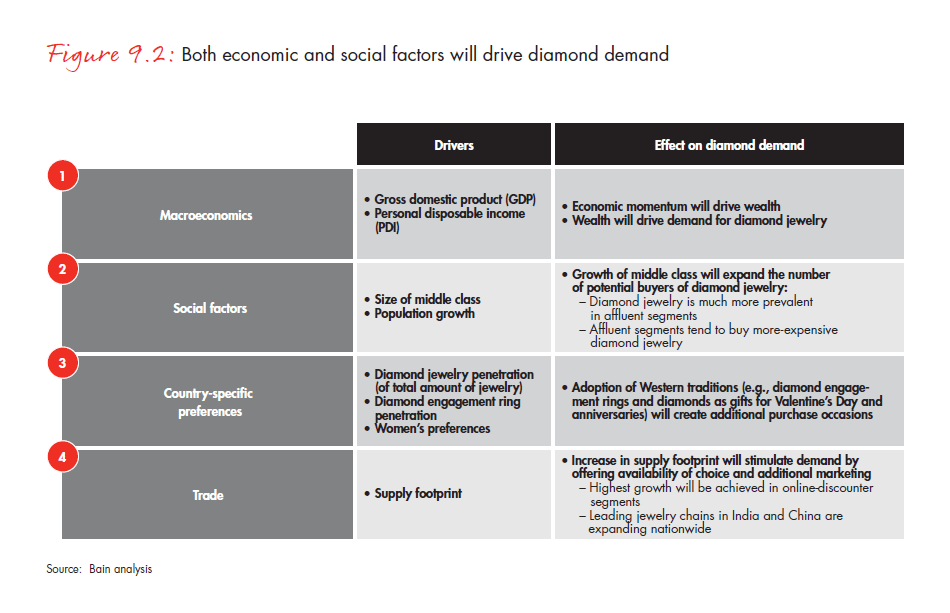
The demand forecast for rough diamonds hinges on consumer demand for diamond jewelry. Our forecast therefore factors in data on the forces that historically have shaped demand for diamond jewelry, including growth in gross domestic product (GDP), the size and growth of the middle class and urban population, personal disposable income and diamonds’ share—especially diamond engagement rings’ share—of the overall jewelry market. We then identified the indicators that we found to best explain the differences in consumption of diamond jewelry in each region and forecasted demand based on those indicators, factoring in the historical correlation between the indicators and final demand (see Figures 9.1 and 9.2).
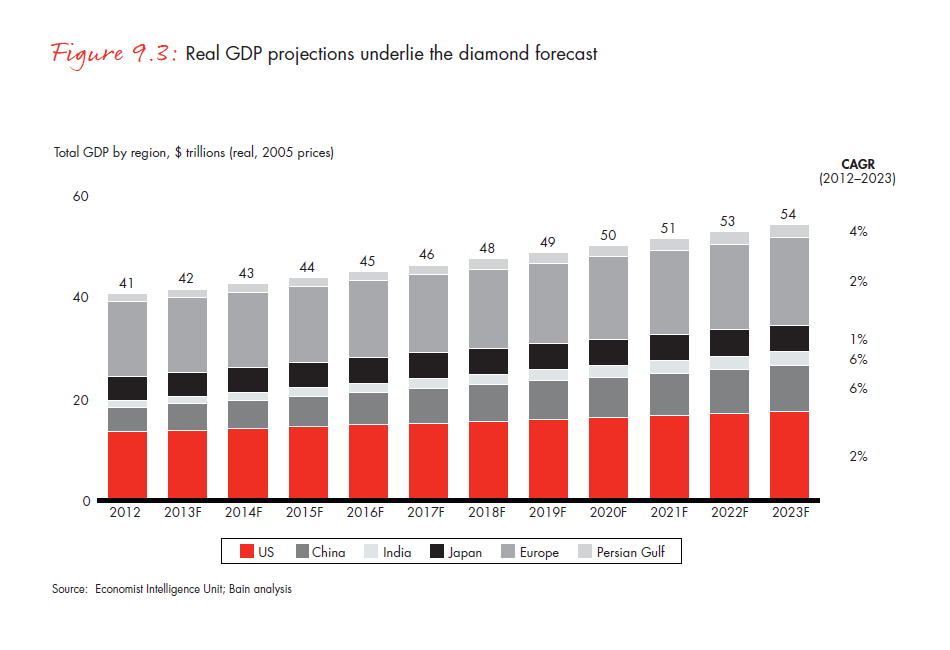
The link between demand and personal income. Demand for diamond jewelry in developed markets such as the US, Europe and Japan, as well as in the developing market of the Persian Gulf, is driven primarily by changes in disposable personal income. So, to forecast the demand for diamond jewelry, this study uses GDP projections from the Economist Intelligence Unit, which sees solid growth prospects in the US and Europe and slightly positive growth in Japan (see Figure 9.3). The demand outlook also takes into consideration each country’s middle-class growth rate, historical preferences for diamond jewelry and the market penetration of diamond engagement rings.
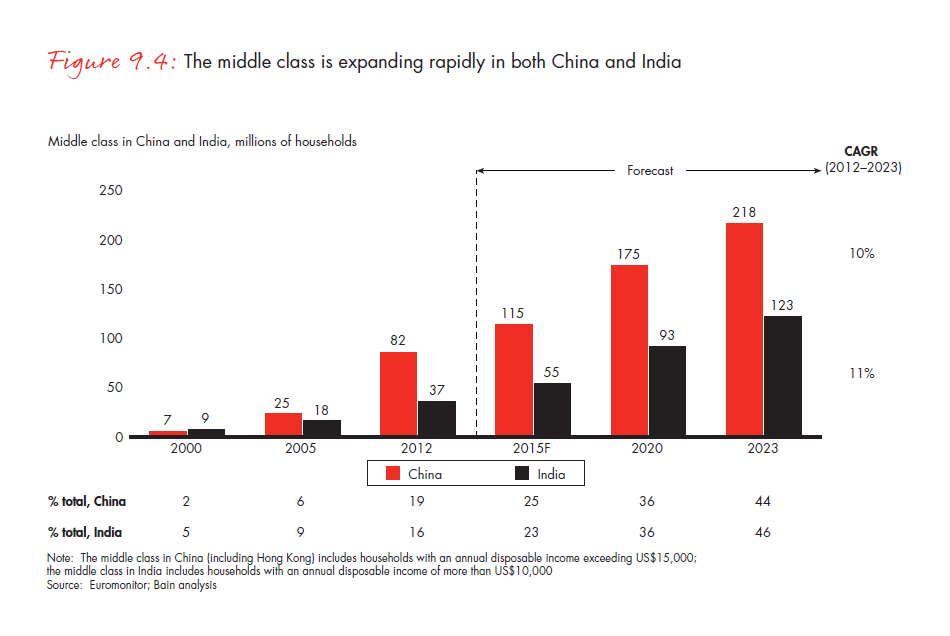
Additional variables to consider for developing markets. In India and China, different forces influence the growth of demand for diamonds—namely, the urbanization of the population and the growth of the middle class. Additional factors include the adoption rate of Western consumption habits, which would tend to increase the share of diamonds in consumers’ discretionary spending, and the concerted push by growth-minded retailers into second-, third- and fourth-tier cities, as well as online channels. The push into new regions and channels will stimulate diamond jewelry purchases by retailers to fill inventory (see Figure 9.4).
Global rough-diamond demand forecast: Base scenario
Growth in line with historic trends. Global demand for rough diamonds is expected to grow in line with historical trends through 2023. The variables with the strongest influence on demand for rough diamonds include the pace of middle-class expansion in China and India, growth in personal consumption and continuing cultural shifts in developing regions toward Westernstyle consumption patterns. Our base scenario assumes that the global economy will continue to grow despite short-term setbacks.
Translating diamond jewelry demand into demand for rough diamonds, our base scenario forecast calls for global rough-diamond demand to increase at a compound annual rate of 5.1%, to $26 billion in 2023 (see Figure 9.5).
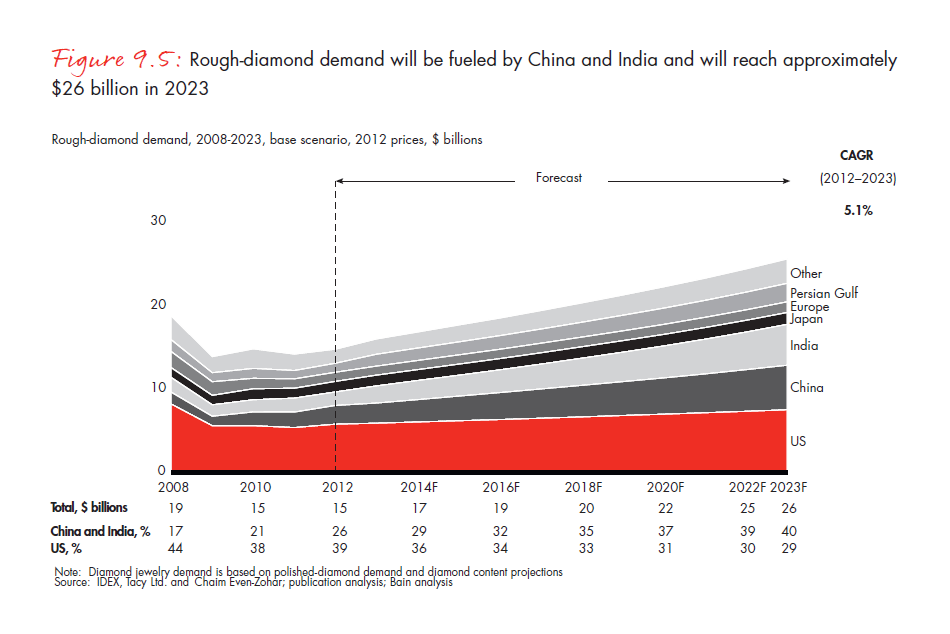
Our 2013 base forecast for rough-diamond demand departs significantly from our 2012 forecast, which projected that global rough-diamond demand would grow at a 5.9% compound annual rate through 2020, to 207.1 million carats. That the 2013 forecast calls for lower demand growth than the 2012 forecast reflects several developments that occurred in the interim. The main reason is that rough-diamond demand grew more slowly in 2012 than anticipated, largely because of weaker-than-forecasted growth in GDP and personal consumption. Actual worldwide rough-diamond production in 2012 was 128.0 million carats, down from the demand of 139.3 million carats projected in the 2012 forecast.
Going forward, our 2013 base demand forecast assumes that GDP will grow more slowly in China and India than projected in 2012, and, as a consequence, the middle class in China and India will expand at a slower rate than projected in 2012. Middle-class incomes in those developing markets will grow more slowly as well, constraining purchases of luxury goods. The 2013 forecast also assumes that GDP will grow more slowly in the rest of the world than forecasted in 2012. As a result of the new data and changed assumptions, we now forecast that demand will grow to 192.7 million carats valued at $22.4 billion in 2020, down from our 2012 forecast of 207.1 million carats valued at $26.1 billion in that year.
Demand forecasts for key regions
US. In the US, the world’s largest and most developed diamond market, demand has stabilized and is expected to grow in line with overall economic expansion. Demand for rough diamonds is expected to rise at a 2.4% compound annual rate, to approximately $8 billion in 2023. If the pattern of the past 20 years holds—and current projections assume that it will—about 80% of all betrothed couples will purchase a diamond engagement ring. In no other country does such a large percentage of couples purchase a diamond ring as a token of their engagement.
There is reason to hope for a more-robust rebound in US rough-diamond demand. Currently, diamonds account for 49% of US consumers’ jewelry purchases, well off the historical norm of 67% of jewelry purchases. Diamond demand could grow further if diamonds were to reclaim their historical share of the overall jewelry market. But that will require a concerted marketing effort by the retail jewelry industry.
China. China will account for an estimated 29% of the global rough-diamond market’s growth through 2023, as the middle class expands and the rural population moves into cities. Current projections suggest that the middle class will triple in size by 2023, and rough-diamond demand will more than double, to about $5 billion in that year. Middle-class households currently make up only 19% of China’s population, but consensus forecasts call for that percentage to grow to up to 44% in 2023. Diamond demand could accelerate if middle-class affluence grows faster than the forecasted 6% compound annual rate. With more spending power at their disposal, some consumers will likely buy more expensive diamond pieces.
India. Despite the setback in 2012, rough-diamond demand in India is expected to rise as the middle class more than triples in absolute numbers by 2023 and sees its share of the population rise from 16% to 46% (by consensus estimates) over the same period. Demand for rough diamonds driven by India’s demand for diamond jewelry is expected to reach approximately $5 billion in 2023. The 2% compound annual growth of the workforce will power middle-class growth, as will the rise in labor force participation from its current 53% rate. The labor force is expected to grow as more and more of the population exits less formal sectors of the economy for formal employment.
India’s underdeveloped diamond market offers significant growth potential as GDP and consumer affluence increase. A gradually increasing share of Indian couples are adopting the Western engagement ring practice, modestly lifting both diamond jewelry’s share of the jewelry market and the number of diamond-owning households.
Global rough-diamond demand forecast: Two alternative scenarios
Our demand forecast includes two alternative scenarios that result in higher or lower diamond demand (see Figure 9.6). Both scenarios closely track the projected growth in high-net-worth individuals (HNWIs) and the development of the overall luxury-goods market (see Figure 9.7).
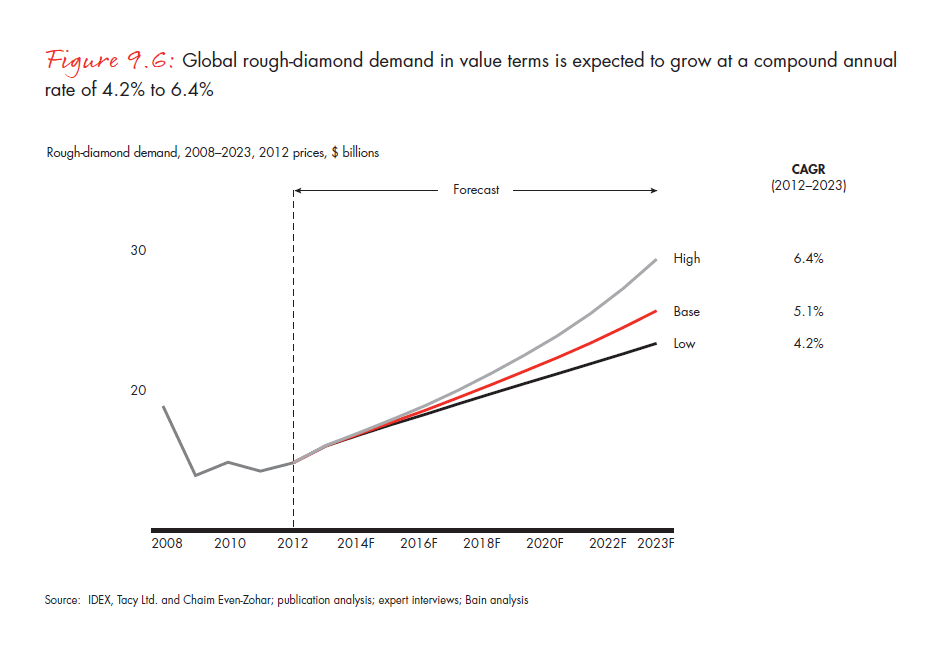
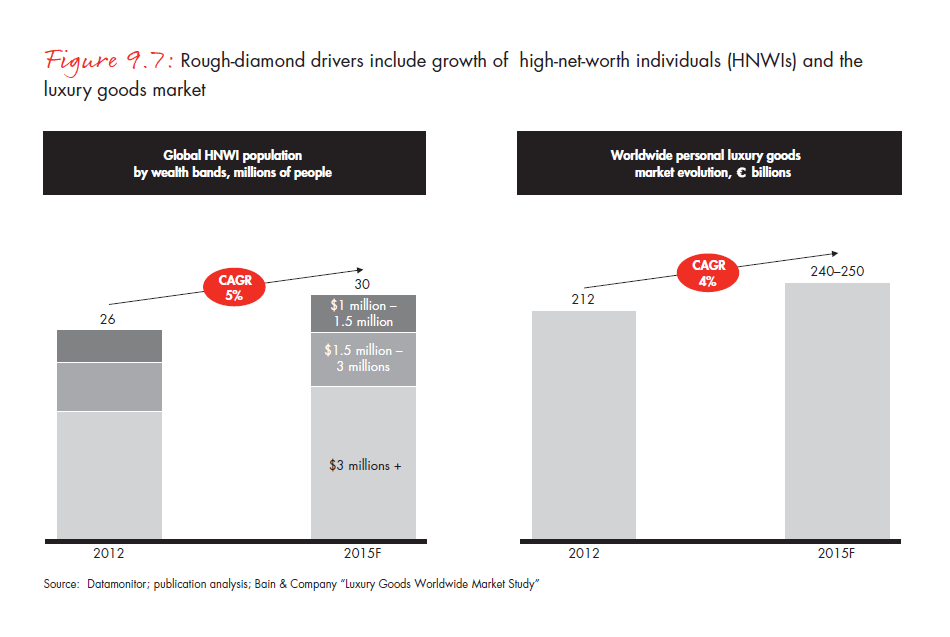
The higher-demand projection for rough diamonds assumes stronger GDP growth in developed economies, a faster economic recovery and reinvigorated consumer confidence. Those developments would in turn propel total private consumption upward and spur increased purchases of more-expensive diamond jewelry. The higher-demand projection also assumes that stronger-than-expected GDP growth would accelerate the expansion of the middle class in China and India and speed the adoption of Western spending practices among those populations. Under this scenario, total global demand for rough diamonds would rise at a 6.4% compound annual rate.
The lower-growth scenario inverts those assumptions and anticipates slowing GDP growth and a relapse into global recession. Under that scenario, developed economies would stagnate and growth rates in China and India would decline (though they would remain well above growth rates in developed economies). Were that to happen, total global demand for rough diamonds would likely slow to a 4.2% compound annual rate.
Global rough-diamond supply forecast: Methodology
We have revised our 2013 annual supply forecast on the basis of the updated plans of mining companies and reports on the progress of several mining projects. As in 2012, we drew our base forecast for the global rough-diamond supply from an analysis of current and historical production levels at existing mines, combined with publicly announced plans and anticipated production at every new mine expected to come online from 2012 through 2023 (see Figure 9.8).
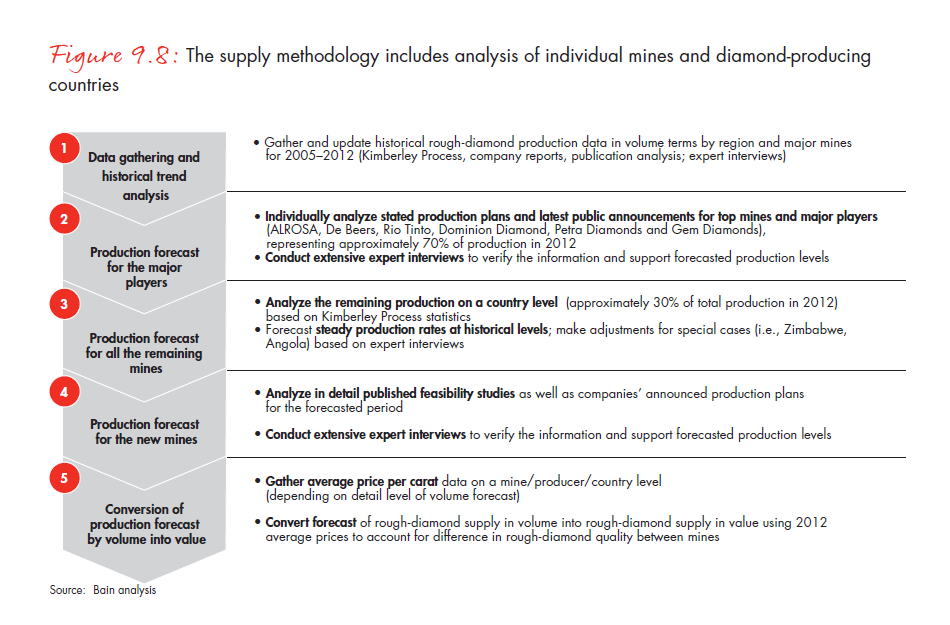
Our forecast considers the individual production plans of the companies operating the major mines, which accounted for 70% of global rough-diamond production in 2012. We analyzed the additional production from other mines—roughly 30%—on a country-by-country basis and forecast the production of new mines by considering published feasibility studies and production targets. But although we relied primarily on the publicly disclosed plans of producers and mine operators, we also drew on expert opinion when company plans were not available or when a majority of experts judged a plan to be overly optimistic. Several considerations can influence that judgment, including technical or financial difficulties or the engineering challenges inherent in moving from surface to underground extraction.
In addition, as we do every year, we allowed for uncertainty over the output of certain mines and producing countries by constructing two alternative scenarios, which we have labeled the Stable Production Scenario and the Production Increase Scenario. Each scenario draws on technical expert opinions and market research to envisage potential variations in expected future production.
Global rough-diamond supply forecast: Base scenario
Our base supply scenario calls for moderate growth in the supply of rough diamonds. It assumes that new mines now under development will add 18 million carats to the supply and that, from 2018 onward, production from existing mines will start to decline as the mines are depleted. The base scenario also takes into account the absence of significant new discoveries of diamond deposits in recent years. The resulting forecast calls for rough-diamond production to peak at 169 million carats in 2018, below the pre-crisis peak of 177 million carats in 2005, and then to drop to 153 million carats in 2023.
Key suppliers’ production forecasts. The base scenario makes specific assumptions about future production from the largest suppliers and mine operators, including De Beers, ALROSA, Rio Tinto and Dominion Diamond. The forecast also considers the likely output from mines in Zimbabwe and the Democratic Republic of Congo. In the base scenario, production by De Beers, which owns all or part of the Venetia, Orapa, Jwaneng and Voorspoed mines, among others, is expected to grow at a compound annual rate of 1.2% through 2023, with the majority of that growth occurring before 2018. ALROSA’s production is expected to grow by a compound rate of 1.8% per year through 2023. Unlike the other major producers, ALROSA did not decrease production during the financial crisis because it was able to sell excess supply to Gokhran, the Russian state agency charged with maintaining a strategic reserve of precious minerals.
Rio Tinto’s production is expected to rise through 2018 at an 11% compound annual rate. From 2019 through 2023, production is expected to fall at the same rapid rate. As a result, production over the full 10-year period will decline at a compound annual rate of 0.3%, to approximately 13 million carats in 2023.
New player Dominion Diamond, taking over from BHP Billiton by acquiring its stake in the Ekati mine, has reported that it will make significant investments to develop new mines and exploit smaller and low-grade deposits that BHP Billiton did not attempt to extract. With all these investments, Dominion Diamond intends to extend the Ekati mine’s life until about 2023.
Zimbabwe will contribute significantly to supply growth, with expected stable output of about 12 million carats per year through 2023. Given Zimbabwe’s complex and volatile political environment, however, the country’s actual production could be even higher than disclosed. Production volume may also increase if current operating issues at Zimbabwe’s Marange mine will be fixed.
New mines coming online. Eleven new mines are expected to come online from 2012 through 2023 and, by the end of that period, to add as much as 18 million carats to the output of existing mines (see Figure 9.9).
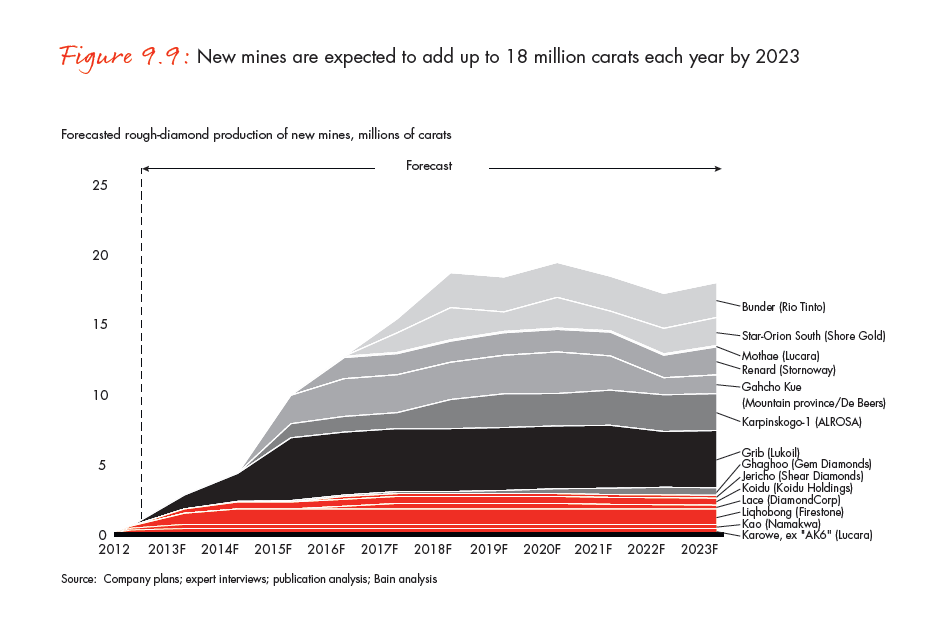
The largest mine expected to come online is the Gahcho Kué mine in Canada’s Northwest Territories. Developed by Mountain Province Diamonds and De Beers, Gahcho Kué is projected to produce up to 6.1 million carats annually, by 2020 and then decline to 2.8 million carats by 2023. The Karpinskij pipe is expected to increase output to around 2.6 million carats annually thus lifting total ALROSA production at the Lomonosov diamond field to 5.2 million carats in 2023 from 0.6 million carats in 2012. Rio Tinto’s Bunder mine in central India is projected to yield roughly 2.5 million carats per year when it comes fully online in 2016 or 2017.
With the exception of Russia’s Grib and Canada’s Renard mines, which are projected to produce 4.5 million and 1.6 million carats per year, respectively, other new mines under development are relatively small; each is projected to produce 1 million carats or less per year. Most of the new mines have encountered technical challenges and had difficulty attracting financing in the current adverse economic environment.
The 11 new mines could generate about 18 million carats in annual production by 2023—a small amount relative to current global rough-diamond production. Because it takes 7 to 10 years to develop a mine, even if major new deposits were discovered within the next few years, there would not be enough time to bring them to full production by the end of the forecast period.
Global supply assumptions. Taking all these factors into account, the global supply of rough diamonds is expected to peak in 2018 and decline thereafter as existing mines are depleted. More specifically, we project that production will increase at a compound annual rate of 4.8% from 2012 through 2018, then decline by 1.9% at a compound annual rate from 2019 through 2023, leveling off at 153 million carats per year (see Figure 9.10).
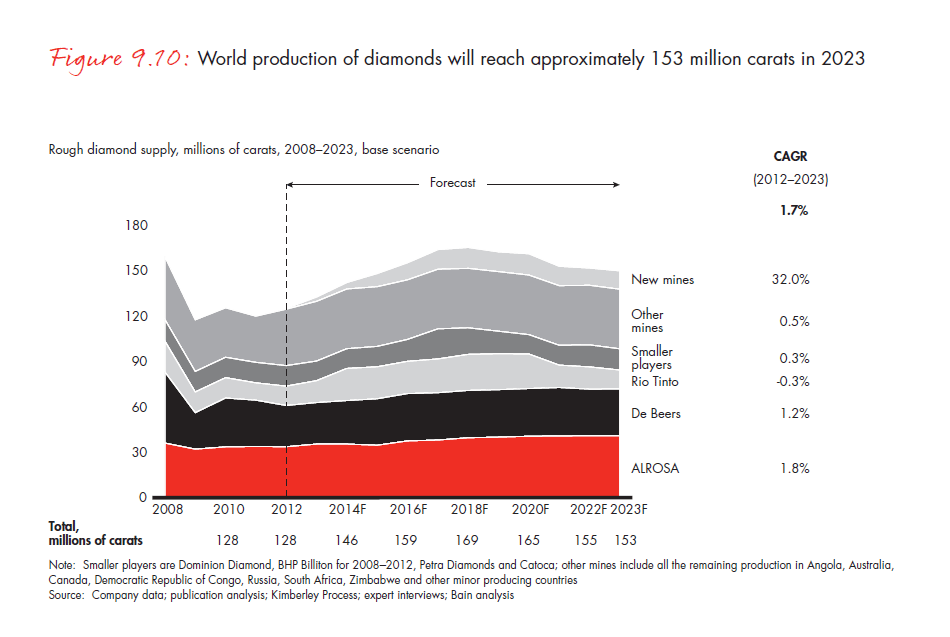
Our 2013 supply forecast calls for slower growth in supply than did the 2012 forecast. The 2013 forecast reflects adjustments to 2012 mine production levels made in response to slower-than-anticipated economic growth, lowerthan- anticipated prices and technical challenges at some mines. Actual 2012 output was 5.4 million carats lower than forecast in our 2012 projections, as Rio Tinto and Angola cut production from previously announced levels.
The 2013 growth estimates also assume that projected production for the years 2012 through 2018 will be below the levels forecasted in 2012. In our latest projection, De Beers’s output is expected to increase at a lower rate than previously forecasted through 2023, while Rio Tinto’s will grow at a slightly higher rate than we projected in 2012.
Finally, as we noted earlier in this report, not all carats are created equal. Diamonds from Zimbabwe and the Democratic Republic of Congo tend to be of lower quality than equal-weight diamonds from other regions. To account for variations in diamond quality, we used each mines’ average price per carat to project future supply in dollar terms (see Figure 9.11).
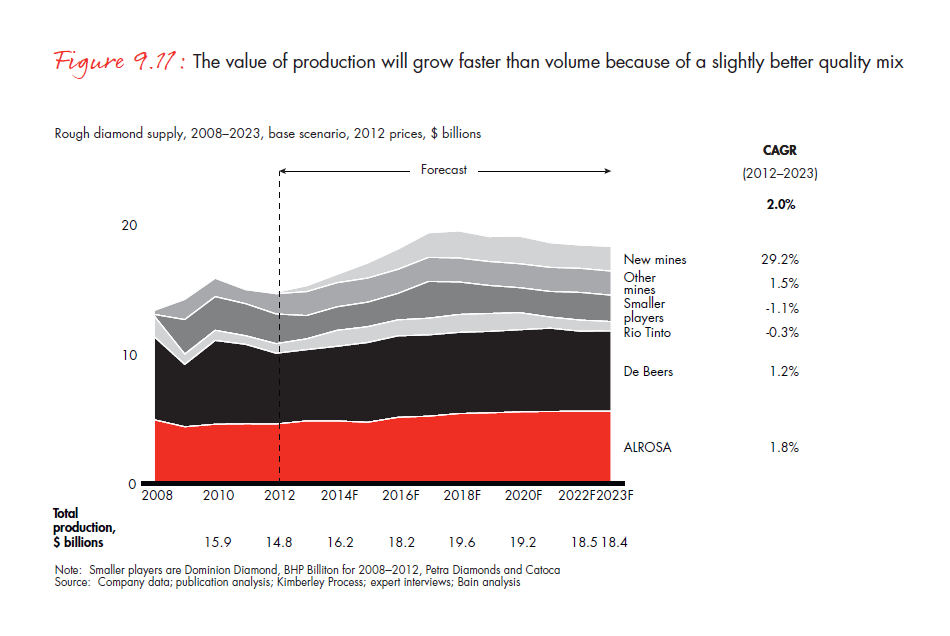
Global rough-diamond supply forecast: Two alternative scenarios
We constructed two alternative supply scenarios to allow for the possibilities that production will grow at a greater or lesser rate than that assumed in the base supply scenario (see Figure 9.12).
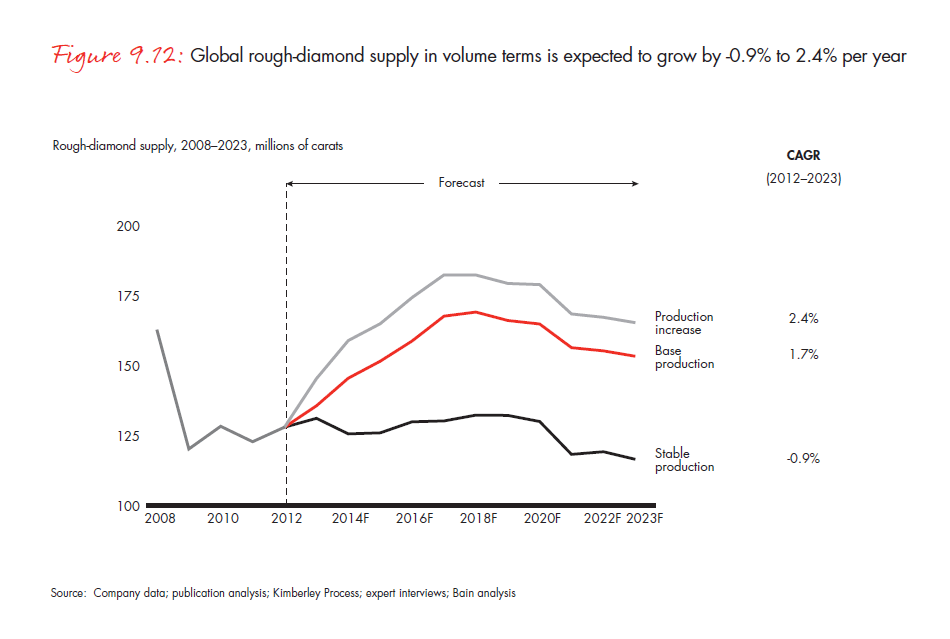
The Production Increase Scenario assumes that key African countries will produce more than projected in the base scenario. The Stable Production Scenario assumes that the largest mines and producers will fall short of their stated production targets; consequently, it projects that production will remain essentially flat through 2018 and then decline from 2019 through 2023. Both scenarios take into account not only potential industry developments but also external factors that could disrupt mining activities in Africa.
The Production Increase Scenario, which calls for production to grow at a 2.4% compound annual rate from 2012 through 2023, compared with 1.7% in the base scenario, assumes that mine operators will resolve engineering problems at some mines and that other mines will be depleted at a faster rate than envisioned in the base scenario. It further assumes that African mines will be more productive than predicted in the base scenario.
The Stable Production Scenario is based on more conservative assumptions, most notably the possibility that some major mines will achieve their full potential more slowly than assumed in the base scenario. According to this scenario, technical problems and tight financing will cause some mines to produce less than projected under the base scenario. In the Stable Production Scenario, production will decline at a 0.9% compound annual rate from 2012 through 2023.
Global rough-diamond supply-demand balance, 2013–2023
Our 2013 forecast projects a long-term positive outlook for rough-diamond producers. Fundamental economic and demographic trends suggest that demand will grow strongly over the long term and that supply will grow from 2012 through 2016 at a rate sufficient to meet the increased demand. The gap between demand and supply will grow rapidly from 2017 through 2023, however, implying higher prices at every stage of the value chain (see Figure 9.13).
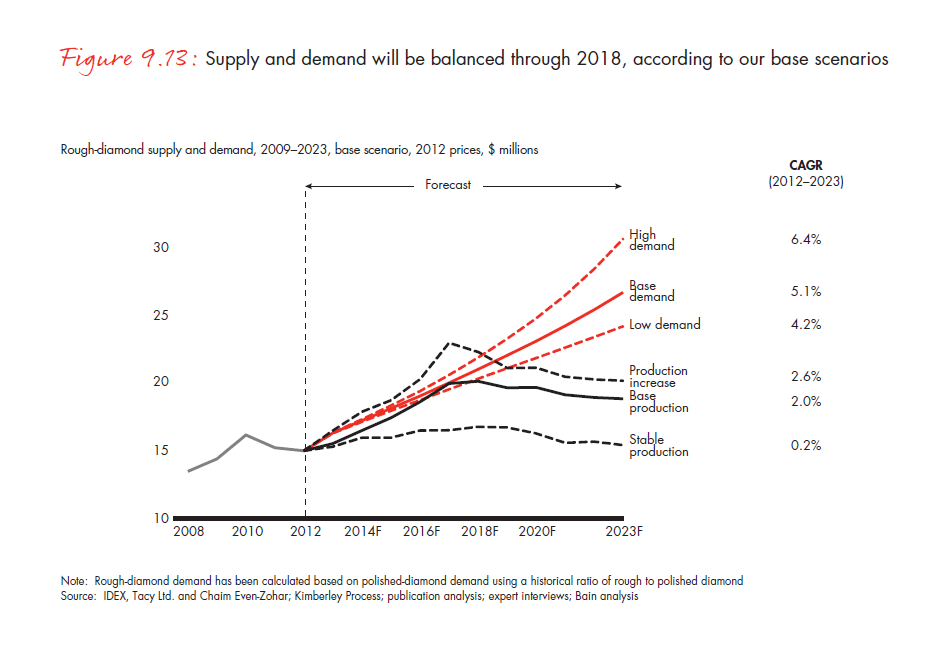
Risks and disruptive factors
We believe several developments could seriously influence the supply-demand balance over the next 10 years. Some of these developments are more likely than others, but industry players and potential investors should take each of them into account in their analyses and plans. Potential risks and disruptive factors include changes in the macroeconomic outlook. A deepening of the debt crisis in Europe, increased political instability in Asia or a slowdown in economic growth in China and India would all lead to decline in diamond demand. We believe there is a moderate probability of any of these developments coming to pass.
The creation of a deep, liquid investment market in diamonds would lead to higher overall demand, disrupt the supply-demand balance and drive up diamond prices. There is, however, only a low probability that a significant investment market for diamonds will develop.
Another risk is that synthetic diamonds could replace natural diamonds in jewelry, infiltrating lower-quality segments in particular. This development could slow growth in emerging markets such as China and India and prompt a shift to other jewelry products when prices increase in developed markets like the US. Demand for natural diamonds would decline; however, the probability of this development is low.
Finally, widespread adoption of the practice of recycling diamonds back into the market would reduce demand for new polished diamonds and consequently suppress demand for rough diamonds. The probability of this development coming to pass, however, is also low.
Key takeaways
- World rough-diamond demand is expected to grow at a compound annual rate of 5.1%, to nearly $26 billion (in 2012 prices) in 2023.
- Although India and China will continue to propel increases in diamond consumption, our 2013 demand projection has been revised downward from the 2012 projection. The downward revision was prompted by slower GDP growth in both markets, leading to lower forecasts of middle-class expansion, as well as lower actual global sales of polished diamonds in 2012 and corrected sales figures for 2011 from IDEX.
- The global supply of rough-diamonds is expected to grow by a compound annual rate of 4.8% from 2012 through 2018, and then decline by a compound rate of 1.9% per year from 2019 through 2023, leveling out at 153 million carats in 2023. The primary causes of the long-term supply decline are depletion of existing mines and a lack of significant new discoveries. New projects that are coming online are not large enough to generate significant growth during the forecast period.
- Our 2013 supply forecast has been revised downward from 2012, owing to changes in companies’ plans and financial and operational difficulties experienced by new projects.
- Although the market will be balanced from 2013 through 2017, demand from 2018 through 2023 is expected to exceed supply, supporting a long-term positive outlook for the diamond industry.
- Several factors continue to threaten to disrupt the supply-demand balance. A deepening debt crisis in Europe, increased political instability in Asian countries or a slowdown in economic growth in China and India are the most likely developments that could negatively affect demand for diamonds.
Conclusion
In the preceding pages, we have taken a detailed and comprehensive look at the state of the global diamond market in 2013, encompassing a review of current fundamentals along the value chain, the 10-year outlook for supply and demand and rough- and polished-diamond sales models and approaches.
A balanced market in the next four years, with a growing gap between supply and demand longer-term
Given the projected economic outlook in mature and developing countries, as well as the dynamics of current production and the pipeline of new projects, the rough-diamond market is expected to remain balanced from 2013 through 2017. From 2018 onward, as existing mines get depleted and no major new deposits come online, supply is expected to decline -1.3% per annum in value terms, falling below continued expected demand growth driven by China, India and US. The supply-demand outlook carries different implications for industry players at different points along the value chain and will have an impact on how they manage their business activities over the next four years and in the longer run.
Upstream: Focus on operational excellence, strengthening the asset portfolio and adjusting the development pipeline
With stable market conditions in the next four years, mining companies are likely to focus on maintaining healthy balance sheets, attaining operational excellence and investing in technology to improve productivity. Given the supply-demand balance outlook, mining companies are also expected to carefully review their development pipelines to identify the projects that promise the highest returns. As for sales channels, the mix is likely to remain stable, with long-term contracts accounting for about 70% of rough-diamond sales. The miners’ focus will turn to the financial soundness and diversity of their client portfolio.
Middle market: Continuing consolidation
The middle market has traditionally garnered the lowest margins along the diamond value chain, with some companies earning as little as 1–2%. The margins of middle-market players are likely to remain stable. The name of the game for them will be to lock in access to primary sources of rough diamonds, make their cutting and polishing operations cost-competitive and secure financing for their operations. Further consolidation and integration is expected in the middle of the value chain in order to maximize margins through scale and scope.
Downstream: Ensuring security of supply
Diamond jewelry retailers will be looking to capitalize on the growing demand for diamonds. In light of the longterm supply expectations, their key challenge will be to secure an adequate and consistent supply of polished diamonds in the range of sizes, shapes and colors suited to their product lines. Retailers will likely be looking at options outside their current supply chain to meet their needs. A number of premium retailers have already integrated backwards along the value chain by investing in mining assets, cutting and polishing operations and in securing access to primary rough supply. This trend is expected to continue. Such consolidation, in turn, will create additional pressure on the middle market as retailers start competing with their current suppliers for access to rough diamonds.
Yury Spektorov and Olya Linde are partners at Bain & Company. Bart Cornelissen and Rostislav Khomenko are principals at the firm. Stephane Fischler, president of the Antwerp World Diamond Centre, and Ari Epstein, the organization's chief executive officer, also contributed to this report.


