Expert Commentary
 }
}
At a Glance
- When a company tries to assess future demand, in many situations, the available data contains only a small number of observations. In these cases, traditional modeling methods don’t work well.
- We devised an alternative approach that employs a nested bivariate regression technique.
- This novel approach is both comprehensible and adaptable, with room for refinements by inputting expert opinions.
Assessing future product demand in different markets is critical for any company’s growth aspirations. Strategic decisions entail not only identifying which markets are expanding and which are saturated but also considering the effects of future demographic changes on market dynamics.
From a modeling perspective, many methods could be applied to this type of data when the number of observations is large, ranging from traditional time series models, such as ARIMA(X), to more sophisticated approaches, such as vector autoregressive (VAR) models, system dynamics, or other machine learning (ML) approaches.
For many business challenges, however, the available data sources contain only a small number of observations. Products or industries might be too young to generate much historical data. Macroeconomic indicators across markets often are limited to annual data. In such cases, analysts cannot treat the modeling task as a multivariate regression problem, using multiple indicators simultaneously to predict demand. Moreover, small N situations don’t accommodate using ML to assess the model accuracy on a holdout validation data set. In other words, one cannot check for the extent of potential overfitting in the model.
To advance the accuracy and power of demand prediction, we have devised a proof of concept to deliver forecasts both at a product line and individual product level. This commentary details how we applied the methodology to forecast insurance premiums, but the proof of concept applies to any situation in which a company must contend with a small number of data points.
The setting: Near-term developments based on economic measures
Given the nature of the available data, this forecast task could be considered as a time series model with annual insurance premiums as the dependent variable and several potential variables (also captured annually) as predictive factors. Our goal was to come up with a forecast to 2025 in an effort to evaluate near-term developments for different markets vs. long-term developments that might be influenced by factors other than those from the past.
The candidate set of testable predictors included a mix of economic indicators, such as gross domestic product and disposable income, along with product-specific data. For instance, in auto insurance, we included data such as the number of vehicles purchased, whereas in property insurance, we relied on housing- and rent-related predictors. For all these predictors, we already had forecasts from external sources such as Oxford Economics and Euromonitor, thus we could project their historical impact in the future. As these forecasts included Covid-19 effects, they set up the model to cover developments created by the pandemic shock as well as likely recovery patterns.
We needed to use a methodology that is both easy to understand and that works with a very small number of observations (namely, annual values) for the economic predictors and the insurance premiums. That N clearly was too small for multivariate modeling or tree-based algorithms.
Getting creative through a nested approach
Evaluating our analytical possibilities, we ruled out two options. First, the option of narrowing down the number of candidate predictors in order to arrive at a longer time series. That gain often amounted only to a few years, which was not enough to allow a multivariate modeling. Second, solely relying on one predictor per type of insurance would have neglected valuable information from other predictors.
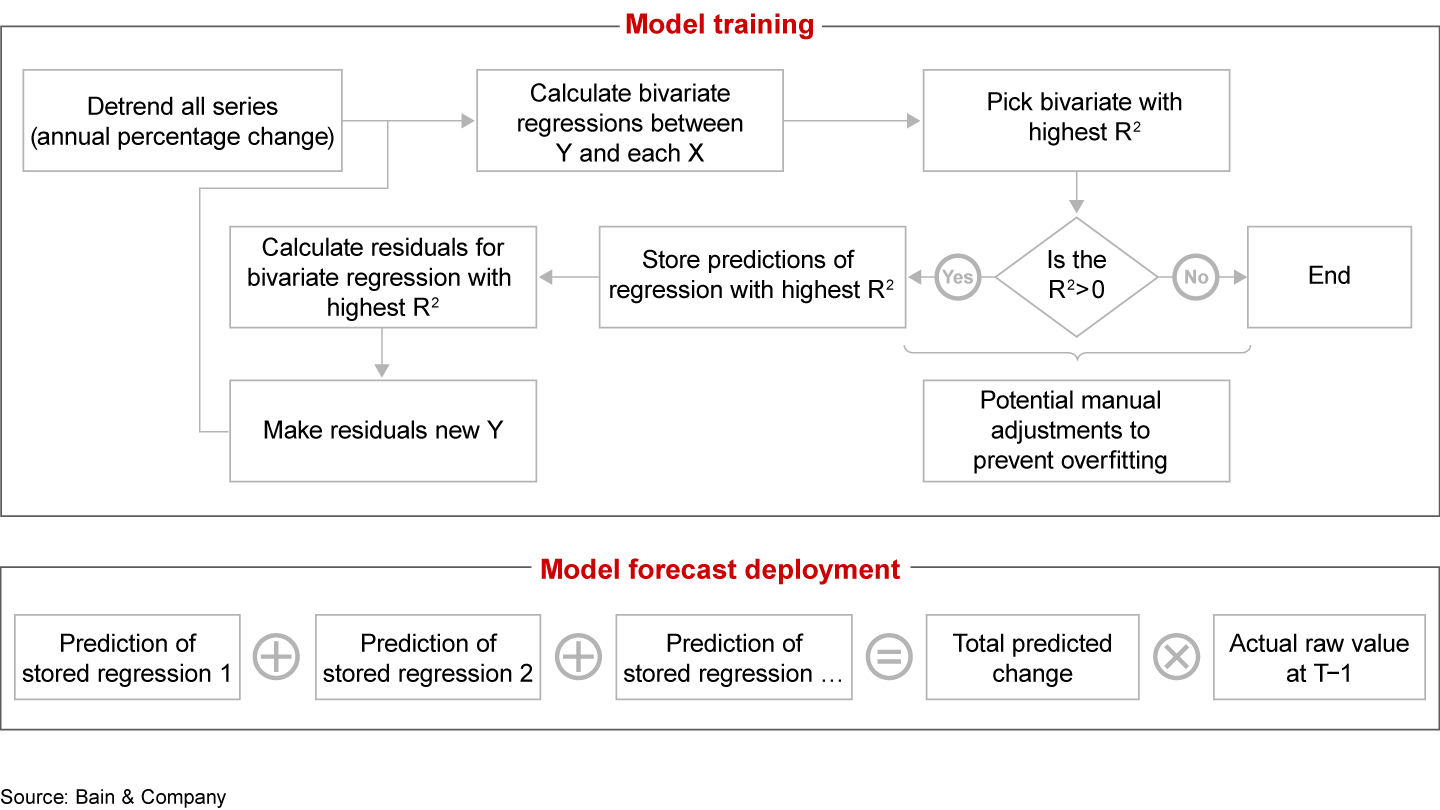
Instead, we focused on an alternative approach aiming for a proof of concept. In order to apply regressions that would be capable of integrating several predictors simultaneously, even with a limited N, we employed a nested bivariate regression technique (see Figure 1). Starting with the historical time series as an outcome variable, the approach considers the whole candidate set of independent variables and selects one bivariate regression with the highest explanatory power. We then store those predictions and make the respective residuals the new dependent variable for the next iteration, in which we again check all candidate predictors. Repeating this second step, we aim to reduce the error that our model generates, resembling ensemble learners that give model errors from previous iterations a higher weight in subsequent stages. After this training stage, all stored estimations are summed up to arrive at the final prediction values and calculate actual raw demand.

Still, this approach was not automatic enough to tackle our second challenge—namely, evaluating the model against holdout test data. To manually adjust for potential overfitting, we compared models with different candidate sets of predictors by triangulating three methodologies: visual inspection of how the prediction fits the historical curve, R² values, and the Akaike information criterion (AIC). The AIC can be a particularly valuable relative measure for prediction accuracy across several models when a test holdout set is not feasible. It measures how well the model can fit the data, and it penalizes models with a higher number of parameters. That’s a desirable feature because increasing the number of parameters raises the likelihood of overfitting.
Similar to other forecasts, but with insightful deviations
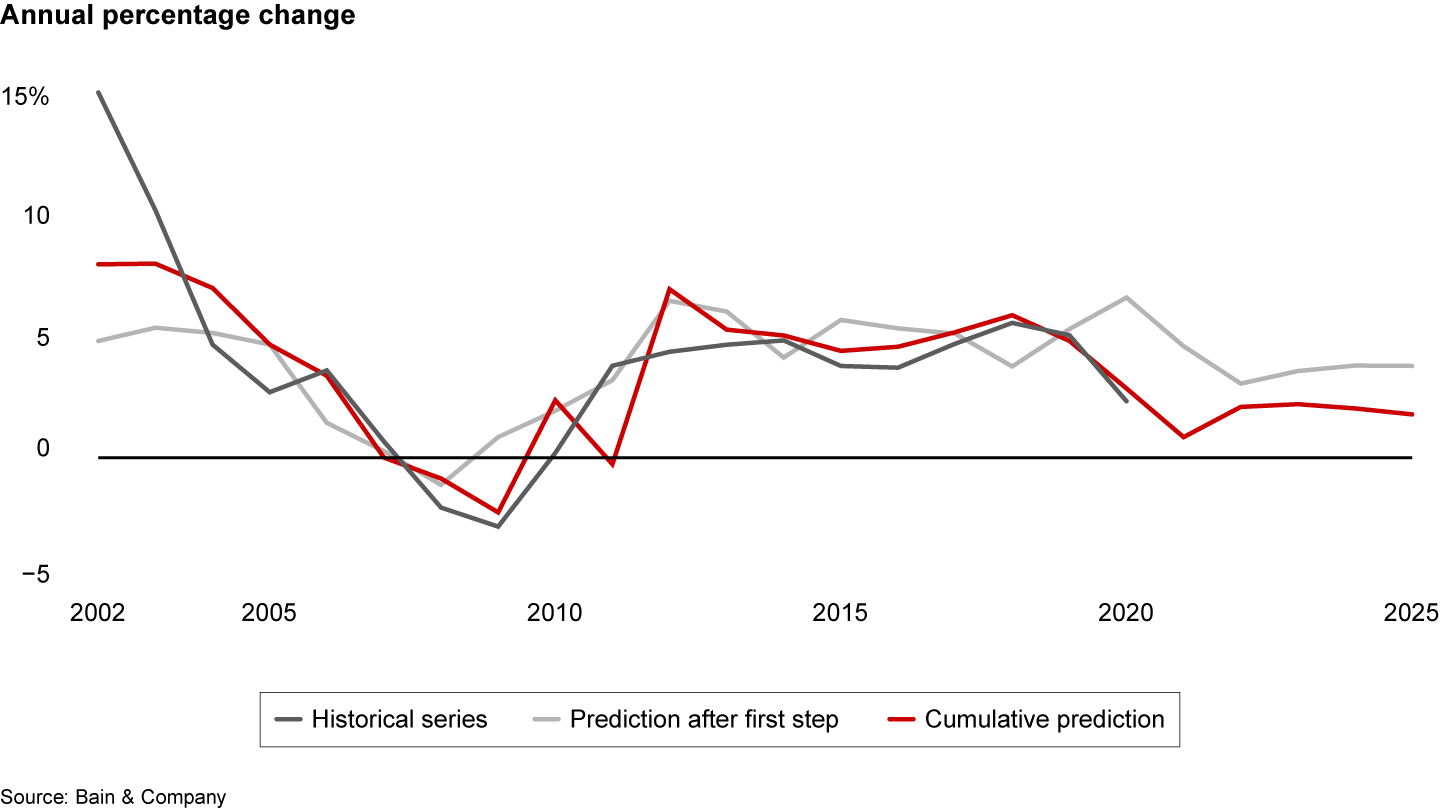
With the above measures in place, we could model and explain several insurance products in high-priority markets. Our work within the property and casualty market demonstrates how our stepwise-improved prediction better fits the historical series vs. the prediction taken from the first bivariate regression (see Figure 2).

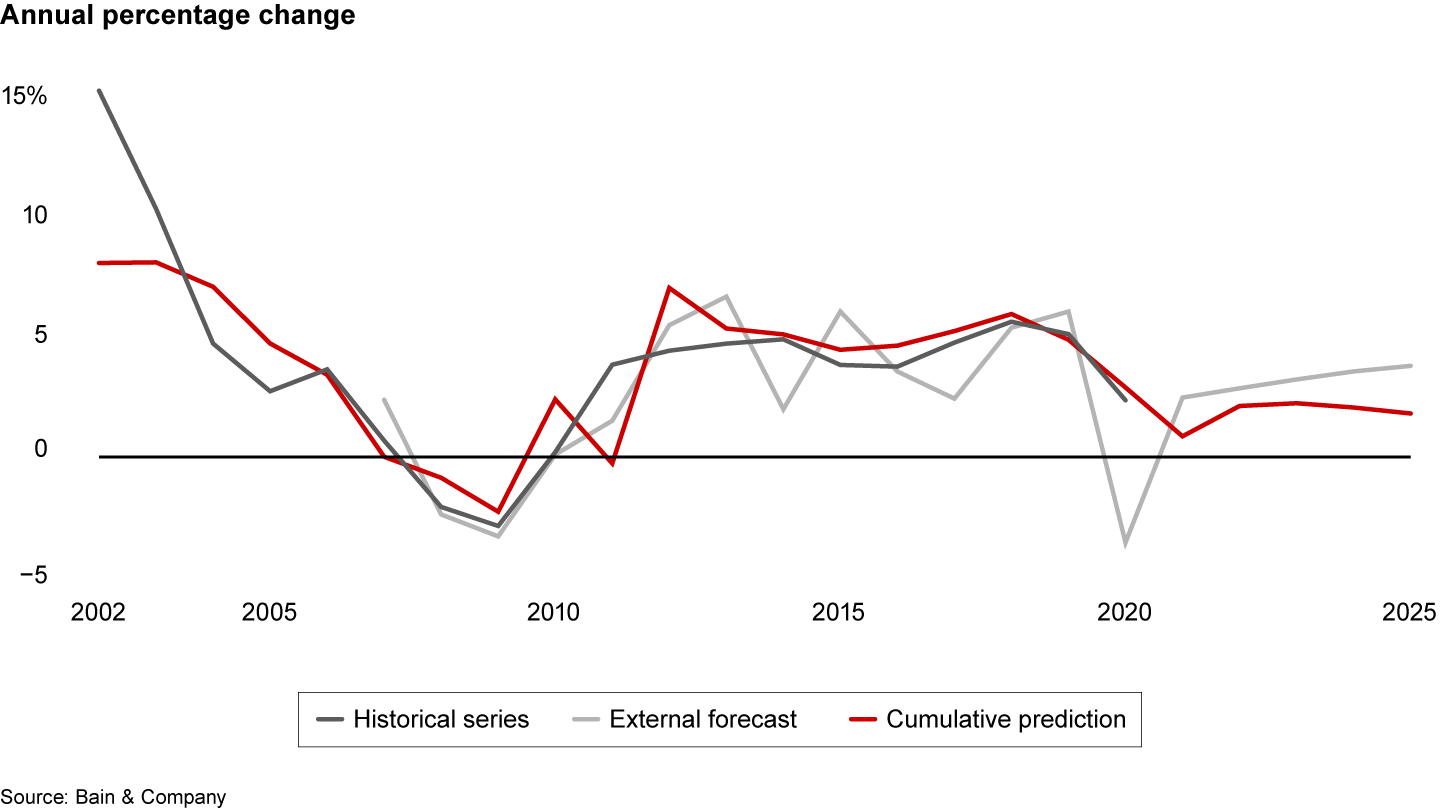
And one sort of robustness check uses forecasts from an external source. Our models often showed both similarities and interesting deviations from other forecasts (see Figure 3).

Refining the approach
The strengths of this novel approach lie in its comprehensibility and adaptability, both of which offer promising room for refinement. Expert opinions will feed into the reevaluation of models both in terms of fit and the choice of predictors. And in the tradition of bootstrap aggregation, we plan to accompany these inputs with a treatment of single years in our time series as random holdout years in order to better validate the accuracy of our models. These measures will allow us to hone the strengths and address the limitations of the approach as part of an expanded toolkit for small N time series in any industry where it’s relevant.


