The Visionary CEO’s Guide to Sustainability

This article is part of Bain’s 2023 CEO Sustainability Guide
In most industries, leadership positions have been stagnant for decades, with around 80% of profits typically captured by one or two players. Companies make incremental moves for incremental gains, but opportunities to leapfrog competitors or rewrite the future are few and far between.
The new focus on sustainability shatters that status quo. No matter their competitive position today, the moves that industrial B2B companies make in the next two to three years will determine their market position for the next decade and beyond.
Even so, green investments have become a source of strife in boardrooms around the world. Stakeholders are pushing to achieve sustainability commitments, but when organizations crunch the numbers, executives don’t feel there’s a solid business case. The investment in green solutions seems too large, too risky to pursue.
The issue is that most executives take a static view, considering today’s cost structures and scale. They plan a cautious, follower approach that tracks market prices and expands volume as the market grows, making a fast, profitable transition nearly impossible.
Winners, on the other hand, produce green solutions at the lowest cost possible to propel adoption and build a competitive advantage. They understand that a substantial early investment and quick scaling are critical to success. They burn cash, yes. But these market-making incumbents also create a new profit pool where they are the leader. It’s challenging, to be sure. But if they don’t take the risk first, a nimble insurgent will.
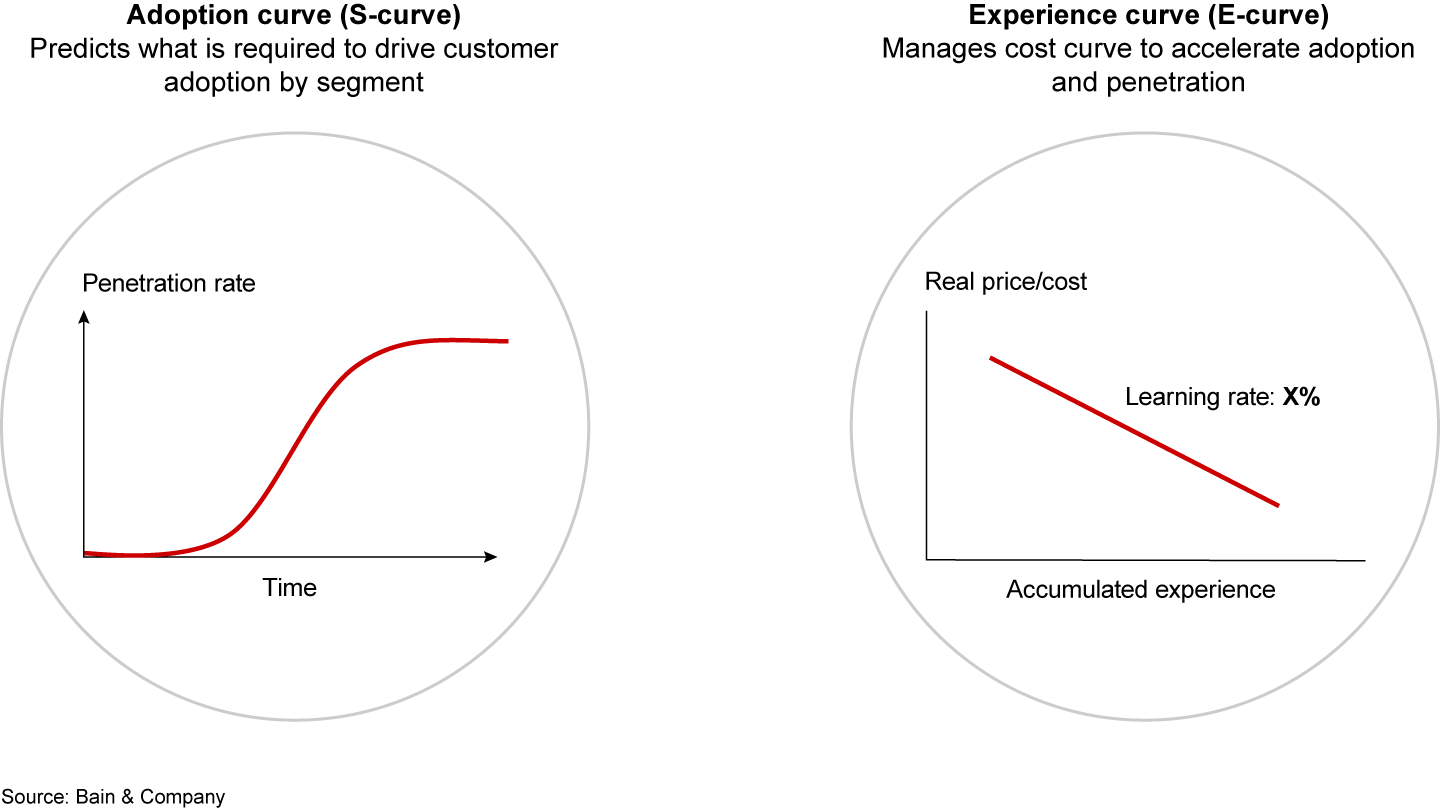
The key is to understand where you are in terms of your experience in bringing down cost (the E-curve) and where your customers are in terms of adoption (the S-curve) (see Figure 1). Bridging those two curves would seem to pose a conundrum: You can’t reduce your costs until you have a lot of customers, but you can’t win a lot of customers until your costs come down. We can show you how to close that gap.
Figure 1

Here’s our guide on how first-movers can assess their specific locations on the E- and S-curves, close the gap, and back bold ideas with bold investments and execution, to guarantee the risk pays off.
Two paths forward
Companies scaling a green solution typically fit one of two archetypes (see Figure 2). While either can be a path to market leadership, each requires a slightly different pace and approach.
Figure 2
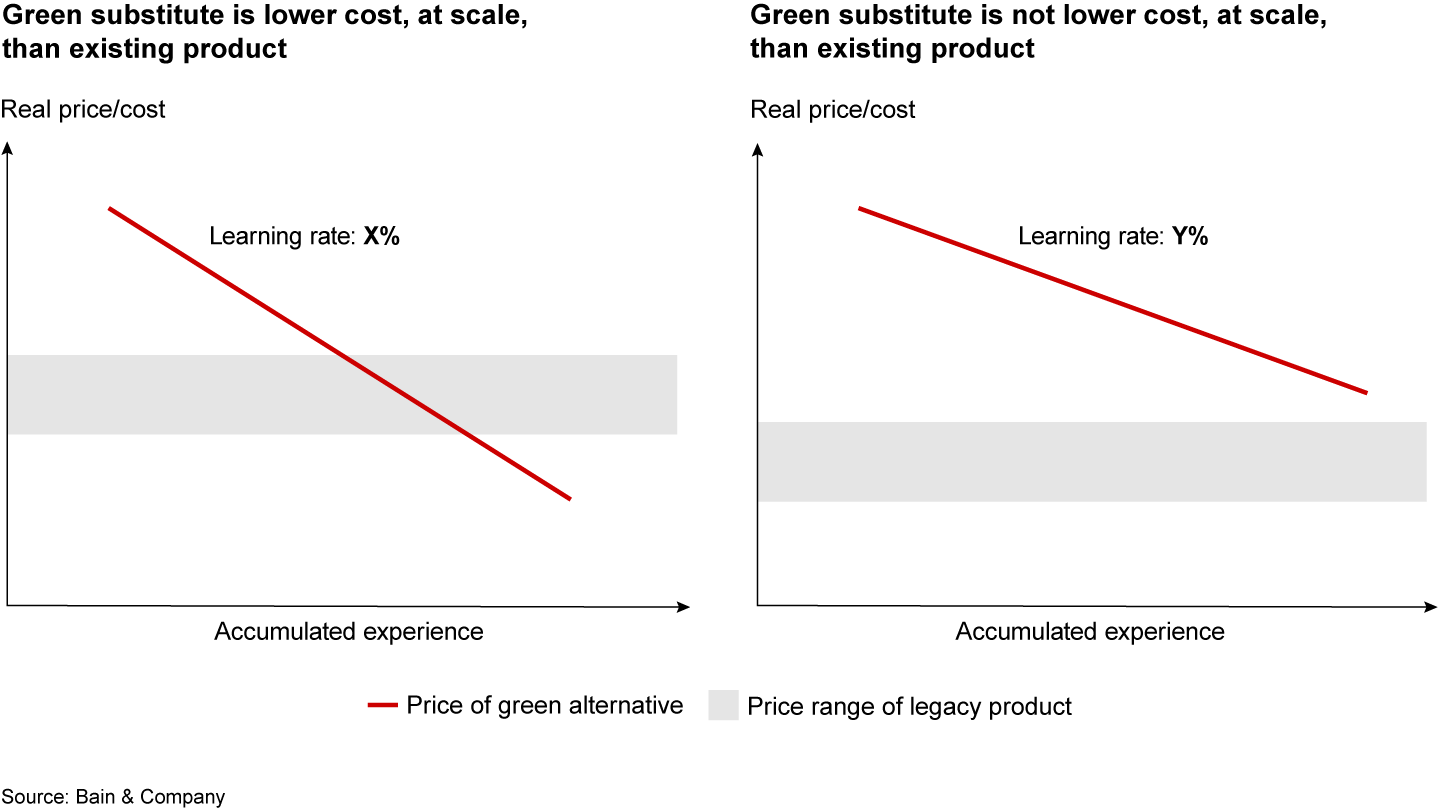

Firms in the first archetype find that their green substitute is lower cost, at scale, than the incumbent product. There’s high potential for first-mover advantage—in fact, if you move too slowly or price too high, you could lose the business.
In this scenario, pioneers adopt preemptive pricing to move down the E-curve as fast as possible, accelerating customer adoption. Their green alternatives often have almost identical characteristics and performance to existing products. As B2B buyers usually make rational purchase decisions, offering trials of green substitutes to showcase similarities can help boost adoption. These first movers are quickly rewarded with scale and cost advantage, as well as potential subsidies as regulations change.
A green solution won’t always be the lower-cost solution—but it’s still worth pursuing, given the direction of most industries. Firms in the second archetype will have no choice but to turn to green substitutes as environmental, social, and governance (ESG) regulations, such as carbon taxation, increase their costs. In this case, leading companies focus on a more value-based pricing strategy, targeting those willing to pay more for green alternatives first. These companies understand that moving too fast could hurt their current business, so they take a slower approach to investing in and scaling the new business, often focusing on just one product or a select segment of the product portfolio. As a result, companies in the second archetype capture a more moderate first-mover advantage.
The E- and S-curve interlock
To determine the right pace and level of investment, winning companies tear down the organizational silos that have historically separated commercial teams from operational and procurement teams. They connect the E- and S-curves in four steps.
Step 1: Green solution innovation
Companies can start by brainstorming potential green substitutes for their current product portfolio. Leaders can prioritize the options based on the greatest potential to scale, the biggest impact in achieving sustainability goals, and the level of disruption to current operations.
Questions to get started:
- What are the potential green substitutes—for today and for a decarbonized world?
- Which have the greatest potential to scale? Which will best help us achieve our sustainability goals?
- How much would each green substitute disrupt our current operations?
- Which should we prioritize for our assessment?
Step 2: E-curve analysis
Future market leaders will develop E-curves for existing solutions, based on historical industry pricing, relevant costs, and expected future moves from scale and regulation. They do the same for potential green substitutes, considering their technology capabilities and anticipated future scale and experience. With these E-curves, companies can pinpoint if, and when, their green substitute will become cheaper than the incumbent solution.
Questions to get started:
- What does the E-curve look like for our selected green substitute? What is our level of technological readiness? How are decarbonization regulations and taxes affecting the E-curve?
- Which industry players, if any, are already transitioning?
- Which archetype does our green substitute most closely fit?
- Can we bring down costs with operational performance improvements or product innovation?
Step 3: S-curve analysis
Following an assessment of current green substitute adoption by end-market, leading companies determine which customer segments are primed for green solution adoption based on:
- the customer’s benefit from avoiding carbon cost;
- the importance of sustainability commitments to investors and stakeholders;
- the value to the end consumer;
- forecasted supply-demand dynamics; and
- potential changes to the regulatory environment and investor commitments.
When determining the expected adoption curve, these companies first focus on customer segments that stand to benefit most—and are willing to pay. They also forecast and monitor adoption across different segments over time.
Questions to get started:
- Where are our customers on the S-curve? What is the level of penetration for green substitutes?
- What are the relevant customer segments? Which customers benefit most from a green solution?
- How does this differ by region or application? What are the effects of regulation, like taxation or subsidies?
- What are the greatest barriers to adoption?
Step 4: Value creation plan
Armed with a clear understanding of where they stand on the E- and S-curves and what they need to do to bridge the gap, leading companies then develop a dynamic strategy that delineates short-, medium-, and long-term actions. They identify no-regret moves (such as partnerships), big bets (such as scale acquisitions), and signposts (such as regulatory changes); map resource allocation and investment over time; and dedicate a team to evaluating performance outside of the strategic planning cycle.
Questions to get started:
- What is the roadmap to becoming a market maker? Do we need preemptive pricing?
- What no-regret moves can we take now? What big bets should we consider?
- What are the signposts to monitor and adjust our strategy over time?
- What are the financial implications for capex and resource allocation? What are the financial incentives?
- How can we evaluate our performance and follow through on the transformation?