Brief
Executive summary
The growth of the fast-moving consumer goods (FMCG) market continued to slow in China in 2013. Fierce competition among brands and thriftier shoppers mean that marketers can no longer grow a brand just by riding a category wave. Gaining market share is imperative, and market penetration is the primary way to achieve it, as we established in our 2012 and 2013 China Shopper Reports.
For the third year, Bain & Company partnered with Kantar Worldpanel to study the shopping behaviors of 40,000 Chinese households. Our unconventional approach assigned research participants with barcode scanners to determine what they actually purchased, as opposed to what they said they had purchased.
We studied 106 FMCG categories and analyzed in detail 26 categories spanning the four largest consumer goods sectors: personal care, home care, beverage and packaged food, which account for more than 80% of China’s FMCG market in value. Our study helped us gain invaluable insights into how shoppers make purchases in these 26 important consumer goods categories.
Building on the research we began in 2012, we continue our exploration of the major trends affecting China’s FMCG market in this year’s China Shopper Report. This is the first of two volumes and focuses on three key trends:
- Continuing deceleration of China’s FMCG market across sectors and all city tiers
- Fewer store visits to offline retailers as online commerce boomed
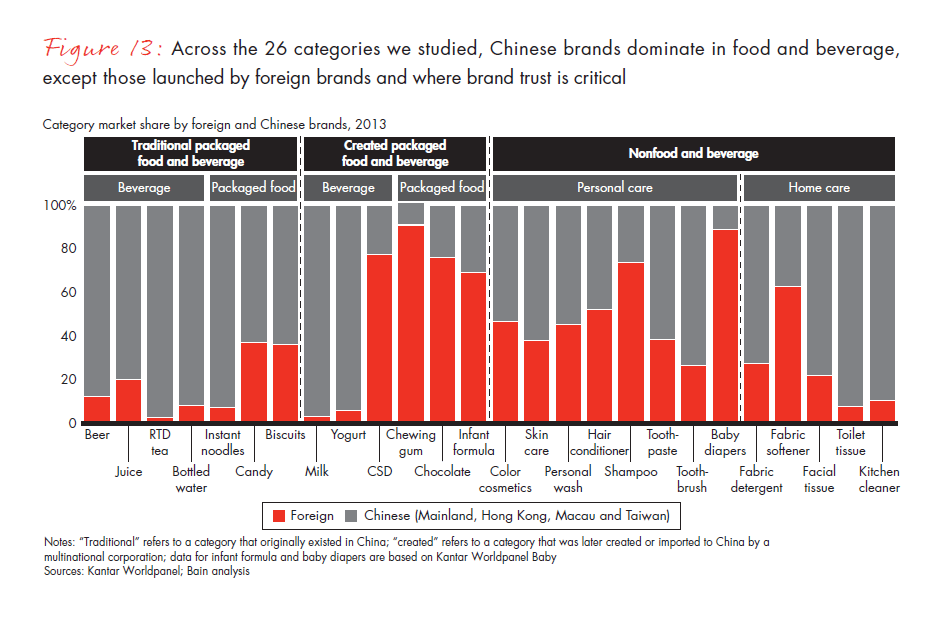
- Foreign brands’ continued loss of aggregate share to Chinese brands for the 26 categories we analyzed
China’s decelerating FMCG market
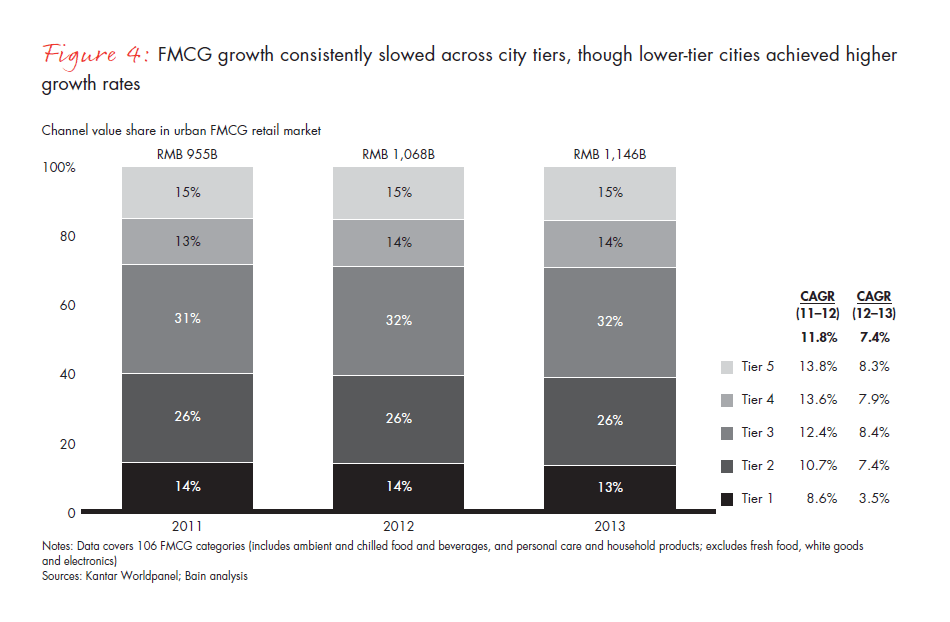
Growth continued to slow across all the FMCG sectors we studied—packaged food, beverage, personal care and home care—and across all city tiers, though lower tier cities grew at higher rates. In higher tier cities, which are still the primary markets for FMCG, growth declined from 2012 to 2013 compared with growth from 2011 to 2012. In Tier 1, it dropped from 8.6% to 3.5%; in Tier 2, from 10.7% to 7.4%; and in Tier 3, from 12.4% to 8.4%.
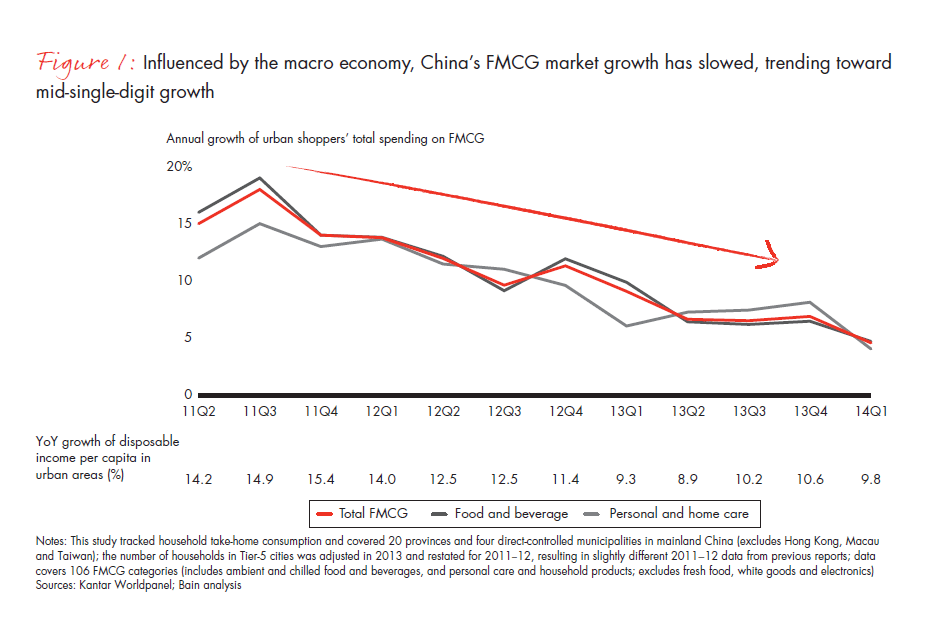
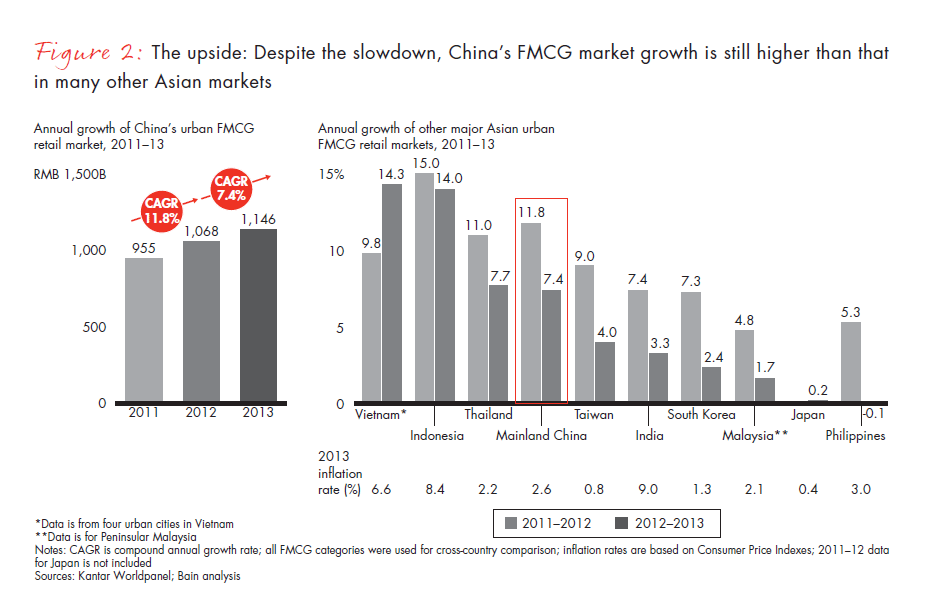
FMCG growth, which was 15% nearly three years ago and around 12% in 2012, slowed to 4.6% in the first quarter of 2014. That trend suggests mid-single-digit growth ahead—though China’s annualized FMCG growth still remains higher than growth in many other Asian markets.
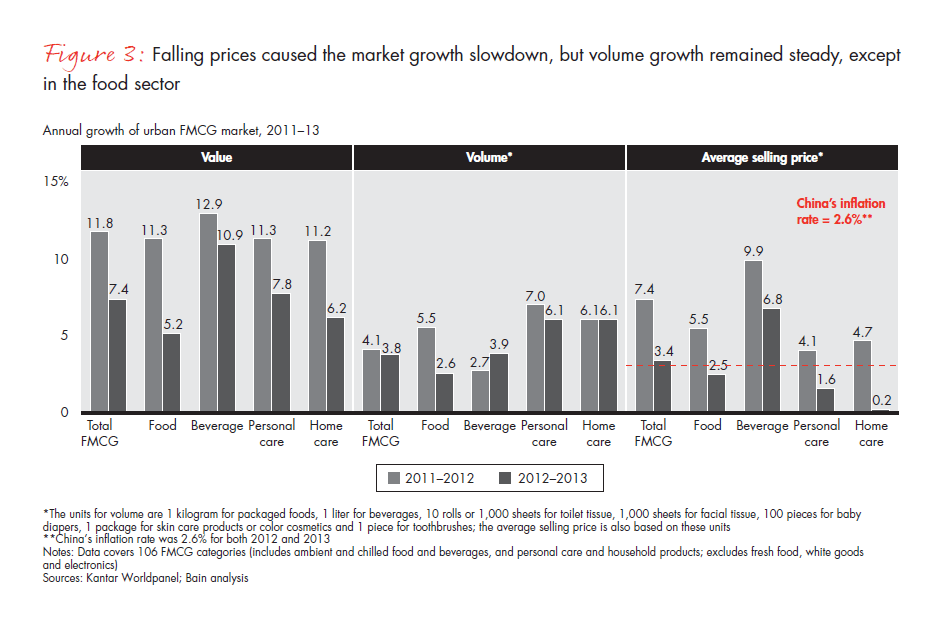
One reason for the deceleration: The pace of premiumization slowed noticeably. In the past, the FMCG market grew as a result of price increases, new product innovations and the introduction of more premium SKUs at higher price points. With premiumization slowing, price increases fell sharply across all four sectors.
The good news is that volume growth across sectors remained stable with the exception of packaged food. In the beverage sector, volume growth increased from 2.7% to 3.9%. For both personal care and home care, the 6% growth in 2013 was similar to that in 2012. And in packaged food, growth decreased from 5.5% to 2.6%, because an unusually long, hot summer affected sales.
Though the growth of disposable income and annual spending per household decreased, according to China’s National Bureau of Statistics, the number of urban households steadily increased at 2.6% per year, contributing to volume growth.
Challenging offline and booming online
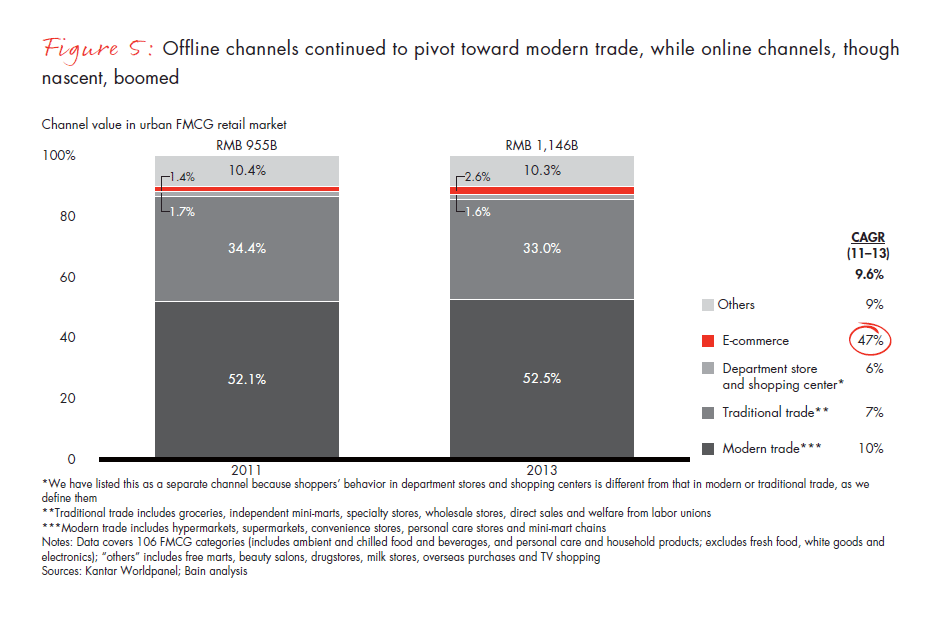
Offline shopping channels represented 97% of all FMCG purchases, as purchasing behaviors continued to shift toward modern trade, which mainly includes supermarkets and hypermarkets.
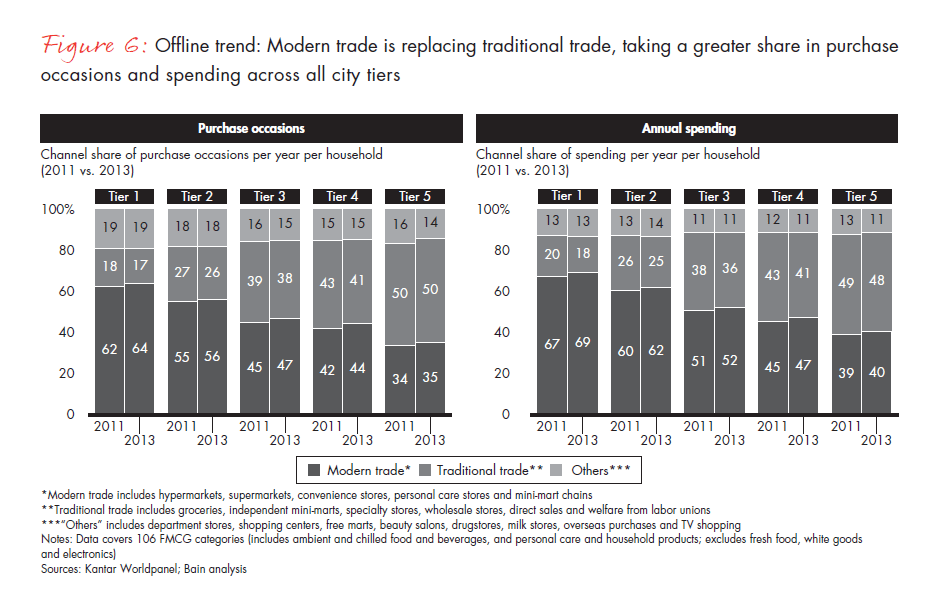
Modern trade accounted for more than 50% of FMCG market value. Growing at a brisk 10% per year, it has surpassed traditional trade in scale and growth, gradually taking more share in purchase occasions and spending—a trend consistent across all city tiers.
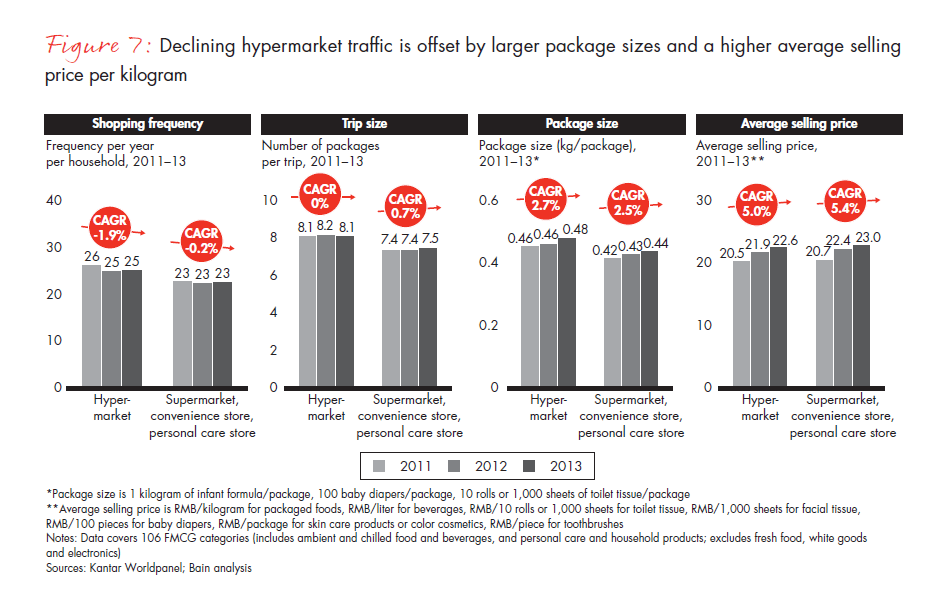
Hypermarkets saw store visits per household decline in the past two years, from 26 visits per year per household in 2011 to 25 visits in 2012 and 2013. Smaller modern trade formats—supermarkets, convenience stores and personal care stores—saw no decrease in visits at 23 per year per household. Declining hypermarket visits, however, were offset by larger package size and with increased car ownership in major Chinese cities making it convenient for shoppers to purchase and transport larger items.
Another reason hypermarket visits declined: The growth of prepaid cards for retail use slowed. Prepaid cards, which are given to Chinese consumers as public welfare or as gift cards, are used mainly in hypermarkets, supermarkets and department stores. The slowdown in their use was the result of the Chinese government’s anticorruption efforts targeting card misuse.
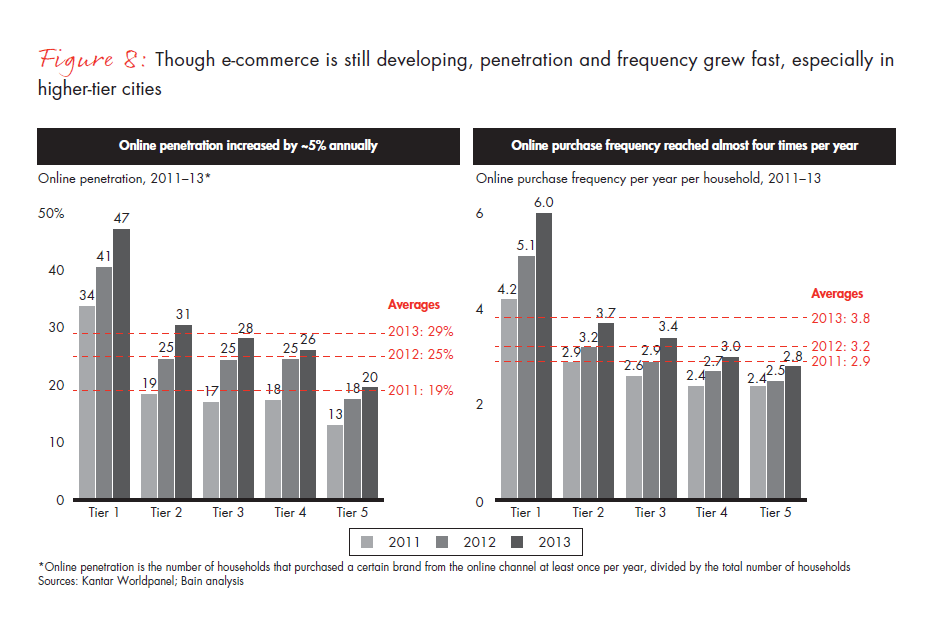
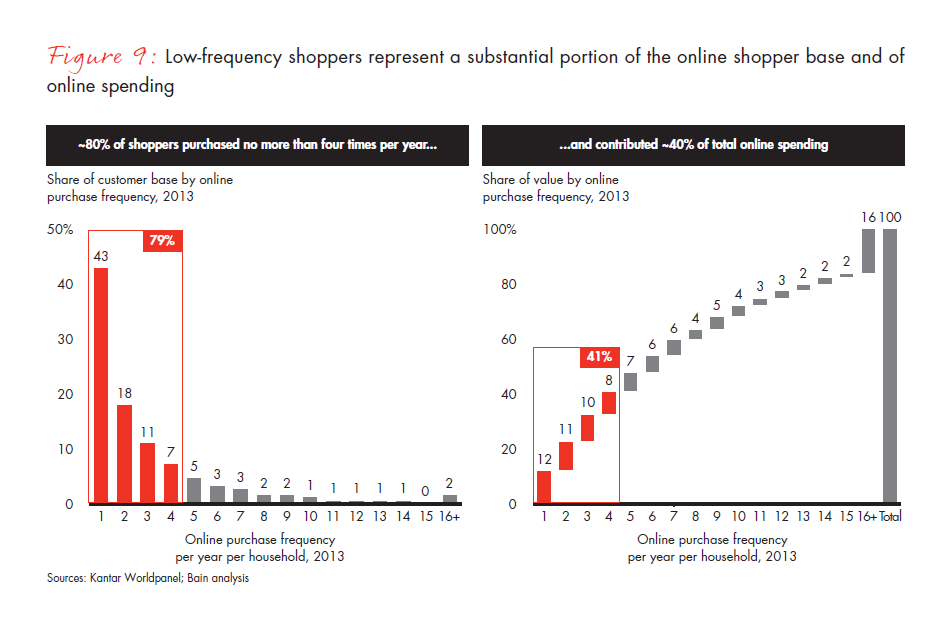
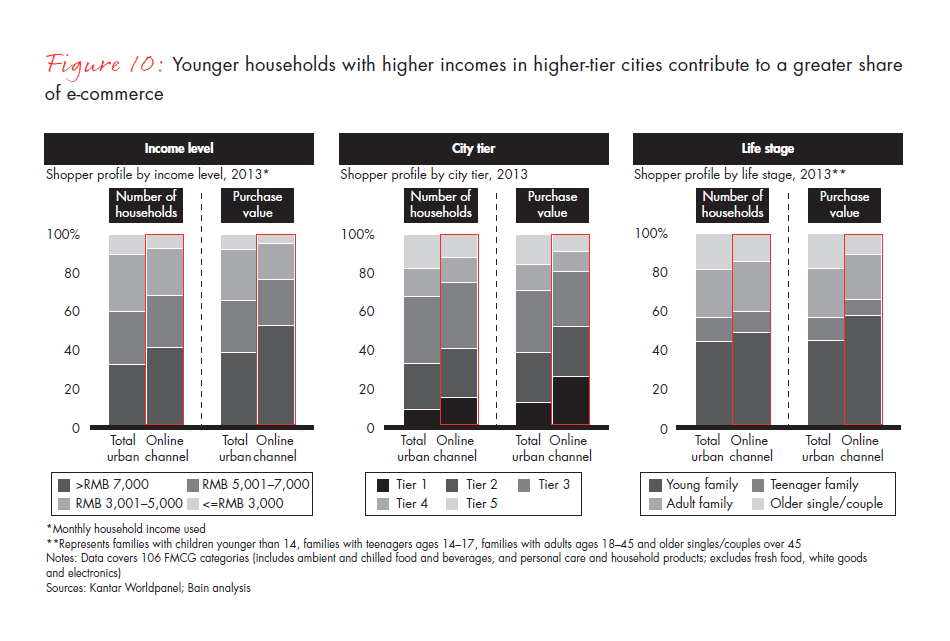
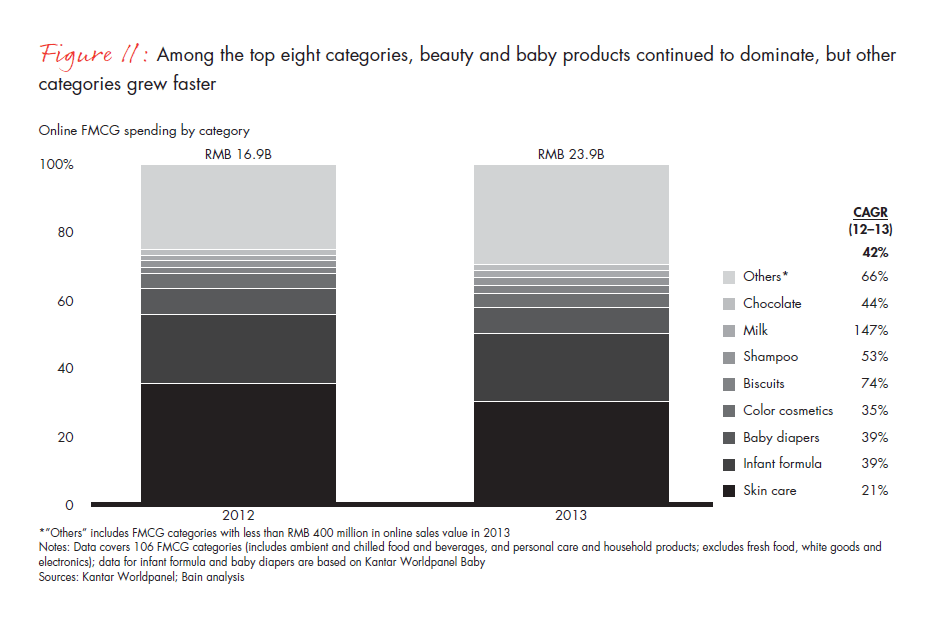
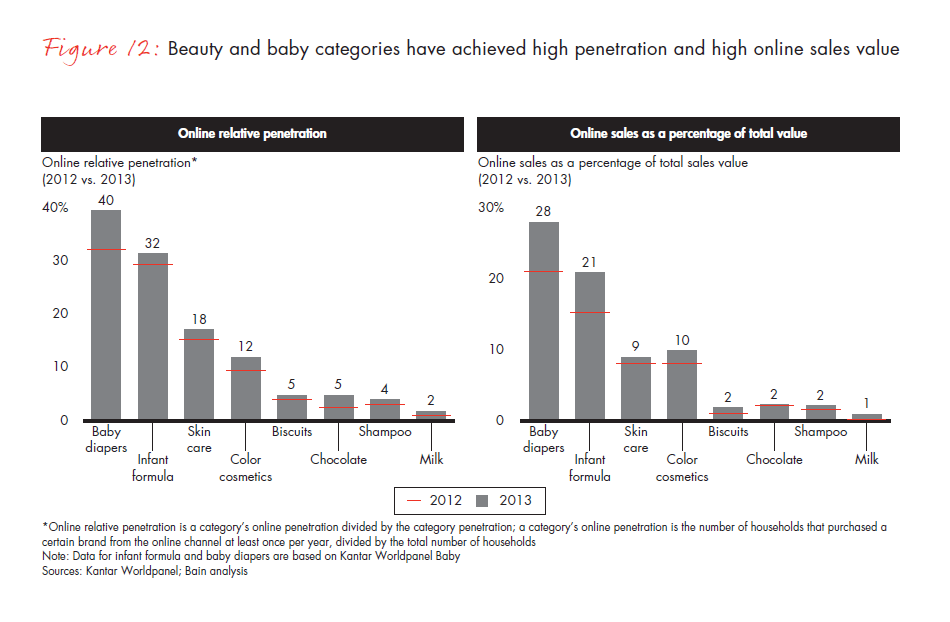
The online FMCG channel, though nascent, is booming, as Chinese shoppers are more willing than shoppers in other markets to use their smartphones and PCs to make purchases. As a result, China is now the No. 1 digital retail market in the world in both value and penetration, with momentum expected to continue. All 106 categories we studied enjoyed high online growth—42% overall. Young urban households in higher tier cities with incomes of more than RMB 7,000 per month make up the largest percentage of e-commerce shoppers. Consistent with previous years, baby products and beauty products are highly penetrated categories with high online value share.
Chinese vs. foreign brands: Winners and losers
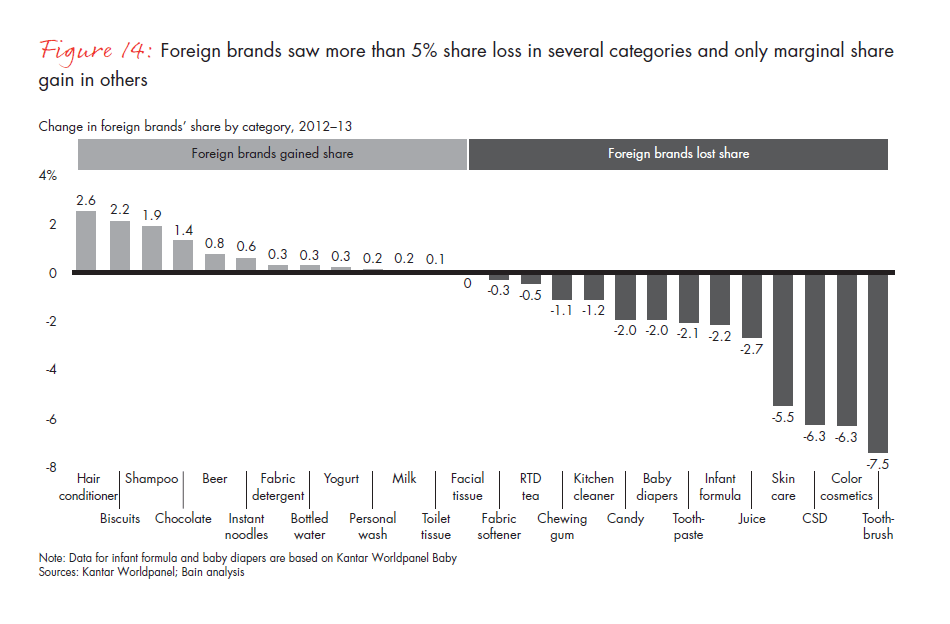
Fierce competition from Chinese companies in 2013 resulted in foreign brands losing overall share across the 26 categories we studied in detail. But the picture is different by category: While foreign brands lost share in many categories, including carbonated soft drinks, skin care, juice and infant formula, they achieved marginal share gain in some categories, such as hair conditioner and biscuits.
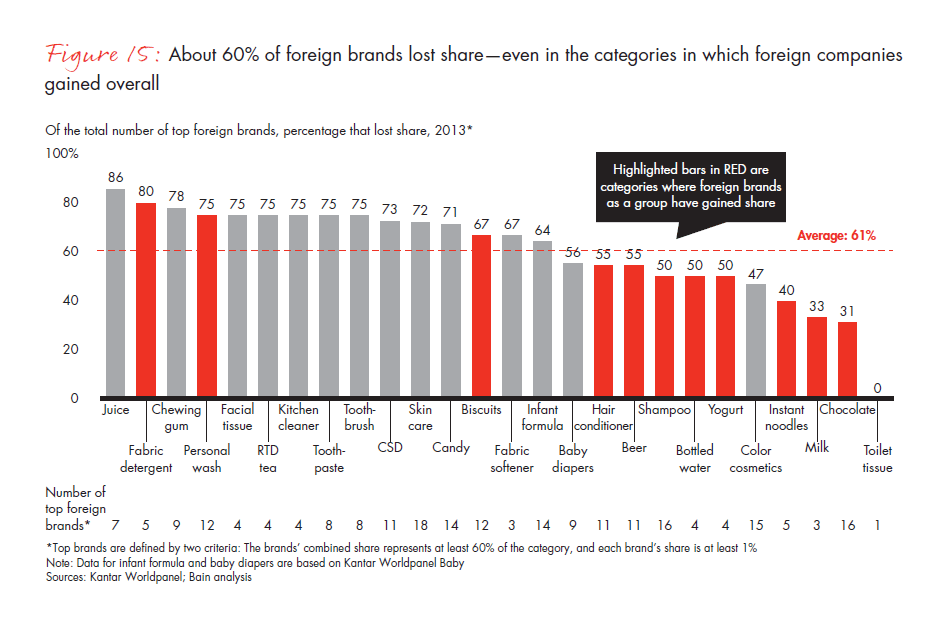
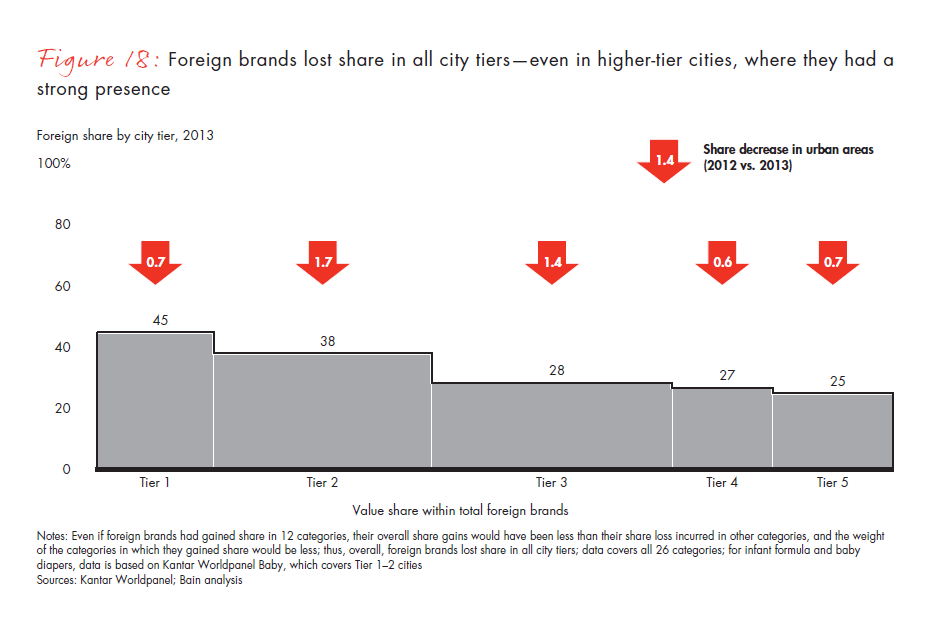
Nonetheless, on balance, 60% of the foreign brands we studied lost share this year; many even lost share in the categories in which foreign brands experienced overall share gains. The share loss occurred across all city tiers—even higher tier cities, where foreign brands enjoyed a relatively strong presence.
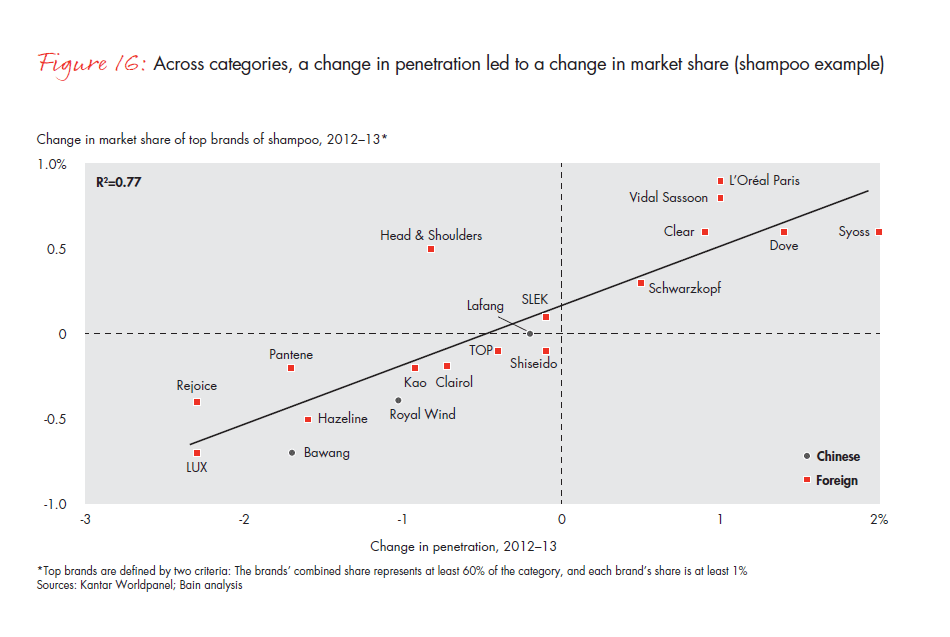
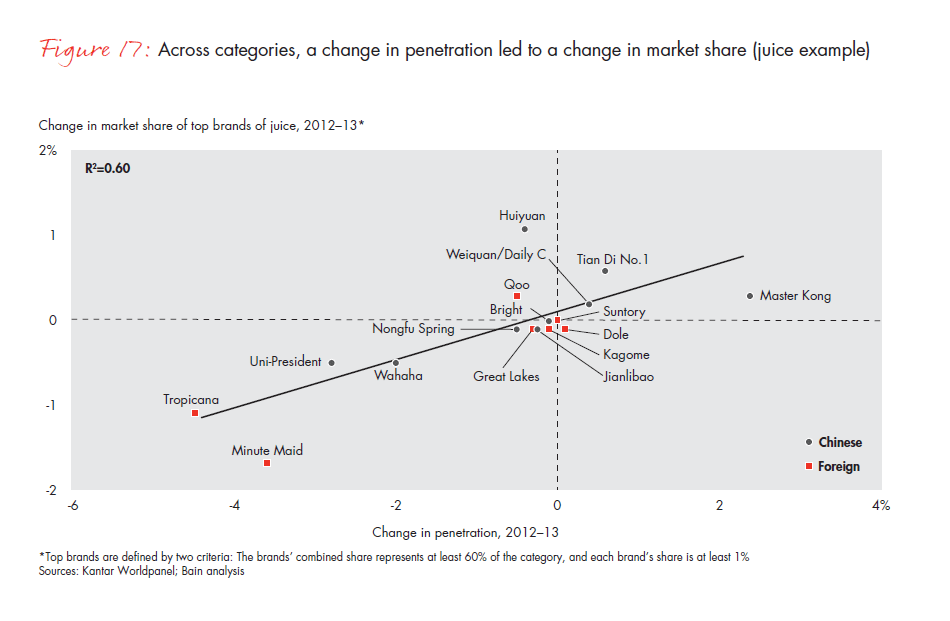
As one could expect, this change in market share is driven by change in penetration.
Implications: The market share imperative
As Chinese shopper behaviors continue to shift and evolve, marketers can no longer coast by simply riding a category wave. Growth must come primarily from share gain. And penetration change is the most important way to achieve share change.
Our first volume of the 2014 China Shopper Report by Bain & Company and Kantar Worldpanel, along with the 2012 and 2013 reports, shows that marketers must drive penetration to gain market share. In an upcoming volume, to be released in the fall of 2014, we will share more details about how marketers can do this.
Building penetration depends on continually building brand consideration—the percentage of consumers who consider your brand for a purchase occasion—which in turn helps increase penetration. The steady path for earning consideration and penetration requires investment in three brand assets:
- Memory structures. By using the full range of above-the-line (ATL) and below-the-line (BTL) marketing touch points, marketers can anchor a brand in consumers’ long-term memories. Winning companies broadcast distinct, memorable messages to the largest possible swath of consumers.
- Product portfolios. Too many brands and SKUs can result in ineffective advertising, shopper confusion and other perception woes that erode penetration. Surprisingly few innovations result in increased penetration. They fail at a high rate and distract marketing and commercial teams from supporting core SKUs. Winning brands identify critical “hero” SKUs that have the highest potential to win with shoppers.
- In-store assets. Once you target the most important SKUs, it’s essential to adequately invest to activate them at the point of sale and ensure they’re always available at the right place on the shelf. Leading companies identify which store assets are critical to own in their category.
Given that China is now the world’s No. 1 digital retail market, marketers—especially those in the leading online categories—will benefit from developing an e-commerce business model. The online channel can be used as an incremental channel to further build these three brand assets and expand business, while minimizing cannibalization with offline channels.
Though e-commerce is booming, offline channels are still the main battlefield. It’s critical for marketers to maximize offline business potential by leveraging online traffic through effective digital marketing and integrated solutions—what’s known as “O2O” (online to offline).
2a. China’s decelerating FMCG market
- FMCG growth continued to slow across all sectors we studied (packaged food, beverage, personal care and home care).
- In the first quarter of 2014, FMCG growth slowed to 4.6%, the lowest in three years and a big drop from the 15% growth it saw in the second quarter of 2011.
- One reason for decelerating growth: The pace of premiumization slowed, and as a result, price increases in 2012 to 2013 were smaller than the increases in 2011 to 2012 across all four sectors. Price increases for packaged food dropped from 5.5% to 2.5%; for beverage, from 9.9% to 6.8%; for personal care, from 4.1% to 1.6%; and for home care, from 4.7% to 0.2%. Worse, some sectors, in particular, personal care and home care, had average selling price increases that fell below the 2.6% inflation rate.
- Volume growth was more stable, with the exception of the packaged food sector, where sales were affected by an unusually long, hot summer in 2013. Volume growth in packaged food declined from 5.5% to 2.6%, while volume growth in the beverage sector increased from 2.7% to 3.9%.
- The overall slowdown in the FMCG category over the last two years is mostly a result of a decrease in annual spending per household—a drop from 9% in 2012 to 4.6% in 2013—while the number of households continued to increase at approximately 2.6% per year.
- FMCG growth consistently slowed across all city tiers, though in lower tier cities it grew at higher rates. Higher tier cities, still the primary markets for FMCG, saw declining growth—in Tier 1 decreasing from 8.6% to 3.5%; in Tier 2, from 10.7% to 7.4%; and in Tier 3, from 12.4% to 8.4%.
- China’s FMCG growth slowed from 11.8% in 2012 to 7.4% in 2013; however, it is still higher than FMCG growth in many other Asian markets.
2b. Challenging offline and booming online
- Offline shopping channels represented 97% of FMCG purchases in 2013, with a continued shift toward modern trade.
- Modern trade, which has surpassed traditional trade, is growing at 10% per year and accounted for about half of FMCG market value. It is gradually replacing traditional trade, a trend consistent across all city tiers.
- But modern trade saw a decline in store visits in 2013, especially in hypermarkets, where visits per year per household decreased to 25 in 2012/2013 from 26 in 2011. This drop was partially driven by the declining growth of prepaid cards for retail use as Chinese authorities targeted card misuse. Smaller modern trade formats—supermarkets, convenience, personal care—saw no decrease at 23 visits.
- Declining visits were offset by larger package size; increased car ownership in major Chinese cities allows shoppers to transport larger items. Though price increases have been smaller since 2011, the average selling price per kilogram rose about 3% in 2013 in hypermarkets.
- The online FMCG channel, though nascent, is booming. Chinese shoppers are more willing than shoppers in other markets to purchase items with smartphones and PCs (see the Bain Brief “China’s e-commerce prize”). As a result, China is now the world’s No. 1 digital retail market.
- Young urban households in higher tier cities with higher incomes represent the largest group of e-commerce shoppers: Households with incomes of more than RMB 7,000 per month, young urban households and households in Tier 1 to Tier 3 cities contribute 53%, 58% and 52% of online purchases, respectively.
- All 106 categories enjoyed high online growth—42% overall. Consistent with previous years, baby products and beauty products enjoy high penetration with high online value share: baby diapers at 28%, infant formula at 21%, skin care at 9% and color cosmetics at 10%.
- In most categories, the top online and offline brands share similarities; however, the brands with higher online market share have a winning digital strategy. In some categories, online-focused brands have a stronger market position than offline-focused brands. Consider infant formula: Online-focused brands Karicare, Nutrilon and Friso have a much higher market share online vs. offline.
2c. Chinese vs. foreign brands: Winners and losers
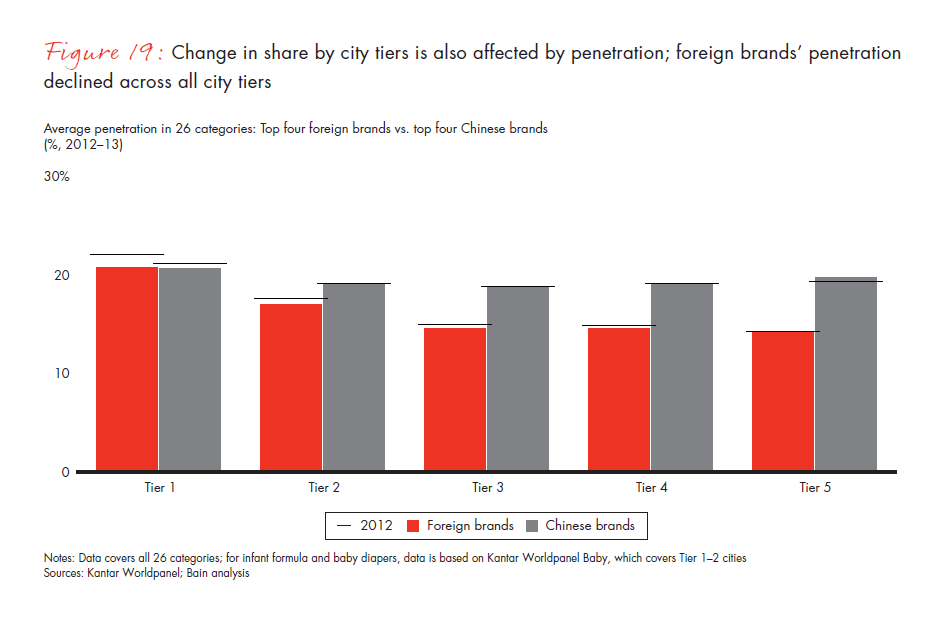
- Foreign brands, experiencing fierce competition from Chinese brands, lost share across the 26 categories we studied as Chinese companies continued to increase penetration in 2013. The picture differs by category.
- In many categories, foreign brands lost share. In carbonated soft drinks, they experienced 6.3% share loss, while domestic brand Wahaha Kvass increased share by 3.8% through new product innovation and large-scale ATL and BTL marketing, according to Kantar. In skin care, foreign brands lost 5.5% share as domestic brands gained: Pechoin increased share 0.8% through integrated product and brand upgrades and celebrity endorsements; Proya added 0.7% share by increasing penetration in emerging channels, such as personal care stores, and through celebrity endorsements. Foreign brands also lost 2.7% share in juice, while national brand Huiyuan gained 1.1% by promoting its “100% fruit juice” concept and launching new flavors, including sugarcoated haw drinks. Tian Di No. 1, another domestic juice brand, gained 0.6% share with its healthy concept fruit vinegar. Foreign brands lost 2.2% share in infant formula; sales were hurt by word-of-mouth unsubstantiated claims of contaminated ingredients.
- Foreign brands, however, achieved marginal share gain in some categories. Foreign hair conditioner brands gained 2.6%: Schwarzkopf gained 1.2% by launching a professional line and L’Oréal Paris gained 1.1% by launching an essential oil line alongside aggressive ATL and BTL marketing. Foreign biscuit brands gained 2.2% share: Chips Ahoy gained 0.3%, thanks to substantial ATL spending, expanded shelf space and a new flavor launch, and Danisa gained 0.4% through effective trade spending and in store execution, including out-of-shelf displays, according to Kantar.
- On balance, about 60% of foreign brands lost share—many even lost in categories in which foreign brands gained share overall.
- Share loss affected all city tiers—even higher tier cities, where foreign brands had enjoyed a strong presence. The largest loss occurred in Tier 2 and Tier 3 cities, where foreign brands have a relatively strong presence. Share decreased 1.7% in Tier 2 cities and 1.4% in Tier 3 cities. Share loss also occurred in lower tier cities, where foreign brands have a weaker presence.
- Penetration change is the primary driver of underlying share change in both categories and city tiers.
This report is a joint effort between Bain & Company and Kantar Worldpanel. The authors extend gratitude to all who contributed to this report, in particular Chris Wang and Wilson Fu from Bain & Company, and Rachel Lee, Tina Qin and Tony Xue from Kantar Worldpanel.