レポート

概要
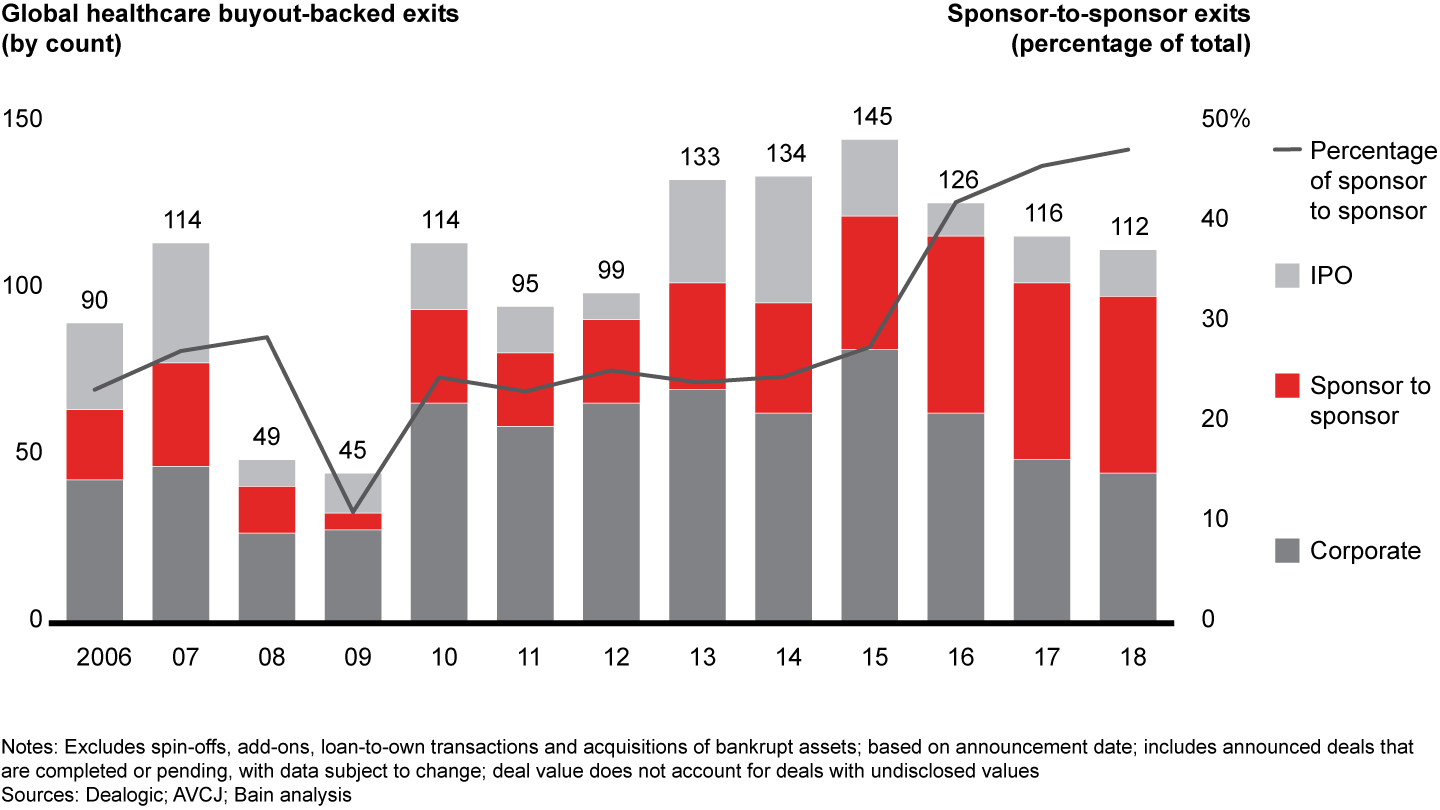
- Global healthcare PE exits were relatively flat at 112 deals in 2018 vs. 116 in 2017 as volume stabilized following the clearance of recession-vintage assets.
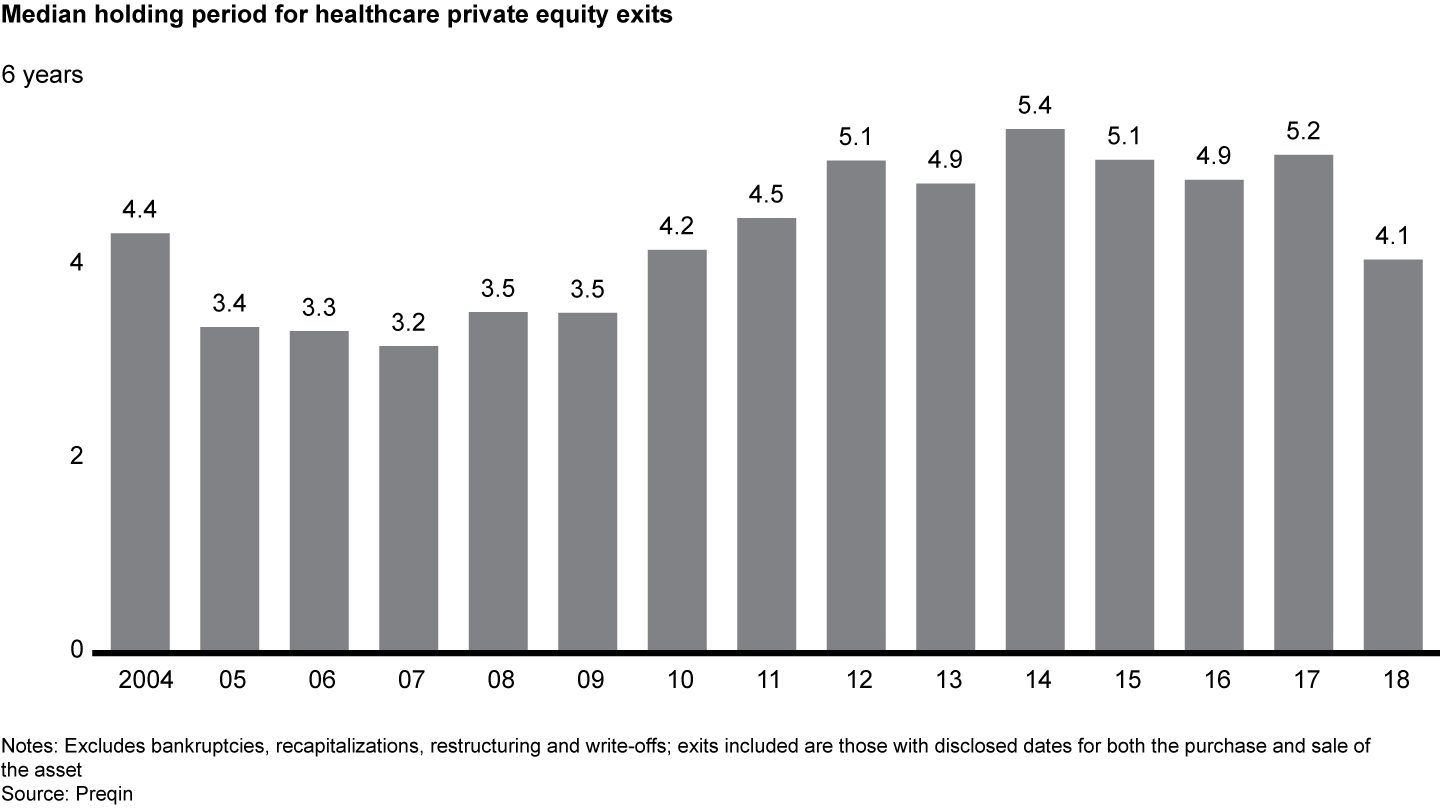
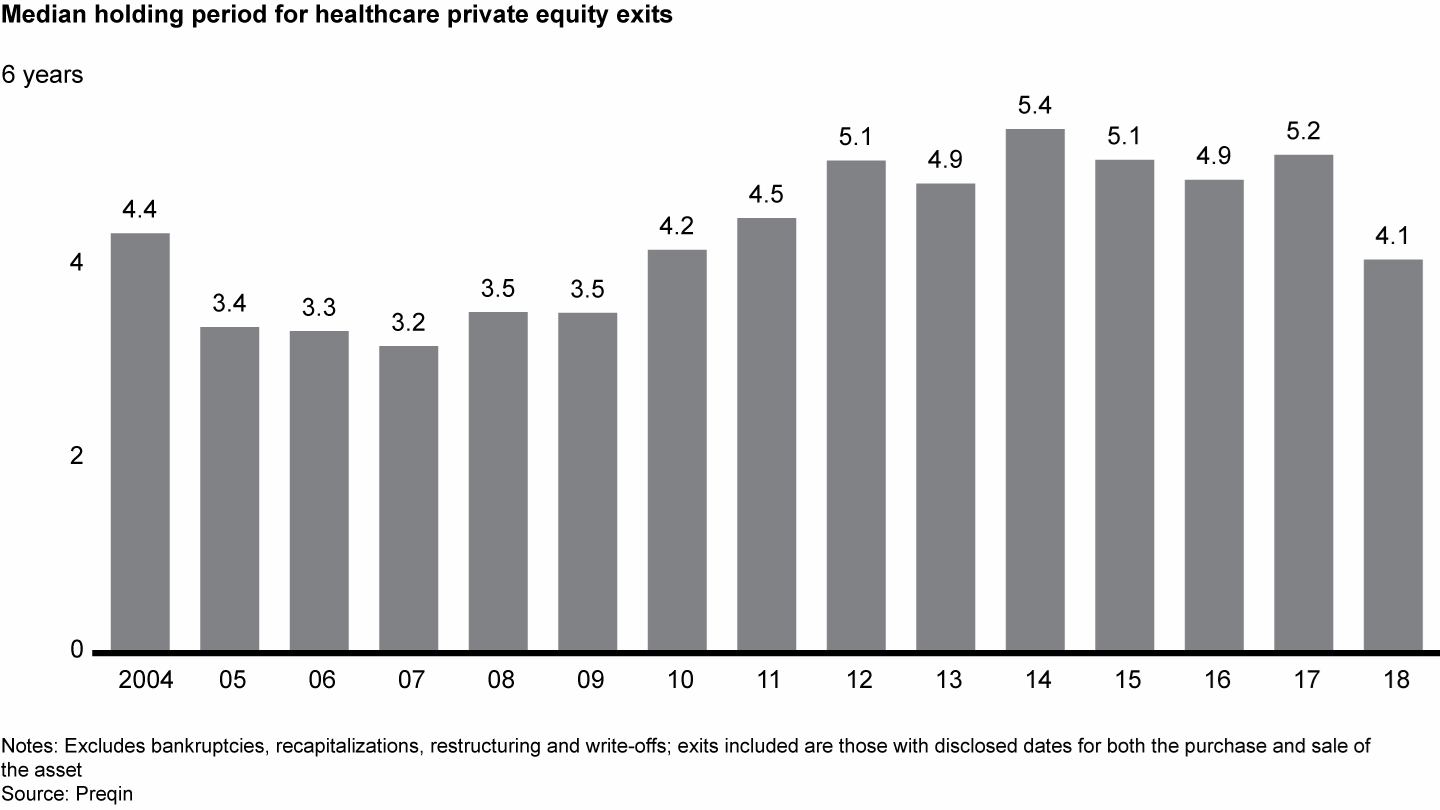
- The median holding period for 2018 exits declined to a more typical long-term level of 4.1 years, the lowest level since 2009.
- Sponsor-to-sponsor transactions made up an increasingly large portion of exits—47% in 2018 vs. 28% in 2015—reflecting ample appetite for healthcare deals.
- Total disclosed value fell again from $44.4 billion in 2017 to $31.6 billion in 2018, led by a $13 billion decline in the value of exits to corporates.
This article is part of Bain’s 2019 Global Healthcare Private Equity and Corporate M&A Report. Explore the contents of the report here or download the PDF to read the full report.
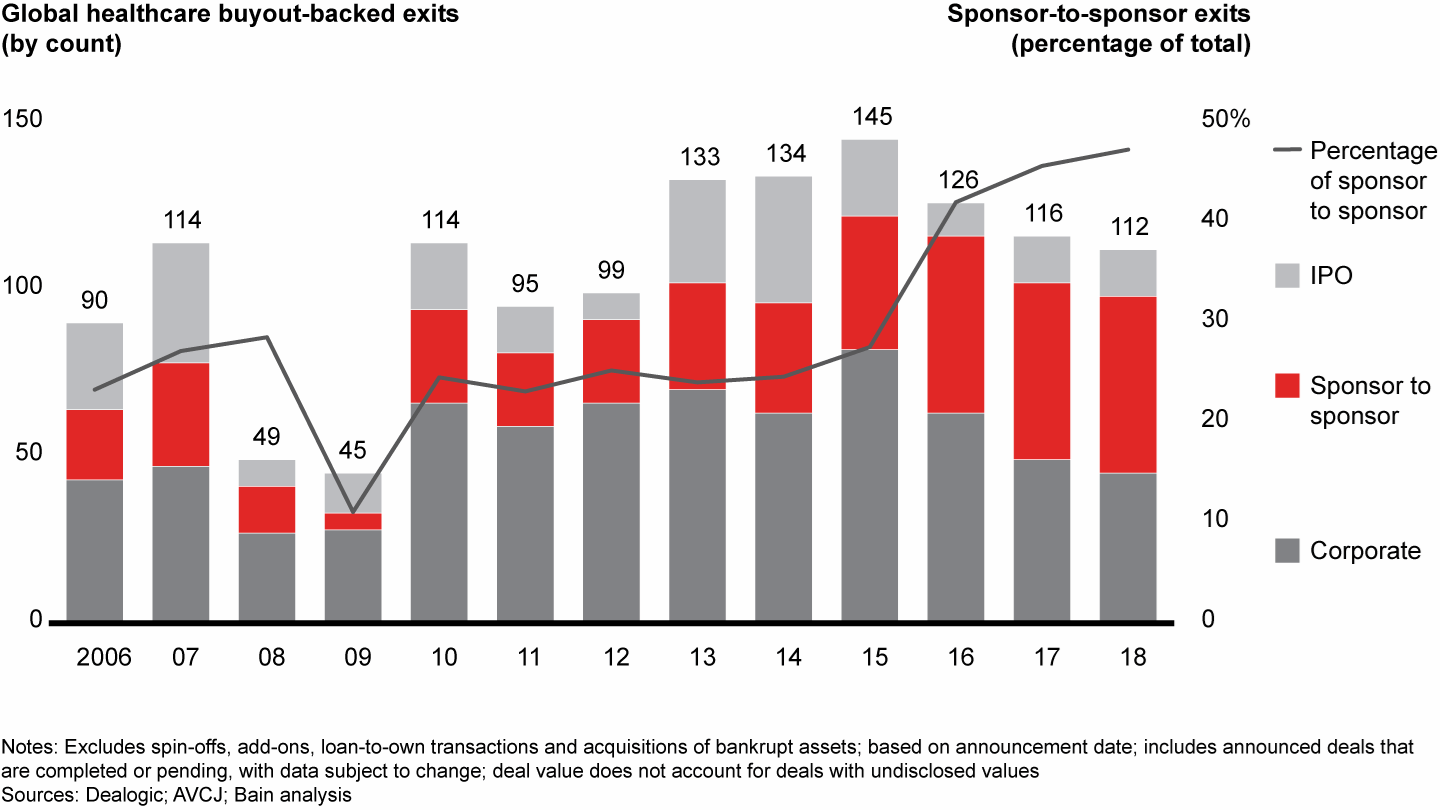
In a return to historical norms, exit volume and value both declined in 2018 from the year earlier. Volume fell to 112 in 2018 from 116 in 2017, the lowest level since 2012 (see Figure 12). This followed the spike in activity from 2012 to 2015, as funds now have cleared their books of the vast majority of assets acquired prior to the past recession.
While exit activity continued to decline, the share of transactions between financial sponsors remained high


Disclosed exit value fell to $31.6 billion in 2018 from $44.4 billion in 2017, driven by a 43% decline in the value of exits to corporates. The 2018 values came in at roughly half the 2015 and 2016 levels, mainly because of a decline in the median value of the top 10 exits. Still, those top exits accounted for about 60% of the value in 2018, and each was worth at least $1 billion.
From a regional perspective, although North America continues to be the most active region, accounting for a little more than half of volume, exit activity declined 13%, and disclosed value was down 46% compared with 2017, driven by fewer megadeals. North America’s decline was partially offset by a roughly 25% increase in European exit activity and a roughly 20% increase in the region’s disclosed value.
Turning to the Asia-Pacific region, exit activity and value held steady at a little more than 10% of global volume and a little less than $4 billion in disclosed value during both 2017 and 2018. As the market matures and the tail end of the first major Asia-Pacific healthcare investment cycle plays out, the region is beginning to see a growing number of high-profile sponsor-to-sponsor exits, such as EQT Partners’ sale of its stake in I-Med Radiology Network, the largest diagnostic imaging services provider in Australia, to Permira for $1 billion.
With IPO activity stable year over year, corporate and sponsor exits continued to account for a significant portion of value and volume. There were 14 IPOs in 2018, 8 of which were in biopharma. Despite that trend, the largest IPO of the year came in the provider sector, as Bain Capital partially exited Brazilian corporate health plan operator Grupo Notre Dame Intermedica, raising $800 million. The largest biopharma IPO of the year, at $373 million, was clinical-stage CAR-T treatment developer and Pfizer carve-out Allogene Therapeutics, in which TPG held a stake investment.
Relatively high private valuations continued to steer a growing share of exits to corporate acquirers or other PE funds, rather than to public markets. Exits to corporates accounted for roughly 40% of exit volume and three of the top four exits by value in 2018, including Summit Partners’ divestiture of Integrated DNA Technologies to Danaher Corporation for $2 billion.
The share of exits to sponsors remained high at 47% of total volume, up significantly from just 28% in 2015. Provider and medtech were the most popular sectors for sponsor exits in 2018, with 75% of sponsor-to-sponsor exit activity.
The recent buildup of capital for healthcare private equity has had a number of impacts, including high-profile exits to sponsors of category-leading assets. Increasingly, other sponsors are viewed as attractive exit options, especially if the selling firm can negotiate to maintain a minority stake. For example, KKR acquired a majority stake in Heartland Dental, the largest dental support organization in the US, from the Ontario Teachers’ Pension Plan. Additionally, Oak Hill Capital Partners led a recapitalization of VetCor, one of the largest veterinary hospital operators in the US, alongside existing management and existing investors Harvest Partners and Cressey & Company. Neither of the deal values were disclosed.
As sponsor activity picks up, exit characteristics have been changing for funds of different sizes. Given the competition for top assets and the immense amount of dry powder, small funds (less than $1 billion of funds raised over the past 10 years) find it harder to buy from other sponsors, while large funds (greater than $5 billion of funds raised over the past 10 years) are hunting for deals owned by smaller sponsors. A Bain analysis found that the share of exits from sponsors to small-cap funds dropped from roughly 20% in 2017 to about 10% in 2018. Large funds were acquirers in 66% of all sponsor-to-sponsor exits in 2018, up from just 40% in 2017.
In tandem, midsized funds (between $1 billion and $5 billion of funds raised over the past 10 years) increasingly look to boost returns by building platforms through operational improvements and bolt-on M&A. These funds typically then sell to similarly sized or larger funds that are willing to pay more for a platform asset. In 2017, roughly two-thirds of sponsor-to-sponsor exits went to same-sized or larger acquirers; in 2018, the share rose to more than three-quarters. For example, Water Street Healthcare Partners divested its stake in Premise Health, a leading provider of worksite care in the US, to OMERS Private Equity. After Water Street formed the platform in 2014 by merging two onsite care assets, it helped Premise expand its geographic footprint over the next four years through several strategic acquisitions and an investment in a technology platform.
As investors finished offloading the tail of their prerecession assets and preemptively took advantage of high private market valuations, typical holding periods returned to the standard three to five years, similar to periods immediately following the recession. The median holding period across all exits fell to 4.1 years, the lowest since 2009 and a roughly 20% decline from 2017 (see Figure 13). In fact, just 34% of all 2018 exits had holding periods greater than five years, down from 52% in 2017 and the lowest level since 2010.
Holding periods are returning to a steady-state level as investors offload recession-vintage assets and more quickly take advantage of high valuations


Looking ahead, funds may decide to opportunistically exit deals and take advantage of heavy sponsor demand for relatively recession-resistant assets and high valuations. On the other hand, funds may decide to lengthen their holding period if they possess a category-leading asset and don’t have pressure to sell. In some cases, a longer-term value-creation plan to raise incremental returns may be more valuable than selling top-performing assets and hunting for ways to redeploy large sums of new capital.
We are encouraged, however, by the recent growth in deal count and value over the past few years, and we see a large accumulation of three- to five-year vintage assets that are likely to retrade soon. Smart investors will have a strong hypothesis about the best exit options for an asset at the outset of the diligence process and will continue to reevaluate their exit timing and approach over the life of the investment.